An investigation into the applicability of rapid artificial intelligence-assisted compressed sensing in brain magnetic resonance imaging performed at 5 Tesla field strength
Abstract
Background
Brain magnetic resonance imaging (MRI) at 5 T offers unprecedented spatial resolution but is often limited by long scan times. Acceleration techniques, such as compressed sensing (CS) and artificial intelligence-assisted compressed sensing (ACS), have the potential to speed up the acquisition process while maintaining image quality. This study aims to evaluate and compare the performance of CS and ACS (with various acceleration factors) in brain MRI imaging at 5 T.
Methods
In this study, we enrolled 12 healthy volunteers and compared ACS-accelerated 5 T brain MRI with conventional methods of CS. The ACS acceleration factors for the brain protocol, consisting of 3D T1-weighted sequences and 2D T2-weighted sequences, were optimized in a pilot study on healthy volunteers (acceleration factor, 2.06–3.41× in T2-weighted imaging and 3.52–8.49× in T1-weighted imaging). We evaluated the images acquired from patients using various acceleration methods on the basis of acquisition times, the signal-to-noise ratio (SNR), the contrast-to-noise ratio, subjective image quality, and diagnostic agreement.
Results
Our findings revealed that ACS acceleration significantly reduced the acquisition times for T1- and T2-weighted sequences by up to 43% and 53%, respectively, compared with traditional CS at 5 T. Importantly, this acceleration was achieved while maintaining excellent image quality, demonstrated by higher or comparable SNR and contrast-to-noise ratio values.
Conclusions
The optimal ACS acceleration factors for 5 T brain MRI were determined to be 2.73× for 2D T2-weighted sequences and 6.5× for 3D T1-weighted sequences. ACS not only facilitates rapid imaging but also ensures comparable image quality and diagnostic performance, highlighting its potential to revolutionize high-field MRI scanning.
Abbreviations
-
- ACS
-
- artificial intelligence-assisted compressed sensing
-
- AI
-
- artificial intelligence
-
- CNN
-
- convolutional neural network
-
- CNR
-
- contrast-to-noise ratio
-
- CS
-
- compressed sensing
-
- FOV
-
- field of view
-
- ICC
-
- intraclass correlation coefficient
-
- MRI
-
- magnetic resonance imaging
-
- PI
-
- parallel imaging
-
- ROI
-
- region of interest
-
- SAR
-
- specific absorption rate
-
- SNR
-
- signal to-noise ratio
-
- T
-
- Tesla
-
- T1WI
-
- T1-weighted imaging
-
- T2WI
-
- T2-weighted imaging
1 INTRODUCTION
Magnetic resonance imaging (MRI) of the brain plays a crucial role in the diagnosis and treatment of various neurological disorders. However, a significant challenge encountered in clinical brain scanning is the lengthy acquisition time, which can often lead to patient discomfort, motion artifacts, and reduced image clarity. Long scan durations not only compromise patient comfort but also increase the probability of motion interference, particularly in patients with neurological impairments and pediatric patients. As a result, there is a pressing need to develop advanced accelerated scan protocols that can shorten the acquisition time while maintaining or even improving image quality [1, 2].
Against this backdrop, our study opts for a 5 Tesla (T) MRI scanner. This choice is driven by its distinct advantages over both 3 and 7 T scanners. Compared with a 3.0 T scanner, a 5 T scanner offers superior signal intensity and contrast, resulting in higher-resolution imaging that reveals finer anatomical details [3, 4]. Moreover, although a 7 T scanner boasts even greater resolution [5, 6], it faces technical challenges such as B1 field inhomogeneity and elevated specific absorption rate (SAR) distributions, posing safety concerns and limiting its clinical use for whole-body imaging [7-9]. In contrast, the recently introduced 5 T clinical MRI scanner addresses these issues, providing excellent image homogeneity, contrast uniformity, and reduced SAR risks. Therefore, employing a 5 T scanner ensures a balance between achieving the high-resolution imaging essential for precise analysis and maintaining patient safety, making it the most suitable option for exploring brain ACS under various acceleration factors.
Compressed sensing (CS) technology has emerged as a promising approach to accelerate MRI acquisition. By exploiting the sparsity of images in certain transform domains, CS allows for the reconstruction of high-quality images from undersampled k-space data [10, 11]. However, the application of CS at high acceleration factors is often limited by a reduction in the signal-to-noise ratio (SNR) and an increase in image artifacts. These limitations pose challenges to achieving significant acceleration without compromising image quality [12].
To address these challenges, artificial intelligence (AI)-assisted compressed sensing (ACS) has been introduced as an innovative acceleration solution [13-15]. ACS combines the principles of CS with the power of deep learning algorithms, specifically convolutional neural networks (CNNs). By pre-training CNNs on large datasets of fully sampled MR images, ACS is able to learn the underlying image structure information. This pre-trained knowledge is then used during the reconstruction of undersampled images, enabling high acceleration factors while also maintaining high image quality.
The technology of CS has been extensively studied in the context of brain structural imaging [16, 17], neuroimaging [18, 19], and brain diseases [20], yet ACS remains relatively untested in head research [21]. Specifically, the imaging quality of 5 T MR imaging of the brain using ACS has not been validated. In this study, we aim to evaluate the performance of ACS in brain MRI at 5 T, comparing it with conventional CS and analyzing the effects of different ACS acceleration factors for T1- and T2-weighted sequences on image quality metrics such as the SNR and contrast-to-noise ratio (CNR), as well as performing subjective image assessments. By doing so, we seek to determine the optimal acceleration factors for ACS that balance scan time reduction and image fidelity. The results of this study have the potential to provide valuable insights aiding the clinical application of ACS for brain MRI, ultimately contributing to improved patient comfort, scanner use, and diagnostic accuracy.
2 MATERIALS AND METHODS
2.1 Participants
The study cohort comprised 12 healthy volunteers (7 males and 5 females; mean age, 42.6 ± 7.6 years; age range: 27–56 years) who were recruited specifically for this research. All volunteers underwent a thorough screening process to ensure they met the inclusion criteria, which were as follows: (1) no history of significant medical conditions or neurological disorders; (2) no contraindications for MRI scanning; and (3) willingness to participate in the study and adhere to the required protocols. Exclusion criteria included pregnancy, claustrophobia, and any metal implants that could interfere with MRI scanning. The study was conducted in accordance with the ethical guidelines of our institution, and written informed consent was obtained from all volunteers prior to their participation.
2.2 MR image acquisition
All participants underwent scanning on a 5 T MR scanner (uMRJupiter; United Imaging Healthcare, Shanghai, China). Participants were positioned supine, using a 48-channel cranial coil head to ensure optimal signal reception. Their heads were stabilized throughout the scanning process to minimize movement artifacts. The scanning procedure encompassed the entire brain and employed both 2D T2-weighted fast spin echo sequences and 3D T1-weighted gradient echo sequences with the acceleration techniques of CS and ACS. Detailed parameters for each sequence are listed in Tables 1 and 2.
| Parameters | T2-CS | T2-ACS1 | T2-ACS2 | T2-ACS4 | T2-ACS6 |
|---|---|---|---|---|---|
| FOV (mm × mm) | 200 × 230 | 200 × 230 | 200 × 230 | 200 × 230 | 200 × 230 |
| Slice thickness (mm) | 3.0 | 3.0 | 3.0 | 3.0 | 3.0 |
| Acquisition matrix | 570 × 656 | 570 × 656 | 570 × 656 | 570 × 656 | 570 × 656 |
| Repetition time (ms) | 11,729 | 11,729 | 11,729 | 11,729 | 11,729 |
| Echo time (ms) | 111.36 | 100.76 | 100.76 | 100.76 | 100.76 |
| Refocusing flip angle (°) | 110 | 110 | 110 | 110 | 110 |
| Bandwidth (Hz/Pixel) | 260 | 260 | 260 | 260 | 260 |
| Echo train length | 21 | 23 | 23 | 23 | 23 |
| Acceleration factor | 2.06 | 2.10 | 2.27 | 2.73 | 3.41 |
| Acquisition time (min:s) | 7:01 | 6:15 | 5:40 | 4:41 | 3:43 |
- Abbreviations: ACS, artificial intelligence-assisted compressed sensing; CS, compressed sensing; FOV, field of view; T2WI, T2-weighted imaging.
| Parameters | T1-CS | T1-ACS1 | T1-ACS2 | T1-ACS4 | T1-ACS6 |
|---|---|---|---|---|---|
| FOV (mm × mm × mm) | 240 × 256 × 210 | 240 × 256 × 210 | 240 × 256 × 210 | 240 × 256 × 210 | 240 × 256 × 210 |
| Slice thickness (mm) | 0.8 | 0.8 | 0.8 | 0.8 | 0.8 |
| Acquisition matrix | 300 × 320 | 300 × 320 | 300 × 320 | 300 × 320 | 300 × 320 |
| Repetition time (ms) | 9.2 | 9.2 | 9.2 | 9.2 | 9.2 |
| Echo time (ms) | 3.2 | 3.2 | 3.2 | 3.2 | 3.2 |
| Refocusing flip angle (°) | 9 | 9 | 9 | 9 | 9 |
| Bandwidth (Hz/Pixel) | 160 | 160 | 160 | 160 | 160 |
| Echo train length | 165 | 165 | 165 | 165 | 165 |
| Acceleration factor | 3.62 | 3.52 | 4.66 | 6.5 | 8.49 |
| Acquisition time (min:s) | 4:16 | 4:24 | 3:21 | 2:23 | 1:50 |
- Abbreviations: ACS, artificial intelligence-assisted compressed sensing; CS, compressed sensing; FOV, field of view; T1WI, T1-weighted imaging.
2.3 ACS image reconstruction
ACS reconstruction is an advanced method that combines the benefits of CS, parallel imaging (PI), partial Fourier, and AI for accelerated MRI. The core of ACS lies in its integration of these techniques within an iterative reconstruction framework. Specifically, the method exploits the sparsity constraint inherent in CS to reconstruct images from highly undersampled k-space data, thereby resulting in accelerated image acquisition. PI techniques further accelerate the scan by exploiting the spatial sensitivity of multiple receiver coils. The partial Fourier method also contributes to scan time reduction by acquiring only half of the k-space data along the phase-encoding direction.
2.4 Quantitative analysis
2.5 Quality assessment
The image quality assessment in this study was conducted independently by two radiologists, both possessing 3 years of clinical experience, who remained blinded to the nature of the images they were evaluating. The overall quality of the individual images was assessed using a modified five-point ordinal Likert scale considering sharpness, distortion, and artifacts as the key metrics for evaluating the overall image quality. The scoring criteria were as follows: (1) nondiagnostic, indicating images deemed not clinically useful; (2) poor, signifying noticeable motion-related artifacts or image distortion, yet still partially diagnostic; (3) adequate, showing moderate motion-related artifacts or image distortion, but of sufficient quality for ventricular contour tracing; (4) good, exhibiting only mild motion-related artifacts or image distortion; and (5) excellent, denoting minimal to virtually no motion-related artifacts or image distortion. This systematic approach ensured a rigorous and standardized evaluation of image quality.
2.6 Statistical analysis
The Shapiro–Wilk test was initially conducted to assess the normality of the data distribution. Subsequently, the Friedman test with Bonferroni correction was used to ascertain whether significant variations existed among CS and ACS images with different acceleration factors, specifically evaluating the SNR and CNR.
Additionally, intraclass correlation coefficients (ICCs) were computed to assess interobserver reliability. Agreement was classified on the basis of the ICCs, as follows: 0.8–1.0, excellent agreement; 0.6–0.8, substantial agreement; 0.4–0.6, moderate agreement; 0.2–0.4, fair agreement; and 0.0–0.2, poor agreement. Statistical significance was determined by a p < 0.05. All statistical analyses were executed using SPSS version 26.0 (IBM Corp., Armonk, NY, USA).
3 RESULTS
In our study, we compared the performance of traditional CS with varying acceleration factors of ACS in 3D T1- and 2D T2-weighted MRI sequences. For the CS technique, acceleration factors of 3.62 and 2.06 were employed, whereas the ACS method used acceleration factors ranging from 3.52× to 8.49× for the 3D T1 sequence and from 2.10× to 3.41× for the 2D T2 sequence. As the ACS acceleration factor increased, we observed a significant reduction in scanning time. Specifically, for the 3D T1 sequence, the scanning duration gradually decreased from 4 min 24 s to 1 min 50 s. Similarly, for the 2D T2 sequence, the scanning time was reduced from 6 min 15 s to 3 min 43 s. In terms of image quality, we assessed the SNR and CNR, as shown in Figures 1-3. Notably, in the 2D T2 sequence, ACS demonstrated consistently superior performance compared with traditional CS across different acceleration factors (Figure 1). However, in the 3D T1 sequence, ACS and traditional CS exhibited comparable performance (Figure 2). The overall subjective image quality of T1- and T2-weighted images with different acceleration methods or factors was evaluated, and the results are displayed in Table 3. The interobserver agreement was strong for all techniques, with ICCs exceeding 0.8.
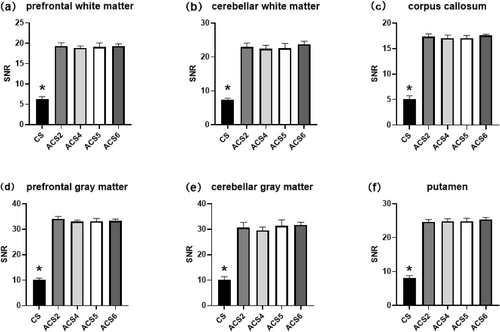
T2WI SNR of the (a) prefrontal white matter, (b) cerebellar white matter, (c) corpus callosum, (d) prefrontal gray matter, (e) cerebellar gray matter, and (f) putamen (shell nucleus of the basal ganglia). Statistically significant differences (p < 0.05) are marked with asterisks. ACS, artificial intelligence-assisted compressed sensing; CS, compressed sensing; SNR, signal to-noise ratio; T2WI, T2-weighted imaging.
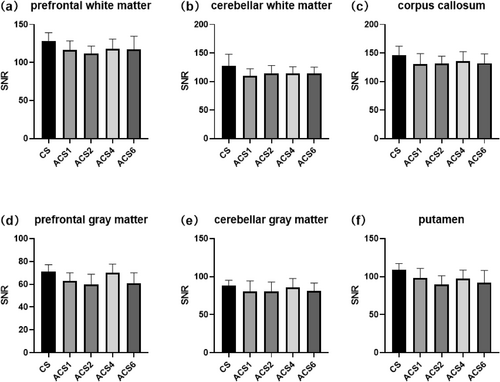
T1WI SNR of the (a) prefrontal white matter, (b) cerebellar white matter, (c) corpus callosum, (d) prefrontal gray matter, (e) cerebellar gray matter, and (f) putamen (shell nucleus of the basal ganglia). Statistically significant differences (p < 0.05) are marked with asterisks. ACS, artificial intelligence-assisted compressed sensing; CS, compressed sensing; SNR, signal to-noise ratio; T1WI, T1-weighted imaging.
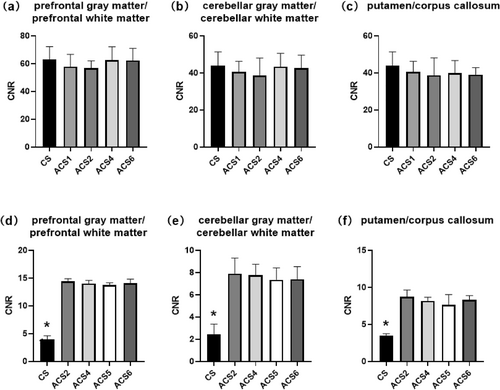
T1WI CNR of the (a) prefrontal gray matter/prefrontal white matter, (b) cerebellar gray matter/cerebellar white matter, and (c) putamen/corpus callosum. T2WI CNR of the (d) prefrontal gray matter/prefrontal white matter, (e) cerebellar gray matter/cerebellar white matter, and (f) putamen/corpus callosum. Statistically significant differences (p < 0.05) are marked with asterisks. ACS, artificial intelligence-assisted compressed sensing; CNR, contrast-to-noise ratio; CS, compressed sensing; T1WI, T1-weighted imaging; T2WI, T2-weighted imaging.
| Image quality score | Image quality score | ||||||||||||||
|---|---|---|---|---|---|---|---|---|---|---|---|---|---|---|---|
| T2WI | 1 | 2 | 3 | 4 | 5 | ICC | T1WI | 1 | 2 | 3 | 4 | 5 | ICC | ||
| CS | Reader 1 | 1 | 1 | 2 | 4 | 2 | 0.877 | CS | Reader 1 | 0 | 1 | 2 | 3 | 4 | 0.864 |
| Reader 2 | 0 | 1 | 3 | 2 | 4 | Reader 2 | 0 | 0 | 1 | 4 | 5 | ||||
| ACS2 | Reader 1 | 0 | 0 | 1 | 3 | 6 | 0.892 | ACS1 | Reader 1 | 0 | 0 | 1 | 3 | 6 | 0.897 |
| Reader 2 | 0 | 0 | 0 | 5 | 5 | Reader 2 | 0 | 0 | 1 | 4 | 5 | ||||
| ACS4 | Reader 1 | 0 | 0 | 1 | 5 | 4 | 0.885 | ACS2 | Reader 1 | 0 | 0 | 2 | 2 | 6 | 0.875 |
| Reader 2 | 0 | 0 | 1 | 4 | 5 | Reader 2 | 0 | 0 | 0 | 4 | 6 | ||||
| ACS5 | Reader 1 | 0 | 0 | 0 | 4 | 6 | 0.869 | ACS4 | Reader 1 | 0 | 0 | 1 | 3 | 6 | 0.839 |
| Reader 2 | 0 | 0 | 1 | 3 | 6 | Reader 2 | 0 | 0 | 2 | 3 | 5 | ||||
| ACS6 | Reader 1 | 0 | 1 | 0 | 4 | 5 | 0.842 | ACS6 | Reader 1 | 0 | 1 | 1 | 4 | 4 | 0.896 |
| Reader 2 | 0 | 0 | 2 | 4 | 4 | Reader 2 | 0 | 0 | 1 | 4 | 5 | ||||
- Abbreviations: ACS, artificial intelligence-assisted compressed sensing; CS, compressed sensing; ICC, intraclass correlation coefficient; T1WI, T1-weighted imaging; T2WI, T2-weighted imaging.
4 DISCUSSION
This study comprehensively investigated the performance of traditional CS and advanced compressed sensing (ACS) techniques at various acceleration factors in both 2D T2 and 3D T1 sequences.
The application of 5 T ultra-high-field MRI provides the necessary hardware support for whole-body high-resolution imaging, enabling the visualization of finer structures within the human body. This enhanced resolution offers a stronger foundation for clinical diagnosis. However, it also leads to increased scanning durations and an elevated risk of exceeding the SAR limits. Prolonged scan times can affect patient comfort, increase the likelihood of motion artifacts, and potentially compromise image quality. Therefore, accelerated scanning at 5 T becomes imperative.
CS is a signal-processing technique that allows for the efficient recovery of sparse or compressible signals from a small number of non-adaptive linear measurements. In the context of MRI, CS has been widely used to accelerate image acquisition by reducing the number of k-space samples required, thereby shortening scan times [23]. This technology exploits the inherent sparsity of MRI images in certain transform domains, such as wavelet or gradient domains, to reconstruct high-quality images from undersampled data [24]. ACS, on the other hand, takes CS a step further by integrating CS, PI, partial Fourier transformation, and deep learning-based reconstruction. ACS leverages deep learning techniques to enhance the quality of image reconstruction, especially in challenging scenarios where traditional CS might struggle [25]. For instance, in the case of brain MRI, ACS can use prior knowledge about the anatomy and structure of the brain to improve image quality and reduce artifacts [21].
In term of practical application of ACS, the selection of the acceleration factor plays a pivotal role in balancing scanning duration and image quality. An appropriate acceleration factor will ensure that the tissue structures remain clear, facilitating accurate clinical diagnosis, while also considering the patient's tolerance with respect to scanning time to minimize motion artifacts. Our findings suggest that for the 2D T2 sequence, an acceleration factor of 2.73× is optimal. This factor results in a scanning time reduction of 2 min 20 s (33.25% reduction) compared with traditional CS. For the 3D T1 sequence, the optimal acceleration factor was found to be 6.5×, leading to a scanning time decrease of 2 min 18 s (44.14% reduction) compared with standard CS.
In addition to its rapid acquisition time, our results indicate that the ACS-accelerated 2D T2 sequence offers substantial benefits in terms of achieving higher SNR and CNR. However, significantly improved T2WI image quality was seen with ACS compared with CS (Figure 4). Nevertheless, as the ACS acceleration factor increases, the image quality does not consistently align with the observed trends in SNR and CNR. Specifically, for acceleration factors ranging from 1 to 4, the image benefits from artifact reduction (as indicated by the green arrow) and improved sharpness (as indicated by the yellow arrow) with an increase in the acceleration factor (Figure 4). However, when the acceleration factor is set to 6, image artifacts become more pronounced, and sharpness decreases (Figure 4). These observations are also consistent with the conclusions drawn from the image quality assessment.
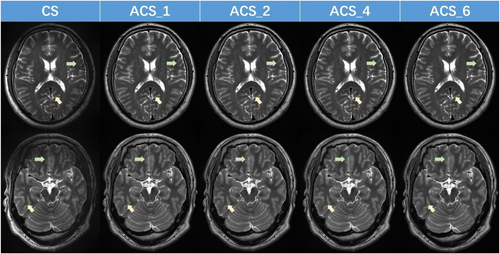
T2-weighted 5 T magnetic resonance images acquired using CS and ACS (with varying acceleration factors). ACS, artificial intelligence-assisted compressed sensing; CS, compressed sensing.
Furthermore, our findings reveal that the ACS-accelerated 3D T1 sequence not only decreases scan time as acceleration factors increase but also maintains an SNR and CNR comparable to CS. Additionally, on the basis of the images and image quality scores presented in Figure 5 and Table 3, it is evident that when the acceleration factor is 4, the sharpness of the image surpasses that of images with other acceleration factors (as indicated by the yellow arrow). Moreover, the distortion and artifact levels are minimal (as indicated by the blue arrow).
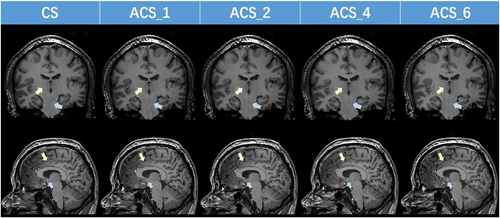
T1-weighted 5 T magnetic resonance images using CS and ACS (with varying acceleration factors). ACS, artificial intelligence-assisted compressed sensing; CS, compressed sensing.
In the comparative experiment of different acceleration factors for brain ACS, there were several limitations that require attention and further exploration. First, the sample size of this experiment was limited to only 12 participants, which may not provide sufficient statistical power for comprehensive conclusions to be drawn. Future studies should aim to collect larger samples to enhance the validity and reliability of the findings. Second, all participants in this study were healthy individuals. This restricts the generalizability of the results to patients with actual brain pathologies. To fully assess the efficacy of ACS acceleration techniques in clinical settings, it is essential to include a more diverse population, especially those with known brain diseases. Observing how ACS performs at different acceleration factors in identifying and discriminating lesion areas would provide valuable insights into its diagnostic accuracy. Moreover, although the current study focused on the technical aspects of ACS acceleration, future research should also consider integrating pathological diagnoses to validate the diagnostic accuracy of the imaging techniques. This would provide a more comprehensive understanding of the relationship between imaging results and actual pathological conditions. Lastly, the role of spatial resolution in diagnostic accuracy was not fully explored in this study. Future research could investigate how ACS methods can be optimized to achieve higher resolution while maintaining acceptable acquisition times. Determining the optimal balance between resolution and scan duration, especially for patients who may have limited tolerance because of pain or discomfort, remains an important area for further study.
5 CONCLUSIONS
Overall, our findings suggest that ACS offers significant advantages in terms of reducing scanning time while maintaining or even improving image quality, particularly in 2D T2 sequences. These results pave the way for further optimization of MRI protocols, balancing scanning efficiency and image quality.
AUTHOR CONTRIBUTIONS
Jiaqi Wang: Data curation (equal); writing—review and editing (equal). Liqiang Zhou: Software (equal); writing—original draft (equal).
ACKNOWLEDGMENTS
The authors thank the research technologists at United Imaging Healthcare, including Guobin Li, Jianmin Yuan, and Ran Tang, who supported this work.
CONFLICT OF INTEREST STATEMENT
The authors declare no conflict of interest.
ETHICS STATEMENT
Not applicable.
INFORMED CONSENT
All participants provided written informed consent at the time of entering this study.
Open Research
DATA AVAILABILITY STATEMENT
The data that support the findings of this study are available from the corresponding author upon reasonable request.


