Demographic and net primary productivity dynamics of primary and secondary tropical forests in Southwest China under a changing climate
气候变化背景下中国西南热带原始林和次生林的群落和净初级生产力动态研究
Editor-in-Chief & Handling Editor: Ahimsa Campos-Arceiz.
Abstract
enTropical forests are major carbon sinks on the Earth's land surface. However, our understanding of how the demographic rate and carbon sink capacities of tropical forests respond to climate change remains limited. In this study, we investigated the impacts of environmental drivers on forest growth, mortality, recruitment, and stem net primary productivity (NPPstem) over 16 years at five tropical forest plots in Xishuangbanna, Southwest China. These plots are along a successional gradient spanning three tropical secondary forests (tropical secondary forest-1 [TSF-1], tropical secondary forest-2 [TSF-2], and tropical secondary forest-3 [TSF-3]) and two primary forests (tropical rainforest [TRF] and tropical karst forest [TKF]). Our results showed that early successional secondary forests (TSF-2 and TSF-3) had higher diameter growth rates and relative mortality rates. An extreme drought event during 2009–2010 reduced the growth rate, relative recruitment rate, and NPPstem for most plots while increasing mortality in early successional forest plots. We observed significant negative effects of maximum temperature (Tmax) on NPPstem and diameter growth rate across all plots. Additionally, we found that precipitation had significant positive effects on diameter growth rate across all plots. Furthermore, tree mortality increased with rising Tmax, whereas precipitation significantly enhanced tree recruitment. Our findings highlight the vulnerability of tree growth, mortality, recruitment, and productivity in tropical forests to extreme drought events in Southwest China. Continued climate warming and more frequent droughts will induce higher mortality rates and impede growth, thus reducing the carbon sink capacity of tropical forests, especially in early successional stage tropical secondary forests.
摘要
zh热带森林是地球上陆地生态系统重要的碳汇。然而目前对于热带森林的群落动态和碳汇能力如何响应气候变化方面的研究较少。在本研究中,我们分析了环境因子对过去16年来西双版纳地区五个热带森林样地直径生长率、死亡率、更新以及树干净初级生产力的影响。这五个森林样地包括三个热带次生林(TSF-1, TSF-2和 TSF-3)以及两个热带原始林(热带季节雨林TRF、热带喀斯特森林TKF)。结果显示演替早期的次生林(TSF-2, TSF-3)表现出更高的直径生长率和相对死亡率。2009-2010年的极端干旱事件使得大部分样地的直径生长率、相对更新率和NPPstem下降,而处于演替早期的次生林样地的死亡率显著增加。发现最高气温(Tmax)与NPPstem和直径生长率呈显著的负相关关系,而降水与五个样地的直径生长率呈显著的正相关关系。树木的死亡率与Tmax呈显著的正相关关系,而更新率与降水呈显著的正相关关系。本研究强调了中国西南地区热带森林的生长、死亡、更新以及生产力对极端干旱事件的脆弱性。持续的气候变暖以及频发的干旱事件将会导致树木生长的下降和死亡率的增加,进而降低热带森林的碳汇能力,而这种影响对于演替早期的热带次生林更为严峻。【翻译:付培立】
Plain language summary
enTropical forests are vital components of the global carbon cycle and play an important role in mitigating climate change. However, the effects of climate change on the dynamics of these ecosystems are not fully understood. In this study, we explored how different types of tropical forests in Southwest China responded to climate change from 2004 to 2020. By tracking forest growth, mortality, regeneration, and productivity, we found that secondary forests, especially those at early successional (younger) stages, are more vulnerable to extreme climatic events like droughts and heat waves. These events reduced tree growth and regeneration, increased tree mortality, and impacted the forests' ability to fix carbon. Climate change, including rising temperatures and more frequent droughts, may decrease tropical forest growth, recruitment, and carbon sequestration while increasing tree mortality in the future.
简明语言摘要
zh热带森林是全球碳循环的关键组成部分,对于缓和气候变化的影响具有重要的作用,然而关于气候变化如何影响热带森林动态方面还有待于进一步的研究。本研究分析了气候变化对中国西南地区不同类型的热带森林在2004-2020年影响。发现五个热带森林样地的生长、死亡、更新以及生产力均呈显著的年际变化。其中处于演替早期的热带森林对极端气候事件的响应更加敏感,极端干旱事件使得其树木的生长率、更新率以及树干净初级生产力的降低和死亡率升高。未来持续的气温变暖和频发的干旱事件将会降低热带森林的生长速率、更新率和固碳潜力。
Practitioner points
en
-
Secondary tropical forests demonstrate superior growth rates. Policymakers and forest managers should prioritize these forests alongside primary forests for conservation and restoration efforts.
-
Early successional tropical secondary forests are more vulnerable to hot-dry climate. Forest managers should focus on the scientific and sustainable management of these forests to mitigate the effects of temperature extremes and drought.
-
Climate warming threatens tropical tree growth, recruitment, and tropical forest carbon sink capacity. Experts need to develop proactive management practices and climate-resilient strategies to address these challenges.
实践者要点
zh
-
热带次生林具有较高的生长速率,因此决策者和森林管理者应加强对热带次生林的保护和恢复。
-
处于演替早期的热带次生林对干热气候更为敏感,因此森林的管理者应该加强对该类型森林科学和可持续管理以应对气候变化的影响。
-
气候变暖将威胁热带森林的生长、更新以及碳汇能力。因此应采取主动的管理手段和气候适应型的措施以应对这些挑战。
1 INTRODUCTION
Tropical forests serve as crucial carbon sinks and carbon pools (Bonan, 2008; Pan et al., 2011). However, their carbon sink capacity faces challenges due to climate change (Corlett, 2016; Cramer et al., 2004). Global climate change significantly impacts tropical ecosystem dynamics through increasing temperatures, changes in precipitation patterns, and more frequent and intense droughts (Corlett, 2016). Specifically, these impacts extend to reducing long-term tree growth (Lewis et al., 2009; Lewis, 2006; Malhi & Phillips, 2004), increasing tree mortality (Calvo-Rodriguez et al., 2021; Chen et al., 2021), and altering plant community composition, structure, and overall ecosystem functioning (Deb et al., 2018; Mina et al., 2018). Tropical forests in different successional stages respond uniquely to regional climate change (Lewis et al., 2004). However, our understanding of the responses of tropical forests at different successional stages to regional climate change remains limited (Sheldon, 2019).
Dynamic shifts in demographic patterns (growth, mortality, and recruitment) within tropical forests along successional gradients are influenced by anthropogenic activity and global changes, posing significant challenges for conservation and management (Wright, 2005). Primary forests are typically characterized by stable demographic rates and a diverse mix of mature trees, saplings, and seedlings (Gibson et al., 2011). In contrast, secondary forests exhibit significant demographic variations characterized by rapid expansion of pioneer species and high mortality rates (Wright, 2005). Despite these differences, secondary forests harbor substantial conservation potential as carbon sinks (Heinrich et al., 2023; Pugh et al., 2019), attributed to increasing resource availability and potentially influenced by rising atmospheric CO2 concentrations (Lewis et al., 2009). The area of secondary tropical forests is expanding globally (Brown & Lugo, 1990), while the total forest area has declined (Keenan et al., 2015). The expansion of secondary forests offers an opportunity for tree restoration and carbon sequestration, especially with essential information available on the demographic patterns of secondary forests under environmental change (Harris et al., 2006; Peng et al., 2010). Understanding the demographic rates between primary and secondary forests is critically important because there is potential for an additional 0.9 billion ha of continuous secondary forest cover (Bastin et al., 2019).
Stem net primary productivity (NPPstem) serves as a critical metric in assessing the collective biomass production and carbon dynamics within a defined area of a forest ecosystem (Ohtsuka et al., 2005). Estimating carbon accumulation over time is crucial for carbon budgeting and assessing ecosystem dynamics (Baishya & Barik, 2011). Tropical secondary forests demonstrate higher carbon uptake, with an approximate accumulation rate of 3 Mg C ha−1 year−1 (Chazdon et al., 2016; Poorter et al., 2016), surpassing by an order of magnitude the levels observed in mature and old-growth primary tropical forests, which typically exhibit rates around 0.5 Mg C ha−1 year−1 (Mitchard, 2018). Climate warming is associated with reduced carbon sink potential on the global scale (von Buttlar et al., 2018). However, regional studies, such as one conducted in China, have shown increased carbon sink capacity under a warming climate (Gao et al., 2004), indicating that the effects of climate change on carbon sinks can vary by location. Within the scope of carbon-related studies, remote sensing-based monitoring is gaining attention, but it often includes biased estimations of forest carbon budget and productivity. Periodical biometric measurements, such as tree diameter, provide a more accurate approach to estimating forest carbon dynamics (Zhao et al., 2018). Most studies have focused on short-term local climate and forest productivity using ground-based measurement estimations (Köhl et al., 2015; Phillips et al., 2009). However, comprehensive, decadal-scale monitoring of climate and forest productivity remains rare (Kovács & Gulácsi, 2019), especially for forests in tropical regions at different successional stages.
In this study, we used forest inventory data collected over 16 years from five tropical forest plots in Southwest China, each representing different successional stages (i.e., early, late, and mature stages). Our study aims to address the following questions: (i) What are the trends in long-term demographic rates and NPPstem across tropical forests at different successional stages? (ii) Do demographic rates and NPPstem differ among the five tropical forest plots? (iii) What environmental variables drive tree demography patterns and NPPstem across tropical forests at different successional stages? We hypothesize that growth and NPPstem will decrease, while mortality will increase with climate warming. We expect to observe higher demographic rates and NPPstem in early successional secondary forests compared to primary mature forests and the secondary forest in the late successional stage. Furthermore, we anticipate that maximum temperature will have the most substantial negative effect on tree growth and NPPstem, while precipitation/moisture availability will be the limiting factor for growth rate and tree recruitment across different forest plots.
2 MATERIALS AND METHODS
2.1 Site descriptions and climate
The study sites are located within the Xishuangbanna National Nature Reserve, Yunnan, Southwest China. We selected five permanent tropical forest plots, each representing different successional statuses and forest types (Table 1 and Supporting Information: Table S7). TKF exhibited the highest tree density, whereas TRF had the highest number of tree species and the greatest canopy height (Table 1 and Supporting Information: Table S7). The basal area was highest in TKF and lowest in TSF-2. Among the top 10 dominant species in each plot, TSF-3 and TSF-2 had the highest number of pioneer species (Supporting Information: Table S7). Human disturbances in the studied forest plots are minimal, primarily involving light interventions by local communities for the collection of wild vegetables and tourism activities. Moreover, there is no artificial felling of forest trees within the five forest plots.
| Plot name | Plot size (m2) | Elevation (m. asl) | Forest type | Successional Stage | Tree density (ha−1) (DBH ≥ 2 cm) | No. of species | Basal area (m2 ha−1) |
|---|---|---|---|---|---|---|---|
| TRF | 100 × 100 | 750 | Primary | Climax | 2104 | 185 | 22.49 |
| TKF | 50 × 50 | 640 | Primary | Climax | 2520 | 29 | 25.31 |
| TSF-1 | 50 × 100 | 560 | Secondary | Late succession | 991 | 81 | 23.77 |
| TSF-2 | 50 × 50 | 630 | Secondary | Early succession | 1484 | 70 | 10.66 |
| TSF-3 | 50 × 50 | 820 | Secondary | Early succession | 2208 | 70 | 21.98 |
- Abbreviations: DBH, diameter at breast height; TKF, tropical karst forest; TRF, tropical rainforest; TSF, tropical secondary forest.
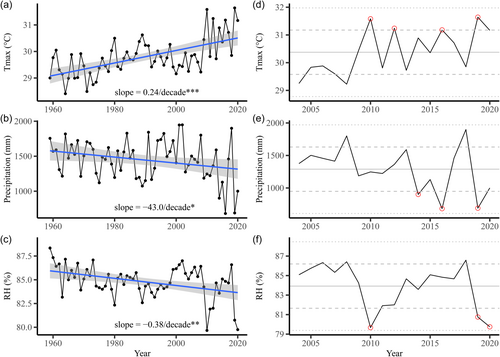
The Xishuangbanna region is characterized by a typical tropical monsoon climate with distinct dry and wet seasons. The dry season lasts from November to April, while the wet season occurs from May to October. The wet season is marked by heavy summer monsoon rainfall, which accounts for over 80% of the total annual precipitation (Cao et al., 2006; Supporting Information: Figure S2). Interannual variations in mean annual temperature are mild, ranging between 21.6°C and 23°C. In contrast, total annual precipitation varies greatly from year to year, ranging between 947 mm and 1799 mm from 2004 to 2020 (Figure 1e). The annual precipitation and relative humidity have been decreasing significantly, while maximum temperatures have shown a significant increase in recent decades (Figure 1a–c). In 2010, a historical drought event occurred in the study area (Figure 1d,f) (Li et al., 2019).
2.2 Forest inventory survey
A series of forest inventory surveys were conducted within the five forest plots from 2004 to 2020. Surveys were conducted annually before 2010, with a transition to a 5-year interval implemented thereafter. During each survey, all individual trees with a minimum DBH (diameter at breast height at 1.3 m above ground) of at least 2 cm were assessed. The survey recorded species names, tree height, and DBH, assigned unique identification tags to newly recruited individuals, and noted any dead trees.
2.3 Environmental conditions
All the tropical forest plots studied in this research share the same climatic conditions as they are located near each other within the same valley (within ~15 km distance). Therefore, we used the same climate data from the Xishuangbanna Station for Tropical Rain Forest Ecosystem Studies (XSTRFES) for all plots. The climate station of XSTRFES is situated within the Xishuangbanna Tropical Botanical Garden (21°54′ N, 101°46′ E, 580 m a.s.l.), and all five forest plots are within 10 km of this climate station. Soil water content (SWC) across the plots varies due to differences in topo-geology and forest successional history. SWC was measured at a depth of 20 cm using gravimetric methods. SWC measurements have been conducted every 2 months (Jan, Mar, May, Jul, Sep, and Nov) each year since 2006 by staff from XSTRFES. However, SWC data for the tropical secondary forest-3 (TSF-3) plot only covers 2017–2020; hence, we excluded SWC data from this plot for further analysis. During the study periods, the tropical secondary forest-1 (TSF-1) and tropical secondary forest-2 (TSF-2) plots showed higher SWC than other plots (Supporting Information: Figure S1). Monthly climate and SWC data were averaged for further analysis according to the yearly forest inventory survey period (census interval) rather than on an annual basis.
2.4 Demographic rates
The calculation involved stem diameter measurements at two censuses, denoted as DBHt (diameter at the second census) and DBHi (diameter at the first census). The difference was then divided by the time interval (∆t).
2.5 Net primary productivity (NPPstem)
2.6 Statistical analyses
We considered all the assumptions of GLMMs and LMMs (Zuur et al., 2010), all the variables were scaled to converge models, and the standard estimates of effects were compared. Furthermore, before constructing LMMs and GLMMs, we checked for multicollinearity of environmental variables using the R-package “car” (Fox et al., 2007). Multicollinearity was determined by evaluating the Variance Inflation Factor (VIF). All of our statistical models (LMMs and GLMMs) showed VIF values ≤ 5.0 for Tmax, Precipitation, and SWC.
3 RESULTS
3.1 Demographics rates and NPPstem
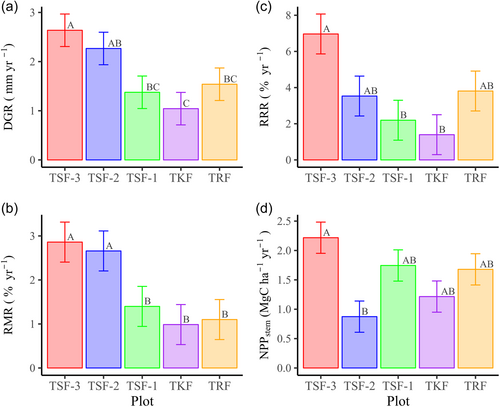
Secondary forest plots in early successional stages showed faster growth rates compared to late-successional and climax forest plots. The highest diameter growth rate (DGR, mm yr−1) was observed in TSF-3, while the lowest DGR occurred in TKF (Figure 2a). Similarly, relative mortality rates (RMR, % yr−1) were higher in early successional secondary forest plots (TSF-2 and TSF-3) than in late successional (TSF-1) and primary forests plots (TKF and TRF) (Figure 2b). TSF-3 showed the highest relative recruitment rates (RRR, % yr−1), whereas TKF exhibited the lowest RRR among the five forest plots (Figure 2c). The highest stem net primary productivity (NPPstem) was observed in TSF-3 (2.218 Mg C ha−1 yr−1), with lowest NPPstem in TSF-2 (0.874 Mg C ha−1 yr−1) (Figure 2d).
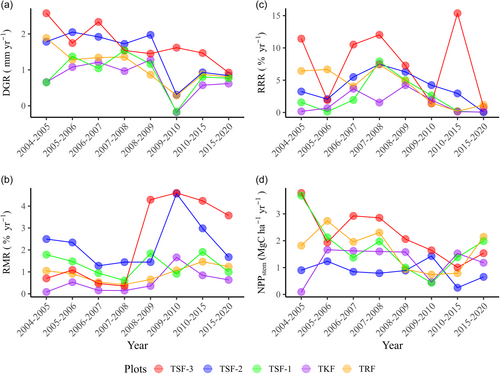
The overall temporal dynamics of NPPstem (Mg C ha−1 yr−1) and demographic rates revealed notable adverse effects of drought during 2009–2010 (Figure 3a–d). We recorded the lowest diameter growth rate, as well as lower relative recruitment rate and NPPstem for most tropical forest plots during this period (Figure 3a,c,d). Similarly, relative mortality rates in 2010 were distinctly higher for early successional secondary forest plots compared to primary forest plots (Figure 3b), indicating that early successional secondary forests are more vulnerable to extreme drought and warming climates. LMMs showed significant declining trends in diameter growth rate and relative recruitment rate across the five tropical forest plots over the past 16 years (Supporting Information: Table S6). NPPstem also showed a declining trend, although the trend was marginally significant (Supporting Information: Table S6). Conversely, we observed a marginally significant increasing trend over time for relative mortality rate (Supporting Information: Table S6).
3.2 Effects of environmental variables on forest demography and productivity
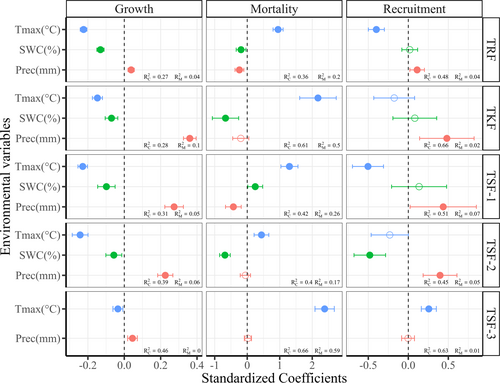
We observed a significant negative effect of maximum temperature (Tmax) and a positive effect of precipitation on DGR (mm yr−1) across all five forest plots (Figure 4 and Supporting Information: Table S1). GLMMs showed a significant positive effect of Tmax on tree mortality in all five forest plots (Figure 4 and Supporting Information: Table S2), while the negative effect of precipitation on tree mortality was only significant for the primary forest-TRF and late successional secondary forests (TSF-1; Figure 4 and Supporting Information: Table S2). Tree recruitment was mainly driven by precipitation except for the TSF 3 plot (Figure 4 and Supporting Information: Table S3). However, Tmax showed significantly a negative effect on tree recruitment in TRF and TSF-1, and a positive effect in TSF-3 (Figure 4 and Supporting Information: Table S3). Soil water content (SWC) was significantly and negatively linked to DGR (mm yr−1) in TKF, TRF, TSF-1, and TSF-2 (Figure 4 and Supporting Information: Table S1). SWC also showed a negative effect on tree mortality in TKF, TRF, and TSF-2, but a positive effect in TSF-1 (Figure 4 and Supporting Information: Table S2). Furthermore, SWC was negatively associated solely with tree recruitment in TSF-2 (Figure 4 and Supporting Information: Table S3).
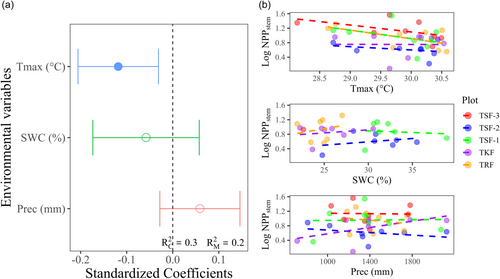
Results from the linear mixed-effects model further indicated significant negative effects of Tmax on NPPstem across all five tropical plots (Figure 5a and Supporting Information: Table S4). However, the effects of SWC and precipitation on NPPstem were not statistically significant.
4 DISCUSSION
4.1 Long-term variation in forest demographic rates and productivity
We observed that early successional secondary forest plots (TSF-2 and TSF-3) typically showed higher diameter growth rates than primary forest plots (TKF and TRF) and the late successional secondary forest plot (TSF-1) (Figure 2a). Generally, the early successional vegetation in tropical forests shows rapid growth rates due to the availability of soil nutrients and light competition (Matsuo et al., 2024). In addition, secondary forests in tropical regions experience rapid initial growth dominated by pioneer species (Supporting Information: Table S7), leading to higher short-term growth rates compared to primary forests (Van Breugel et al., 2007). However, as these forests progress through successional stages, growth rates may decrease due to factors such as increased competition and resource-use efficiency (Küppers, 1992). Similarly, early successional forest plots also had higher relative mortality rates (TSF-2 and TSF-3) (Figure 2b). The mortality rate in secondary forests generally depends on their competitive strategy, as pioneer tree species in secondary forests tend to invest more in rapid growth but are less resilient to environmental stress (Brown & Lugo, 1990; Guariguata & Ostertag, 2001). The TSF-3 plot featured the highest relative recruitment rate among the studied forest plots (Figure 2c). The higher relative recruitment rate in TSF-3 is likely related to its high relative mortality rate, as low survival is commonly associated with high recruitment (Kambach et al., 2022). Generally, tree mortality shapes forest dynamics by influencing recruitment processes (Lutz et al., 2014). Mortality reduces competition among established trees, making more resources such as light, water, and nutrients available for regeneration (Gessler et al., 2017). When trees die, they create gaps in the canopy, allowing increased sunlight penetration to the forest floor, which stimulates the growth of understory plants and new tree establishment (Pedersen & Howard, 2004). Additionally, decomposing trees release nutrients into the soil, enhancing fertility and supporting the growth of young trees (Ludovici & Kress, 2006). Furthermore, the results revealed that among the early successional forest plots, TSF-3 exhibited the highest NPPstem, whereas TSF-2, within the same successional stage, displayed the lowest NPPstem (Figure 2d). Secondary forests, undergoing regeneration after disturbances, have been recognized as significant for carbon sequestration (Heinrich et al., 2021; Kenzo et al., 2010; Medlyn et al., 2000; Taylor et al., 2014), which aligns with the highest NPPstem observed in TSF-3. TSF-2 consists of a lower proportion of bigger trees (Supporting Information: Figure S4), thus contributing to lower basal area (Table 1), which may result in lower biomass (Supporting Information: Figure S3) and lower productivity (Figure 2d).
Our study also detected a decline in diameter growth rates during the extreme drought period (2009–2010 census) across the studied forest plots, except TSF-3 (Figure 3a). In 2010, an extreme drought event occurred in Southwest China, leading to a significant reduction in vegetation growth (Li et al., 2019). The period after 2010, characterized by several extremely dry and hot years (Figures 1d–f), resulted in lower diameter growth rates compared to the pre-drought period, especially in primary and late successional secondary forest plots (Figure 3a). This suggests that early successional secondary forest plots (TSF-2 and TSF-3) can recover faster after drought than other plots. We also found that during the hot-dry year of 2010, both TSF-2 and TSF-3 showed higher relative mortality rates compared to other forest plots (Figure 3b), suggesting that trees in early successional forest types are more susceptible to drought. This susceptibility may result from the faster growth rate characteristic of TSF-2 and TSF-3, which is often associated with lower wood density trees, rendering them more vulnerable to drought conditions (Phillips et al., 2010). A uniform decline in relative recruitment rates was observed during the hot-dry period of the 2009–2010 census (Figure 3c). Similarly, NPPstem also declined during that hot-dry period across all forest plots, except TSF-2 (Figure 3d). Thus, the carbon sink of tropical forest ecosystems might be greatly impacted by climate warming and the increasing frequency of extreme drought events (Frank et al., 2015).
4.2 Environmental influences on tropical tree demography and productivity
Our investigation revealed that diameter growth rates were negatively affected by Tmax and positively influenced by precipitation, indicating that the diameter growth rates among studied forest plots were primarily moisture-limited (Figure 4). This finding is consistent with other studies highlighting the adverse impact of high temperatures and drought on tropical forest growth (Altman et al., 2017; Hájek et al., 2021; Liang et al., 2023; Walker & Johnstone, 2014; Zuidema et al., 2022), as well as the significant positive association between precipitation and tree growth (Brienen & Zuidema, 2005; Wagner et al., 2014). High temperatures pose a significant threat to plant growth primarily by inducing heat stress (Wahid et al., 2007), which can reduce growth rates by disrupting photosynthesis and elevating respiration rates (Bita & Gerats, 2013). Additionally, higher temperatures exacerbate water stress and impede nutrient uptake and metabolism (Krasensky & Jonak, 2012). We expect that the growth rate of trees in tropical forests is likely to decrease due to climate warming and frequent extreme drought. Indeed, our study showed a significant decline in the 16-year trend of diameter growth rates across our five forest plots (Supporting Information: Table S6). Therefore, assuming the continuation of current climate trends (Figure 1a–c), it is expected that the growth of tropical trees will decline in the coming years.
Furthermore, we found that Tmax is a substantial driver impacting tree mortality across all studied plots (Figure 4). Previous studies found that rising temperatures lead to increased mortality rates in moist tropical forests (Adams et al., 2009; McDowell et al., 2018). Park Williams et al. (2013) and Vlam et al. (2014) further highlighted the negative effect of temperature on tree growth and forest vigor, supporting the link between high temperatures and tree mortality. These universal relationships underscore the importance of temperature dynamics in understanding and predicting tree mortality patterns. Additionally, precipitation showed a negative effect on tree mortality in TRF and TSF-1. Consistent with the effect of precipitation, SWC also showed a significant negative effect on tree mortality in TKF, TRF, and TSF-2 (Figure 4). These results align with previous studies indicating that the probability of mortality increases substantially with decreasing soil water availability (Caspersen & Kobe, 2001). However, TSF-1 exhibited a notable positive effect of SWC on tree mortality (Figure 4). This plot also had the highest soil water content among the five forest plots (Supporting Information: Figure S1), suggesting that soil water deficit might not be a limiting factor for tree mortality in this plot. Instead, the impact of Tmax on tree mortality is more evident (Figure 4). We anticipate a substantial rise in tree mortality within these forest plots in the future, with early successional secondary forests likely to experience the greatest impact.
The results revealed that higher precipitation can enhance the likelihood of tree recruitment in all forest plots except for TSF-3 (Figure 4). These findings are consistent with previous studies that emphasize the key role of precipitation in natural regeneration processes. For instance, precipitation has been shown to enhance seed availability and establishment (Vieira & Scariot, 2006), and increase species diversity (Rito et al., 2017). Furthermore, we observed a significant negative relationship between Tmax and tree recruitment in TRF and TSF-1 forest plots (Figure 4). Consistent with our results, previous studies also found that higher temperatures were associated with decreased growth and recruitment rates in tropical trees (Rehm & Feeley, 2015; Vlam et al., 2014). An unexpected positive relationship between Tmax and tree recruitment was observed in the TSF-3 plot (Figure 4). We propose that higher recruitment in TSF-3 is associated with its higher mortality driven by high Tmax, which further increases recruitment due to more open canopy and higher light availability for understory seedlings. The results also revealed that SWC had an adverse effect on tree recruitment in TSF-2 (Figure 4). We suggest that relying solely on soil water content as an edaphic factor may not adequately to explain tree recruitment because the recruitment of tropical tree species may be more closely associated with soil nutrients rather than soil water content alone (Holste & Kobe, 2017). Generally, tree recruitment is intricately tied to competitive interactions, seed dispersal mechanisms, soil nutrients, and light availability (Davis et al., 1999; Ibáñez & McCarthy-Neumann, 2014; Kraaij & Ward, 2006).
We observed a strong inverse relationship between Tmax and NPPstem, highlighting temperature extremes as a critical issue for carbon sink capacity in the study area (Figure 5a). While Linger et al. (2020) observed a positive correlation between seasonal precipitation and NPP in tropical seasonal rainforests (TRF), our study did not detect a significant effect of precipitation on NPPstem. This discrepancy could be attributed to the fact that our analysis did not account for seasonal differentiation, potentially weakening the signal of precipitation on NPPstem. Pau et al. (2018) proved that Gross Primary Productivity (GPP) was highly sensitive to temperature, which might ultimately impact NPP through its effects on photosynthesis and respiration. Additionally, previous studies have reported temperature as a critical predictor for NPP (Churkina et al., 1999; Ouyang et al., 2014; Reich et al., 2014; Vilanova et al., 2018), which were consistent with our findings. Based on the observed climate changes within the study area (Figure 1a–c), we anticipate a reduction in the carbon sink capacity of tropical forests in the future. Early successional forests are expected to face greater risks due to higher mortality rates (Figure 2b), which will impact net primary productivity (Searle et al., 2022). Our study focused solely on NPPstem and did not account for litterfall production. The carbon allocated to wood can be sustained longer than carbon allocated to leaves or reproductive tissues, thus making NPPstem the most important component of total forest NPP (Carvalhais et al., 2014).
4.3 Implications for forest conservation and restoration
The investigation revealed that Tmax exerts a substantial negative influence on tree growth and productivity, and a positive influence on tree mortality across five forest plots, with early successional forests exhibiting the highest susceptibility due to their higher mortality rates. Furthermore, secondary forest plots generally showed high carbon sink capacity (Figure 2d) and have great potential for biodiversity conservation, climate change mitigation, and landscape restoration (Poorter et al., 2021). We anticipate that the prevalence of frequent drought events and rising temperatures in the study area will exacerbate challenges, leading to reduced tree growth, decreased recruitment, and increased mortality, ultimately impacting carbon accumulation within forest ecosystems. We advocate for effective conservation strategies that prioritize enhancing ecosystem restoration in secondary forests through measures such as promoting climate-tolerant species diversity and restoring natural hydrological regimes. These secondary forests are expanding rapidly in areas across the globe, driven by both anthropogenic activities and natural processes (Bongers et al., 2015). Leveraging the adaptive capacities of secondary forests while conserving the unique characteristics of primary forests is essential for fostering the restoration of forest landscapes amidst ongoing climate change.
5 CONCLUSIONS
Our results revealed that secondary forests overall exhibited higher diameter growth rates and relative mortality rates compared to primary forests. The hot-dry event in 2009–2010 had an adverse impact on tropical forests in the study region, which led to higher mortality, reduced growth, recruitment, and NPPstem. Specifically, early successional secondary forests experienced greater disturbance in terms of mortality. Moreover, the results demonstrated that maximum temperature had a significant negative effect on tree growth and NPPstem, and a significant positive effect on mortality. Precipitation/moisture emerged as a key factor influencing tropical tree growth and recruitment. Consequently, the impacts of climate warming are expected to reduce tree growth and recruitment, thereby diminishing carbon sink capacity, and increasing tree mortality. This study provides valuable insights into the long-term demographic and productivity dynamics of tropical primary and secondary forests at different successional stages in Southwest China.
AUTHOR CONTRIBUTIONS
Sai Tun Tun Oo: Data curation; formal analysis; methodology; software; visualization; writing—original draft. Shankar Panthi: Formal analysis; methodology; software; writing—review & editing. Ze-Xin Fan: Supervision; writing—review & editing. Xiao-Yang Song: Formal analysis; writing—review & editing. Huanyuan Zhang-Zheng: Formal analysis; methodology; writing—review & editing. Zaw Zaw: Writing—review & editing. Hua-Zheng Lu: Data curation; writing—review & editing. Hui Chen: Data curation; writing—review & editing. Yun Deng: Data curation; writing—review & editing. Rong Zhao: Data curation; writing—review & editing. Hua Lin: Writing—review & editing. Pei-Li Fu: Conceptualization; supervision; writing—review & editing.
ACKNOWLEDGMENTS
This study was funded by the National Natural Science Foundation of China (31870591 and 32150410353) and the Scientific Foundation of Yunnan Province (202301AT070307 and 202301AT070334). STTO was supported by “The Alliance of International Science Organizations (ANSO)” scholarship for Masters' study. P.-L.F. and Z-X. F. were supported by the Ten Thousand Talent Project of Yunnan Province (YNWR-QNBJ-2019-190, YNWRQNBJ-2020-095) and West Light Talent Program of the Chinese Academy of Sciences (xbzg-zdsys-202218). We thank Xishuangbanna Station for Tropical Rain Forest Ecosystem Studies for providing the climate data, soil moisture data, and the forest inventory survey data.
CONFLICT OF INTEREST STATEMENT
The authors declare no conflicts of interest.
Open Research
DATA AVAILABILITY STATEMENT
The data that support the findings of this study are available from the corresponding authors upon reasonable request.


