Identification of epigenetic modifiers essential for growth and survival of AML1/ETO-positive leukemia
Abstract
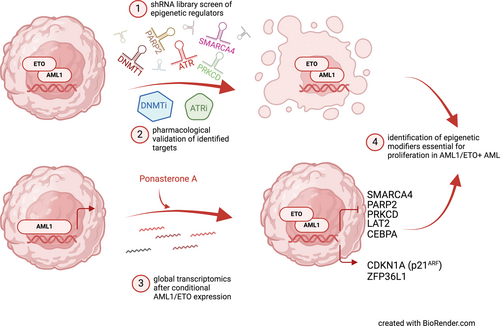
Aberrant gene expression patterns in acute myeloid leukemia (AML) with balanced chromosomal translocations are often associated with dysregulation of epigenetic modifiers. The AML1/ETO (RUNX1/MTG8) fusion protein, caused by the translocation (8;21)(q22;q22), leads to the epigenetic repression of its target genes. We aimed in this work to identify critical epigenetic modifiers, on which AML1/ETO-positive AML cells depend on for proliferation and survival using shRNA library screens and global transcriptomics approaches. Using shRNA library screens, we identified 41 commonly depleted genes in two AML1/ETO-positive cell lines Kasumi-1 and SKNO-1. We validated, genetically and pharmacologically, DNMT1 and ATR using several AML1/ETO-positive and negative cell lines. We also demonstrated in vivo differentiation of myeloblasts after treatment with the DNMT1 inhibitor decitabine in a patient with an AML1/ETO-positive AML. Bioinformatic analysis of global transcriptomics after AML1/ETO induction in 9/14/18-U937 cells identified 973 differentially expressed genes (DEGs). Three genes (PARP2, PRKCD, and SMARCA4) were both downregulated after AML1/ETO induction, and identified in shRNA screens. In conclusion, using unbiased shRNA library screens and global transcriptomics, we have identified several driver epigenetic regulators for proliferation in AML1/ETO-positive AML. DNMT1 and ATR were validated and are susceptible to pharmacological inhibition by small molecules showing promising preclinical and clinical efficacy.
Graphical Abstract
What's new?
Aberrant gene expression patterns observed in acute myeloid leukemia with balanced chromosomal translocations have been linked to effects by the leukemia-specific fusion proteins on the epigenome of malignant cells. Here, the authors explored critical and potentially druggable epigenetic modifiers in AML1/ETO-positive AML cells using shRNA library screens and global transcriptomics approaches. DNMT1 and ATR were identified and validated genetically and pharmacologically, showing promising preclinical and clinical efficacy in two AML1/ETO-positive cell lines. Several differentially expressed genes were also identified, including PARP2, PRKCD, and SMARCA4 that were both downregulated after AML1/ETO induction and identified in shRNA screens.
1 INTRODUCTION
Aberrant gene expression patterns observed in acute myeloid leukemia (AML) with balanced chromosomal translocations are increasingly linked to direct or indirect effects of the resultant leukemia-specific fusion proteins upon the epigenome of the malignant cells.1, 2 In AML, the translocation (8;21)(q22;q22), which encodes the leukemia-specific oncofusion protein AML1/ETO, epigenetically represses numerous target genes including LAT2/NTAL,3 Lysozyme,4 IL-3,5, 6 SPI1/Pu.1,7 and retinoic acid receptor (RAR) β2.8
AML1/ETO recruits a co-repressor complex through mSIN3 and NCoR including histone deacetylases (HDACs1-3), which deacetylate the lysine residues of the histone tails on its target genes.9 This leads to a closer conformation of the chromatin, repressing gene expression of AML1/ETO target genes. Some evidence suggests that AML1/ETO recruits, directly or indirectly, further epigenetic regulators such as DNA methyltransferase 1 (DNMT1)10 and the polycomb repressor complex 2 (PRC2), a histone H3K27 methyltransferase, with a catalytic domain EZH1.11 In contrast, inactivating mutations in EZH2 have been detected in core binding factor leukemias, including AML1/ETO-positive AML.12 HDAC and DNMT inhibitors restore expression of AML1/ETO target genes and inhibit cell proliferation, suggesting some specificity.3-5, 10 Whether AML1/ETO depends on other epigenetic regulators for leukemogenesis, which might also be suitable for pharmacological inhibition, is currently focus of intense research.
Here, we hypothesize that the AML1/ETO fusion protein depends on epigenetic regulators for cell proliferation and leukemogenesis. We aim to identify those critical epigenetic modifiers (using an shRNA library screen and global transcriptomics), which the AML1/ETO-positive AML cells are strongly dependent on for their proliferation and survival. Identified targets were validated genetically and pharmacologically to establish a more specific “epigenetic therapy” in AML1/ETO-positive leukemias and other AML subtypes.
2 MATERIALS AND METHODS
2.1 Human cell lines and cell culture
Human leukemia cell lines were cultured in RPMI1640 medium supplemented with 10% FBS, 100 U/mL penicillin/streptomycin, and 0.29 mg/mL l-glutamine. AML1/ETO–positive cell lines (SKNO-1; RRID:CVCL_2196; and Kasumi-1; RRID:CVCL_0589) were authenticated using fluorescence in situ hybridization (FISH). AML1/ETO–negative cell lines (HL-60; RRID:CVCL_0002; and OCI-AML3; RRID:CVCL_1844) were used. All human cell lines have been authenticated using STR profiling within the last 3 years. All AML cell lines were obtained from DSMZ, Braunschweig, Germany. All experiments were performed with mycoplasma-free cells.
Human cell lines were treated with berzosertib or VE-822 (Selleckchem, Houston, TX), ceralasertib or AZD6738 (Selleckchem), decitabine (Sigma-Aldrich, Burlington, MA), and 5-azacytidine (Sigma-Aldrich) at the indicated concentrations. Titration curves were performed using increasing drug concentrations. Cell viability was assessed by Cell TiterGlo assay (Promega, Madison, WI, USA) after 4 days.
2.2 shRNA library screen
The chemical genetic interaction screen was performed as described earlier,13 with minor modifications. Briefly, 2009 shRNA oligonucleotides targeting 671 different transcription regulator factors were synthesized on a 55 k customized oligonucleotide array (Agilent Technologies, Santa Clara, CA). PCR amplified shRNAs were pool-cloned into a retroviral vector allowing doxycycline inducible expression (TREBAV; data not shown) to generate a plasmid shRNA library. Transfection, transduction, and selection of transduced cells were described elsewhere.14 After 12 days, double-positive dsRed/GFP cells were FACS-sorted, sequenced and compared with FACS-sorted single GFP-positive cells from day 0. Z-score based analysis, as described in the reference,15 was calculated from 2 replicates.
For validation purposes, single shRNA oligonucleotides were cloned individually in the TREBAV-BpuEI recipient vector. Retrovirus generation and transduction of human cells are described elsewhere.14 Single shRNAs were validated against the genes of interest following the same protocol used for shRNA library screen. After blasticidin selection and induction with doxycycline, expression of target genes was analyzed by real-time quantitative PCR (qPCR) and Western blotting. Flow cytometry was performed every 2 days to quantify the double-positive dsRed/GFP cell population and the effects of single shRNAs.
2.3 Flow cytometry and FACS sorting
Flow cytometry was performed in LSR Fortessa (BD Biosciences, Franklin Lakes, NJ) and FACS sorting in FACS Aria (BD Biosciences) using FACS DIVA software (BD Biosciences) and FlowJo (BD Biosciences) for analysis.
2.4 Droplet digital PCR quantifying AML1/ETO
AML1/ETO was analyzed using the QX200 Droplet Digital PCR (ddPCR) system (Bio-Rad Laboratories, Munich, Germany). All samples were analyzed at least in duplicate. The dPCR reaction volume was 20 μL composed of 10 μL of ddPCR supermix for probes (Bio-Rad Laboratories, Munich, Germany), and 1 to 5 μL cDNA as template. Each reaction mixture was partitioned into approximately 20,000 droplets using a droplet generator (Bio-Rad Laboratories) and then cycled under the following conditions: 95°C for 10 min, followed by 40 cycles of 94°C for 30 s, 60°C for 1 min and one final cycle of 98°C for 10 min. Cycled droplets were read in a QX200 droplet-reader and the analysis of the dPCR data were performed using QuantaSoft analysis software (Bio-Rad Laboratories). The threshold between the positive and negative droplet clusters was manually set for each fluorochrome channel.
2.5 Western blot analysis
Western blot analysis for protein quantification was performed using a modified RIPA lysis buffer as described previously.16 Proteins transferred to nitrocellulose membranes (Amersham) were immunodetected with the following antibodies: rabbit anti-human ETO (BioNordika, cat. # RKL-100-4010 V08), rabbit anti-human GAPDH (cell signaling technology, cat. #2118), rabbit anti-human DNMT1 (cell signaling technology, cat. #5032), rabbit anti-human ATR (ProteinTech, cat. #C19787-1-AP), rabbit anti-human Vinculin (cell signaling technology, cat. #4650). Secondary antibodies rabbit anti-goat-HRP (cat. #HAF017), goat anti-rabbit-HRP (cell signaling technology, cat. #7074) coupled to HRP were used. Quantification by densitometry was performed using ImageJ software (NIH, Bethesda, MD).
2.6 FISH analysis
For FISH analysis the slides were pretreated and hybridized with fluorescence labeled DNA probes: XL t(8;21) DF, XL t(15;17) DF, XL CBFB BA, XL MECOM BA, XL MLL BA, and XL 5q31/5q33 (according to the manufacturer's protocol MetaSystems Probes, Germany). Digital images of interphase spreads embedded in Vectashield mounting medium (Vector Laboratories, Burlingame, CA) were recorded with a digital camera CoolCube 1 (MetaSystems, Germany) on an Axioplan I fluorescence microscope (Zeiss, Jena, Germany) with Plan-Apochromat 63/40 or 100_/1.30 objectives (room temperature) using the MetaSystems software Ikaros 6.3.4.
2.7 RNA sequencing analysis
The 9/10/17-LacZ and 9/14/18-AML1/ETO clones were described previously.17
Briefly, individual U937 clones were stably transduced with an ecdysone-inducible system for the expression of AML1/ETO (9/14/18-AML1/ETO) or LacZ gene (9/10/7-LacZ as control cells). The gene expression was induced by 5 uM ponasterone A (PonA) (Invitrogen). The experiment was performed in three biological replicates. However, due to batch effects in the principal component analysis, one of the experiments was excluded from further analysis. RNA from 9/10/7-LacZ and 9/14/18-AML1/ETO cells after treatment with vehicle (ethanol, EtOH) and PonA was isolated using the RNeasy Plus Micro Kit (Qiagen) according to the manufacturer's instructions. RNA was used for RNAseq analysis following library preparation using the Illumina Stranded Total RNA Prep, ligation with Ribo-Zero Plus kit. Sequencing was performed at the Max-Planck-Institute for Immunobiology und Epigenetics Freiburg using NovaSeq 600. Read quality was checked with FastQC (≥95% > Q30), alignment to the reference genome GRCh38/hg38 was performed with STAR aligner18 and read-counting was performed with featureCounts.19 The sequencing coverage and quality statistics for each sample are summarized in Suppl. Table S1.
All sample counts were then fed to DESeq220 to obtain results file for group comparisons 9/14/18 + PonA vs 9/14/18 + EtOH, 9/14/18 + PonA vs 9/10/7 + PonA, and 9/14/18 + PonA vs 9/10/7 + EtOH respectively. Adjusted p-value <.05 and Log2 fold change >0.6 criteria were used to filter differentially expressed genes (DEGs). Furthermore, a normalized count file was created using DESeq2 by using Factor levels for all 8 samples. Result files were ranked using sign[log2fold]*Log10[p-adj] as recommended by the Galaxy FGSEA tutorial before using them as input for FGSEA on MSig Hallmark pathways database. All analysis steps till here were calculated on the European Galaxy instance (https://usegalaxy.eu/).21
Results files were further sorted, filtered, and plotted (principal component analysis or PCA, Venn diagram, Heatmap, and Volcano plots) using Pandas, scikit, Matplotlib, and the Seaborn library of python. Ranked lists were also fed to GSEAPY with permutation = 1000 and ran against MSig Hallmark pathways.22 Pathways which were enriched or depleted with FDR <0.25 in any dataset were selected for further analysis and plotted.
3 RESULTS
3.1 Identification of epigenetic modifiers involved in survival and proliferation of AML1/ETO-positive leukemia cells through an shRNA library screen
To address the question which epigenetic modifiers are important for proliferation and survival in AML1/ETO leukemogenesis, a functional genomic shRNA-based screen was performed.13, 14 The AML1/ETO-bearing leukemia cell lines Kasumi-1 and SKNO-1 were transduced using retroviral vectors harboring pooled shRNA sub-libraries targeting, in total, 671 human genes (2009 shRNAs) including negative and positive controls (Figure 1A). The sub-libraries employed were selectively enriched for shRNAs that targeted epigenetic factors. Stably transduced cells were either blasticidin-selected or GFP-sorted and then treated with doxycycline for 12 days (Figure 1A). Single GFP+ cells at day 0 and double positive dsRed/GFP (cells with shRNA expression) at day 12 were sorted and the relative shRNA abundance was analyzed by deep-sequencing (Suppl. Table S2; Suppl. Figure S1A,B). The experiment was performed in duplicate.

Because we observed an increase of the inactivating histone mark H3K27me3 on the promoter and regulatory regions of the AML1/ETO-target gene LAT2 after the induced expression of AML1/ETO in the 9/14/18-U937 cells in a previous study,3 we first focused our analysis on proteins belonging to polycomb repressing complex 2 (PRC2), EZH1, and EZH2. EZH2 had a Z-score of −3.08 in the Kasumi-1 cells implying decreased proliferation of cells bearing shRNAs targeting EZH2. However, the Z-score of EZH2 in the SKNO-1 cells was 0.38, suggesting no effect or mildly increased proliferation; therefore, no further validation was undertaken. Similarly, the Z-score of EZH1 was −3.00 in Kasumi-1 cells but was −0.71 in the SKNO-1 cells (Figure 1B).
Unexpectedly, depletion of only one candidate gene (HOXA7) increased cell proliferation in both AML1/ETO-positive leukemia cell lines used for the screen (p < .05). Of note, AML1/ETO is not known to activate HOX genes.23 Interestingly, shRNA-mediated depletion of ASXL2 was found to increase the cell proliferation in SKNO-1 cells but not in Kasumi-1 cells.
In total, 41 candidate genes were found to be commonly depleted in both Kasumi-1 and SKNO-1 leukemia cells (Suppl. Figure S2, p < .001). Among these genes several proteins involved in the replication machinery, such as POLR2H, POLR2K, RPA, and POLR2B were identified, which served as positive controls for our assay and validated the shRNA library screen approach. As expected, several epigenetic regulators were identified, such as DMAP1, SMYD1, SMYD2, BRD4, SETD8, SETD1A, and HDAC8. Previous studies have shown that Kasumi-1 cells are very sensitive to BRD3/4 inhibition by JQ1, validating pharmacologically our shRNA screen findings.24 Another gene depleted in the shRNA screen and plays an important role in AML1/ETO-mediated leukemogenesis, was its interacting protein SIN3A (Suppl. Figure S2).
In agreement with a previous publication showing an interaction between DNA methyltransferase 1 (DNMT1) and AML1/ETO,5 we identified DNMT1 (Z-score −6.89 in Kasumi-1 and −5.67 in SKNO-1 cells) but not DNMT3a (Z-score −0.24 in Kasumi-1 and −0.61 in SKNO-1 cells) or DNMT3b (Z-score − 0.19 in Kasumi-1 and −0.52 in SKNO-1 cells) as markedly depleted in surviving AML1/ETO-positive cells (Figure 1C), suggesting that only the depletion of DNMT1 decreases the proliferation of leukemia cells. As DNMT1 is susceptible to pharmacological inhibition, it was subjected to further validation and characterization in AML1/ETO-positive and -negative leukemias.
3.2 Genetic depletion and pharmacological inhibition of DNMT1 decreases cell proliferation of AML1/ETO-positive leukemia cells
Competition growth assays in the SKNO-1 leukemia cells were performed to validate single shRNAs identified in the functional genomics screen.13, 14 shRNA-mediated genetic depletion of DNMT1 reduced the proliferation of AML1/ETO-positive leukemia cells in competition assays as assessed by the frequency of double dsRed/GFP-positive cells, thus validating the results of the shRNA library screen (Figure 2A–C).
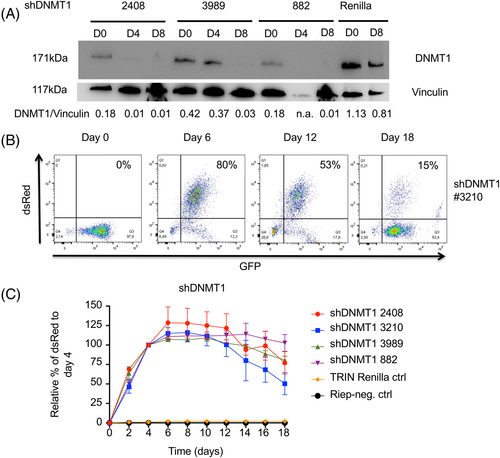
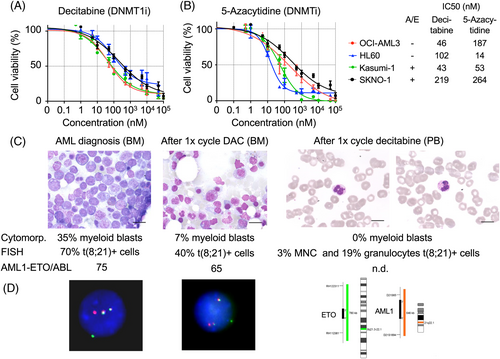
In order to validate the genetic shRNA library screen results, a pharmacologic approach was employed to test the effects of DNMT inhibitors as single agent treatment in AML1/ETO-positive and -negative leukemia cells. The cytidine nucleoside analogs decitabine (5-aza-2′-deoxycytidine) and 5-azacytidine (a pro-drug of decitabine) have been approved for the treatment of AML.25, 26 Decitabine incorporates into DNA strands upon replication, and then DNMTs such as DNMT1, are bound to it irreversibly; consequently, global and gene-specific DNA methylation are decreased. Treatment of AML cell lines with decitabine reduced cell viability with IC50 concentrations ranging between 43 nM (Kasumi-1) and 295 nM (SKNO-1) (Figure 3A). Similar results were observed with the treatment with 5-azacytidine in all AML cell lines (Figure 3B). No significant differences were observed between AML1/ETO-positive and -negative cell lines.
3.3 In vivo differentiation after treatment of a patient with AML1/ETO with the DNMT1 inhibitor decitabine
We report the response of a patient with an AML1/ETO-positive AML treated with the DNMT inhibitor decitabine in vivo at our institution. A 65-year old female patient presented with leukocytosis, thrombocytopenia, and anemia. Twenty nine percent and 35% myeloid peroxidase (POX) positive blasts were counted in peripheral blood and in bone marrow, respectively. By FISH analysis, the t(8:21) (70% of interphases) and in the karyotype an additional loss of –X in a subclone (5/20 metaphases) was detected. The t(8;21) was confirmed in the droplet digital PCR analysis (AML1/ETO/ABL ratio = 71*NCN). In the gene-mutational analysis, an additional CSF3R G714D (VAF 48%) and NRAS G12C/G12A (9%/8%) were detected. A diagnosis of treatment-related (t) AML was made, as she had been treated with radiotherapy and chemotherapy for breast cancer 5 years before.
She was included in the EORTC study AML21 (NCT02172872) and was randomized to receive decitabine followed by consolidation with an allogeneic stem cell transplantation. After the first cycle decitabine (10-day regimen), she had a partial remission with clearance of blasts in peripheral blood and 7% blasts in bone marrow. Interestingly, t(8;21) was detected in 19% of the neutrophil granulocyte-fraction and in 3% of the mononuclear cell (MNC) fraction including lymphocytes by FISH, suggesting some degree of in vivo myeloid differentiation triggered by decitabine. Cytomorphologically, neutrophils were characterized by hyposegmentation, presence of thick granula in the cytoplasma, and small nuclear extensions. The patient underwent allogeneic stem cell transplantation from a HLA-B-different related donor with a reduced-toxicity conditioning with FBM (fludarabine, carmustine, and melphalan) and anti-thymocyte globulin as in vivo T-cell depletion for graft-versus-host disease (GvHD) prophylaxis. The patient is in complete molecular remission and free from GvHD for more than 5 years now (Figure 3C,D).
3.4 Genetic depletion and pharmacological inhibition of ATR impair proliferation and survival of AML cell lines
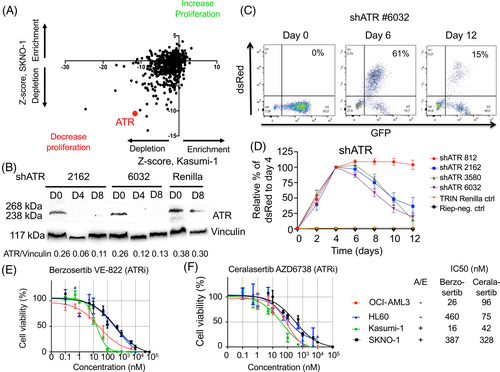
Further genes whose proteins are suitable for pharmacological inhibition were identified in the shRNA screen. One of these genes was ATR, which was markedly depleted in surviving AML1/ETO-positive cells (Z-score − 11.6 in Kasumi-1 and −10.5 in SKNO-1 cells). Validation experiments were performed using single shRNA-mediated depletion of ATR in SKNO-1 leukemia cells (Figure 4A–D). Of note, not all shRNAs for DNMT1 and ATR were equally efficient in decreasing proliferation of leukemia cells, and the dynamics and kinetics of cell proliferation and survival were different between DNMT1- and ATR-depleted AML1/ETO-positive leukemia cells, with the ATR-depletion having a more profound and rapid effect than DNMT1 depletion (Figures 2A,B and 4A–D).
Berzosertib (VE-822) and ceralasertib (AZD6738) are small molecules, which are potent inhibitors of ATR and, with lower potency, of ATM.27, 28 Berzosertib has been used in phase II clinical trials for the treatment of platinum-resistant ovarian tumors in combination with gemcitabine.29 Interestingly, ceralasertib has also been tested in phase I and II clinical trials in combination with PARP inhibitors for the treatment of platinum-resistant ovarian tumors.30
Treatment of AML cell lines with the ATR inhibitor berzosertib decreased cell viability with IC50 ranging between 16 nM (Kasumi-1) and 387 nM (SKNO-1) (Figure 4E). Similar results were observed with the ATR inhibitor ceralasertib, with IC50 values ranging between 42 nM (Kasumi-1) and 328 nM (SKNO-1) (Figure 4F). Again, no significant differences were observed between AML1/ETO-positive and -negative cell lines.
3.5 Global transcriptomic analysis after conditional induction of AML1/ETO identifies further epigenetic regulators
Because AML1/ETO is involved in the regulation of transcription factors and epigenetic regulators,1 we performed global transcriptome analysis by RNA sequencing after AML1/ETO induction in 9/14/18 cells (Suppl. Figure S3) in order to identify further AML1/ETO target genes involved in the proliferation and survival of AML1/ETO-positive cells.
To this end, we performed multiple analysis comparing 9/14/18 treated with PonA to (A) 9/14/18 treated with vehicle/ethanol, (B) the 9/10/7-LacZ clone treated with PonA and (C) the 9/10/7-LacZ clone treated with vehicle/ethanol to find possible AML1/ETO regulated differentially expressed genes (DEGs), defined as adjusted p-value<.05, log2 fold >0.6 (Figure 5A–C). To rigorously ensure that these genes were differentially expressed by AML1/ETO induction, bioinformatic analysis was performed ensuring that genes identified as DEGs were not due to PonA effects or possible leaky AML1/ETO induction. Bioinformatic analysis identified common 973 DEGs (648 up- and 325 downregulated, FDR <0.05, log2 fold >0.6) in the 9/14/18 cells after induction of AML1/ETO by PonA compared to control cells (9/10/7-LacZ clone + PonA or vehicle/ethanol and 9/14/18 treated with vehicle/ethanol) (Figure 5D,E, Suppl. Tables S3 and S4).
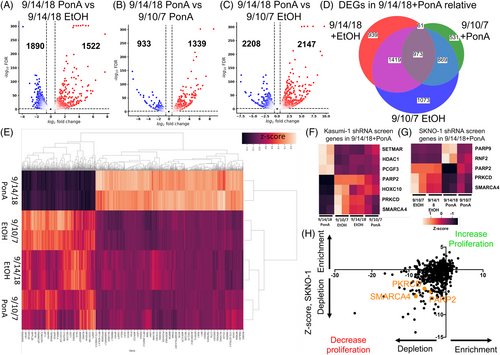
DEGs after the induction of AML1/ETO were compared to genes identified in our shRNA screens in both AML1/ETO-positive cell lines. Nine genes were identified in shRNA screens from both cell lines and in global transcriptomics analysis in AML1/ETO inducible system. Three genes (HDAC1, PCGF3, and SETMAR) from Kasumi-1, and 2 genes from SKNO-1 (PARP9 and RNF2) were upregulated upon induction of AML1/ETO. Notably, we were able to identify three genes (PARP2, PRKCD, and SMARCA4), which were both found downregulated upon AML1/ETO induction (Figure 5F,G) and in the survival screens of the two cell lines (Figure 5H).
To further streamline and validate direct targets of AML1/ETO, we compared our identified DEGs after the induction of AML1/ETO with DEGs from an already published dataset generated by the depletion of AML1/ETO by siRNAs using nanoparticles31 (GEO accession number GSE217113), in AML1/ETO-positive cell lines of Kasumi-1 and SKNO-1. Using GSEA by ranked gene list, we confirm the enrichment of upregulated (NES-1.23, p-value .02) and downregulated (NES 1.70, p-value <.001) identified DEGs in the AML1/ETO knockdown dataset (Suppl. Figure S4). Interestingly, 50 genes were commonly downregulated and 74 genes were commonly upregulated by AML1/ETO using both model systems (Suppl. Figures S5 and S6, Suppl. Tables S5 and S6). Among the downregulated genes by AML1/ETO induction and upregulated by AML1/ETO knock-down, LAT2 was identified, confirming our previous publications.3 In contrast, ETO was one of the upregulated genes by AML1/ETO induction and downregulated by AML1/ETO knock-down, validating our approach.
We also performed pathway enrichment on GSEA using MSigDB hallmark pathways after AML1/ETO induction in 9/14/18 (Suppl. Figure S7A–C, Suppl. Table S7) and after AML1/ETO siRNA mediated knock-down in Kasumi-1 and SKNO-1 cells, data set from31 (Suppl. Figure S7D). Pathways, which were enriched or depleted (defined by FDR <0.25) in any group, were plotted for analysis across comparisons. We identified 9 common regulated pathways enriched in 9/14/18 after induction of AML1/ETO by PonA and depleted in Kasumi-1 and SKNO-1 after siRNA-mediated depletion of AML1/ETO. Interestingly, the interferon gamma response pathway seems to be enriched in conditional AML1/ETO-expressing 9/14/18 cells across all the comparisons and depleted after siRNA-mediated AML1/ETO knockdown in Kasumi-1 and SKNO-1 cells. The metabolic pathways oxidative phosphorylation and hypoxia were also enriched after the induction of AML1/ETO in 9/14/18 cells and after the AML1/ETO depletion by siRNAs (Suppl. Figure S8).
4 DISCUSSION
Chromosomal translocations in AML define distinct AML subtypes with predetermined biological characteristics and molecular dependencies. The chimeric transcription factor AML1/ETO from the translocation t(8;21) recruits epigenetic regulators to its target genes,9 and epigenetically active substances can restore the expression of its target genes.3-5 Therefore, we addressed in this work, which epigenetic regulators are key regulators of cell proliferation of AML1/ETO-expressing AML cells using an unbiased shRNA library screen.
First, by a “candidate gene” approach, we observed that shRNA-mediated depletion of EZH2 affected the proliferation and survival of Kasumi-1 cells but not of SKNO-1 cells, which precluded further validation. Concordantly to our data, Kasumi-1 cells were among the cell lines showing hypersensitivity to dual EZH1/2 inhibition in a previous report.32 Previously, we have identified an H3K27me3 enrichment on the promoters of AML1/ETO-positive leukemias, rising the question whether EZH1/2 cooperates with AML1/ETO in epigenetic modification and transcriptional repression.3 Future studies, using novel sequencing technologies such as ChIP sequencing should elucidate whether H3K27me3 is enriched on AML1/ETO target promoters and whether it is correlated with EZH1/2 and AML1/ETO occupancy.
Only few shRNAs targeting epigenetic regulators were enriched in doxycycline-induced cells, which would suggest a tumor suppressor role in AML1/ETO-positive leukemias. Surprisingly, HOXA7 (acting as an oncogene in many models) was the only gene commonly enriched in both AML1/ETO positive leukemias. This would, somewhat paradoxically, imply a tumor suppressor role for HOXA7 in AML1/ETO-positive leukemias, and would need to be validated in functional assays in future studies. Interestingly, ASXL2 was one of the genes enriched in the SKNO-1 cell line. ASXL2 has been described as a tumor suppressor gene, similar to its paralog ASXL1, and is frequently and specifically mutated in AML1/ETO-positive leukemias, suggesting an interaction between ASXL2 and AML1/ETO.33 Asxl2 is also required for normal hematopoietic stem cell renewal, and loss of a single copy promotes AML1/ETO leukemogenesis in murine models.34 In contrast to the Kasumi-1 cells, which bear an endogenous ASXL1 mutation, the SKNO-1 leukemia cells are wild-type for ASXL1 and ASXL2. Hence, co-occurrence of ASXL1 and ASXL2 mutations are not described in the literature. Our data suggest a mutual exclusivity of loss-of-function (mutations) or depletion of expression (shRNA-mediated knockdown) affecting both genes, ASXL1 and ASXL2, in AML1/ETO-positive leukemias.
Several shRNAs targeting epigenetic regulators were depleted in our shRNA library screen. We focused our work on DNMT1 and ATR, which are susceptible to pharmacological inhibition, in order to develop more efficient therapies in AML in general and in AML1/ETO-positive AML in particular.
The DNA methyltransferases DNMT1, DNMT3a, and DNMT3b are involved in the methylation of cytosine nucleotides at the CpG sites of the genomic DNA. However, DNMT1 shows highest activity and affinity to hemimethylated DNA and is responsible for maintaining methylation patterns during replication. In our previous work, we showed that AML1/ETO-positive Kasumi-1 cells were more sensitive to hypomethylation activity of decitabine compared to the AML1/ETO-negative KG1a cells. Furthermore, the conditional expression of AML1/ETO in a U937 background (9/14/18 cells) enhanced the cytotoxic and anti-proliferative effects of decitabine.35 We validated, genetically and pharmacologically, DNMT1 as a very promising target in AML. Kasumi-1 cells were very sensitive to the effect of the DNMT1 inhibitors decitabine (similar to our previously published data) and 5-azacytidine. Nevertheless, the AML1/ETO-positive SKNO-1 cells showed IC50 values higher than the AML1/ETO-negative HL60 and OCI-AML3 cells, which precluded a specificity of hypomethylating agents in AML1/ETO-positive AMLs. Hence, we showed the in vivo response of a patient with an AML1/ETO-positive t-AML with a decitabine-based induction therapy prior consolidation with allogeneic stem cell transplantation, suggesting partial differentiation of myeloid blasts. This treatment result is rather unique, because core-binding factor (CBF) AML patients are routinely receiving standard induction chemotherapy but not hypomethylating agents (HMAs) as first-line treatment. Therefore, we could only identify a single relevant report on HMA treatment and CBF leukemias,36 which demonstrated the feasibility of maintenance therapy of hypomethylating agents as decitabine in those patients. Patients with AML1/ETO rearrangement (and other CBF patients) were excluded in the pivotal trial of a hypomethylating agent (5-azacytidine) plus venetoclax VIALE-A.37
ATR, identified in our shRNA library screen, plays an important role in DNA damage response. Hence, ATR has multiple roles, acting as an adaptor interacting with mediator of DNA damage checkpoint 1 (MDC1)38 and phosphorylating several other DNA binding proteins including γH2AX Ser139, leading to epigenetic gene signaling.39 In this study, AML1/ETO-positive AML cells lines with ATR depletion have a proliferative disadvantage, and ATR inhibitors are effective not only in AML1/ETO-positive but also in AML1/ETO-negative leukemia cells. Comparing the dynamics of leukemia cells expressing shRNAs for DNMT1 and ATR, it seems that the anti-proliferative effect of ATR depletion takes place earlier than in the DNMT1 depletion, which may be due to different kinetics of shRNAs (ATR protein depletion already observed at day 6 after induction) or biology of the genes (ATR acts as [epigenetic] kinase and DNMT1 through DNA methylation in a S-phase specific fashion).
Although ATR inhibitors showed some clinical efficacy as monotherapy in clinical trials of patients with hematological malignancies and solid tumors,40, 41 their clinical utility will probably be integrated in combination with chemotherapy, which induces replicative stress. ATR, as well as ATM, are both involved in detecting DNA damage as part of cell cycle checkpoints during cell division. We hypothesize that ATR inhibitors can enhance the anti-proliferative effects of hypomethylating agents, by accumulation of DNA damage induced by DNA hypomethylation and leading to mitotic catastrophe.
Integrative bioinformatic analysis of both, global transcriptomics after induction of AML1/ETO, and gene depletion in the shRNA library screen in two AML1/ETO-positive cells identified also PARP2. PARP inhibitors are currently being investigated in AML. In a phase I clinical trial, the combination of the DNMTi decitabine and the PARPi talazoparib shows an increase in PARP trapping in samples from two patients who achieved CRi.42 Hence, AML driven by repressive transcription factors, including AML1/ETO and PML-RARα fusion oncoproteins are extremely sensitive to PARPis, suggesting a potential utility of PARPi-induced synthetic lethality, not only in homologous recombination-defective cancers, but also as an effective treatment in different other cancers or leukemias.43
Mutual exclusivity analysis from the cBioPortal dataset44 showed very few mutations or structural variants in EZH2 gene and no mutations in DNMT1, DNMT3A, DNMT3B, PARP2, PRKCD, and SMARCA4 found in AML1/ETO-positive AMLs (Suppl. Figure S9). Mutations and structural variations in EZH2 and DNMT3A are frequently found in AML1/ETO-negative AML but very few mutations are found in DNMT1, DNMT3B, PARP2, PRKCD, and SMARCA4 genes in AML1/ETO negative AMLs. Faber and colleagues described an enrichment of putative loss-of-function mutations in chromatin-modifying genes including EZH2 and no mutations were found in DNMT1, DNMT3A, DNMT3B, PARP2, PRKCD, and SMARCA4 in AML1/ETO-positive leukemias compared to CBFB-MYH11-positive leukemias.12 Accordingly, we observed a transcriptional downregulation of PARP2, PKRCD and SMARCA4 by AML1/ETO induction in our RNA sequencing analysis, which might explain the mutually exclusivity of the presence AML1/ETO and lack of mutations in those genes. In contrast, EZH2 is highly expressed in AML1/ETO positive AMLs, which might explain the presence of mutations in this gene.
SMARCA4, the gene encoding the ATPase BRG1, is a member of the SWI/SNF complex, which has previously been shown to interact with RUNX1 to control transcriptional regulation during human hematopoiesis45 and in the context of CBFB-MYH11-positive46 and AML1/ETO core binding factor leukemias.47 Future studies should address whether the SWI/SNF complex, including SMARCA4, interacts with AML1/ETO and contributes to transcriptional gene regulation in human AML.
One of the identified pathways was “interferon alpha response genes,” which was found significantly enriched after AML1/ETO induction in 9/14/18 cells and depleted after siRNA-mediated knockdown of AML1/ETO in Kasumi-1 and SKNO-1. Support for interferon response association with AML1/ETO induction is present in the literature.48 We hypothesize that AML1ETO suppresses DNMT1 expression (significantly downregulated in 2/3 comparisons) resulting demethylation of repeat elements and induction of Interferon response.
We note that DNA hypomethylation induces, directly or indirectly, DNA damage and replicative stress enhancing the anti-proliferative effect of ATR inhibitors.49 Considering the efficacy of decitabine in combination with other small molecules such as the BCL2 inhibitor venetoclax in the treatment of patients with AML not suitable for an induction with standard chemotherapy,50 the combination strategies of hypomethylating agents with other targeted therapies such as ATR inhibitors, PARP inhibitors or retinoids should be further explored in AML, with the aim of identifying effective and well-tolerated triple drug combinations, seems to be very promising and should be explored and tested in AML in future studies.
In conclusion, using unbiased shRNA library screens and global transcriptomics, we have identified several driver epigenetic regulators for proliferation in AML, which are susceptible of pharmacological inhibition.
AUTHOR CONTRIBUTIONS
Jesús Duque-Afonso: Conceptualization; funding acquisition; project administration; supervision; writing – original draft; writing – review and editing. Pia Veratti: Formal analysis; investigation; methodology. Usama-Ur Rehman: Data curation; formal analysis; visualization; writing – review and editing. Heike Herzog: Investigation; methodology. Jan Mitschke: Data curation; formal analysis. Gabriele Greve: Investigation; methodology; writing – original draft. Julian Eble: Investigation. Bettina Berberich: Investigation. Johanna Thomas: Formal analysis; writing – original draft. Milena Pantic: Investigation; methodology. Miguel Waterhouse: Investigation; methodology. Gaia Gentile: Investigation; methodology. Olaf Heidenreich: Resources; supervision; writing – original draft. Cornelius Miething: Methodology; resources; supervision; writing – original draft. Michael Lübbert: Conceptualization; funding acquisition; project administration; resources; supervision; writing – original draft; writing – review and editing.
ACKNOWLEDGMENTS
We thank Tobias Schmidt, Merlin Schleer, Gregor Claus, and Tobias Ma for technical support, Prof. Dr. Justus Duyster for continuous support and all the members of the Duque and Lübbert research groups for helpful discussions. We would like to acknowledge the Lighthouse Core Facility and Marie Follo for their assistance with FACS analysis. J.D.-A. receives research support from the Research Committee of the University of Freiburg Medical Hospital (DUQ1106/16), Berta Ottenstein-Program for Advanced Clinician Scientists, Faculty of Medicine, University of Freiburg, from the German Research Foundation (DFG, DU 1287/5-1) and from ERA Per Med. JTC 2018 “GEPARD” project. ML received funding by the Jose Carreras Leukemia Foundation (Project ID R14/25), the DFG (FOR 2674, Project ID A05, A09, CRC 992 Medical Epigenetics, Project ID 192904750), and the German Cancer Consortium DKTK. Open Access funding enabled and organized by Projekt DEAL.
CONFLICT OF INTEREST STATEMENT
J.D-A. received speakers honoraria from Riemser, Lilly, Roche, AstraZeneca, Ipsen, Abbvie, Sobi, and Amgen and travel support from AstraZeneca, Gilead and Sobi. ML received research support from Janssen-Cilag. The other authors declare no conflict of interest.
ETHICS STATEMENT
The patient with AML1/ETO-positive AML was included and treated in the DECIDER clinical trial (NCT00867672) approved by the ethical committee of the University of Freiburg Medical center (ffEK Freiburg: 76/10).
Open Research
DATA AVAILABILITY STATEMENT
The data generated during and/or analyzed during the current study are available upon reasonable request from the corresponding authors. The RNA sequencing data has been deposited in Gene Expression Omnibus under the following accession number GSE235653 (http://ncbi.nlm.nih.gov/geo).


