Predicting functional variants in enhancer and promoter elements using RegulomeDB
Abstract
Here we present a computational model, Score of Unified Regulatory Features (SURF), that predicts functional variants in enhancer and promoter elements. SURF is trained on data from massively parallel reporter assays and predicts the effect of variants on reporter expression levels. It achieved the top performance in the Fifth Critical Assessment of Genome Interpretation “Regulation Saturation” challenge. We also show that features queried through RegulomeDB, which are direct annotations from functional genomics data, help improve prediction accuracy beyond transfer learning features from DNA sequence-based deep learning models. Some of the most important features include DNase footprints, especially when coupled with complementary ChIP-seq data. Furthermore, we found our model achieved good performance in predicting allele-specific transcription factor binding events. As an extension to the current scoring system in RegulomeDB, we expect our computational model to prioritize variants in regulatory regions, thus help the understanding of functional variants in noncoding regions that lead to disease.
1 INTRODUCTION
Evidence from Genome-Wide Association Studies (GWAS) has provided us with insights into human phenotypes by identifying variation statistically associated with diseases (Welter et al., 2014). However, GWAS is confounded by linkage disequilibrium when identifying the causal variants. Thus, it is desirable to extend these studies beyond association to an understanding of biological impact. Unfortunately, determining the function of these variants remains a major challenge, especially for single-nucleotide polymorphisms (SNPs) in noncoding regions of the genome, where most of these GWAS variants fall (Hindorff et al., 2009; Hnisz et al., 2013).
The advent of functional genomics assays has assisted us in mapping disease causative SNPs from GWAS. By intersecting the position of variants with regulatory elements identified from these assays, computational tools have been developed to prioritize SNPs in noncoding regions (Nishizaki & Boyle, 2017). Tools such as RegulomeDB (Boyle et al., 2012), GWAS3D (Li, Wang, Xia, Sham, & Wang, 2013), and HaploReg (Ward & Kellis, 2012) have reduced time-consuming experiments for validation. Machine learning methods have been widely applied to integrate the annotations from functional genomics assays in a more sophisticated way, and thus produce more robust and accurate predictions (Kircher et al., 2014; Lee et al., 2015). More recently, the rapid development of deep learning techniques has enabled mining in high-dimensional sequences data. Some examples include DeepSEA (Zhou & Troyanskaya, 2015), DeepBind (Alipanahi, Delong, Weirauch, & Frey, 2015), DanQ (Quang & Xie, 2016), Define (Wang, Tai, E, & Wei, 2018), and Basenji (Kelley et al., 2018). However, because data sets used for training in those algorithms vary, comparisons across different models can become a problem considering there is currently no gold-standard for evaluation (Nishizaki & Boyle, 2017).
One independent method for evaluating the performance of these tools is through the use of massively parallel reporter assays (MPRA) wherein libraries that are derived from PCR-based saturation mutagenesis have been applied to test the effect of variants in a putative regulatory region. These assays can measure the functional effect of variants on the expression level of a reporter construct in a high-throughput manner allowing for rapid testing of large numbers of variants. Kircher and collaborators performed MPRA for 17,500 single nucleotide variants (SNVs) in nine promoters and five enhancers with clinical relevance (Inoue & Ahituv, 2015; Patwardhan et al., 2009; Tewhey et al., 2016). This data set allows for an unbiased comparison of computational tools used for variant prioritization and was used in this manner for the Fifth Critical Assessment of Genome Interpretation (CAGI5) “Regulation Saturation” challenge. Participants were asked to predict the functional effects of variants in these regulatory regions as measured by the reporter expression.
We present a machine learning-based computational framework, Score of Unified Regulatory Features (SURF), which combines features from RegulomeDB and DeepSEA, to predict the effect of variants on expression in promoters and enhancers. Our model achieved the top performance in the CAGI5 “Regulation Saturation” challenge. We also demonstrate that direct features from functional genomics data improve the prediction accuracy in addition to features from DNA sequence-based deep learning models.
2 BACKGROUND
2.1 Datasets in CAGI5 regulation saturation challenge
The regulation saturation challenge assessed 17,500 SNVs in five human disease-associated enhancers (IRF4, IRF6, MYC, SORT1, ZFAND3) and nine promoters (F9, GP1BB, HBB, HBG, HNF4A, LDLR, MSMB, PKLR, TERT) in a massively parallel reporter assay (Figure 1a). The MPRA libraries were derived from saturation mutagenesis of regulatory regions up to 600 bp length, with a random change rate of 1 per 100 bases.
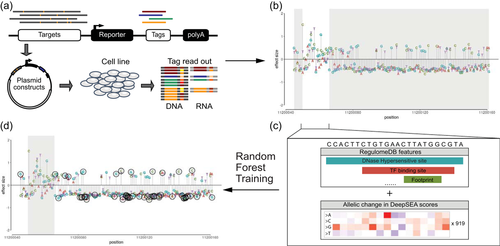
The workflow of our method. (a) The effect of variants in promoters and enhancers was tested through massively parallel reporter assays (MPRA). (b) Effect size modeled from regression for each variant was provided with 25% of data (white area) used for training and 75% of data (gray area) hidden from participants. (c) A multiclass random forest model is trained by combining features from RegulomeDB and DeepSEA on training data. (d) Prediction of variants with significant effects (circled points) is made from random forest models
Approximately, 25% of all measured SNVs were used for training (4,650 SNVs in total), and the remaining 75% of the data were held from competitors and used for testing by an independent assessor. The count of transcribed RNA and DNA of the transfected plasmid library was modeled by applying multiple linear regression (Figure 1b). The coefficients (“effect size”) and re-scaled p values (“confidence score”) from regression were provided in the training set. The SNV with confidence scores greater or equal to 0.1 (i.e. p value of 10−5) was defined as “has an expression effect”.
2.2 Tasks in CAGI5 regulation saturation challenge
For each variant in the testing set, the participants were asked to submit prediction of the effect of the variant in one of the three cases: Repressive, activating, or no effect (“Direction”), and the probability of a correct assignment of the prediction (“P_Direction”). The participants also needed to submit a prediction of the confidence score for each variant, as well as the standard error of the prediction (“SD”).
3 METHODS
For each variant in training and test data, we created features from functional genomics data obtained from RegulomeDB (Boyle et al., 2012). We also used sequence-based features from DeepSEA (Zhou & Troyanskaya, 2015). We further trained a random forest model to predict the direction of variant effects and confidence score (Figure 1).
3.1 Features
- 1.
Transcription factor (TF) binding site
: TF ChIP-seq peaks were from ENCODE data.
- 2.
Open chromatin site:
DNase-peaks were from ENCODE data.
- 3.
TF motifs:
TF motif matches were called using positional weight matrices (PWM) from RegulomeDB (Boyle et al., 2012). Positional weight matrices were from TRANSFAC (Matys et al., 2006), JASPAR CORE (Bryne et al., 2008), UniPROBE (Newburger & Bulyk, 2009) and Jolma et al (Jolma et al., 2013).
- 4.
Matched TF motif
: TF motif matches were obtained as described in feature 3, but further requiring the PWM motif matching with a TF binding peak of the same TF from ChIP-seq in the same position.
- 5.
DNase footprint:
DNase footprints were called by combining PWMs and DNase-seq data sets. We used footprint calls from Boyle et al (Boyle et al., 2011), Pique-Regi et al (Pique-Regi et al., 2011) and Piper et al (Piper et al., 2013).
- 6.
Matched DNase footprint:
DNase footprints were obtained as described in feature 5, but further requiring the PWM motif matching with a TF binding peak from ChIP-seq in the same position.
We also included additional numeric features:
- 7.
ChIP-seq signal:
We calculated the maximum TF ChIP-seq signal from feature 1 for each position in the regulatory regions.
- 8.
Maximum information content change of TF motif
: For each variant, we calculated the information content change of PWMs called in feature 3 and took the one with maximum absolute value.
- 9.
Maximum information content change of matched TF motif:
For each variant, we calculated the information content change of matched PWMs called in feature 4 and took the one with maximum absolute value.
- 10.
DeepSEA scores
We passed a vcf file of all variants through the DeepSEA model (from http://deepsea.princeton.edu/) to predict chromatin effects of each mutation on 919 functional genomics features, including chromatin accessibility, TF binding, and histone modification. We used the difference between reference and alternative alleles of those 919 functional genomics features in our model. We also included the functional significance score for each variant, which considers chromatin effects as well as evolutionary conservation.
3.2 Random forest training
- 1.
Repressive (− 1): confidence greater than or equal to 0.1 and effect size smaller than 0 (736 in total).
- 2.
Activating ( + 1): confidence greater than or equal to 0.1 and effect size greater than 0 (374 in total).
- 3.
No effect (0): confidence smaller than 0.1 (3,540 in total).
We then trained three binary classifiers for each label with a random forest model and predicted the label with the highest probability. We assigned “P_Direction” column with the prediction probability from the model. To generate a confidence prediction, we trained a random forest regression model on confidence scores and calculated the standard deviation of predictions from 500 trees in “SD” column.
3.3 Performance evaluation

 is the probability of class
  (
( ) from random forest model.
Pearson correlation with continuous predictions were reevaluated among top three methods by the assessors (Table S1).
3.4 Allele specific TF binding analysis
Allele specific TF binding sites were defined as variants that result in stronger binding of a TF to one allele at heterozygous sites in an individual. We applied AlleleDB pipeline to call allele-specific TF binding sites using ChIP-seq data downloaded from ENCODE project (Chen et al., 2016). 1,814 allele-specific binding sites were called in GM12878 cell line from 76 TFs at an FDR of 5%. To test the performance of our binary classifier trained on CAGI5 data, we also built a control set including 10,783 variants having equal ChIP-seq read counts on two alleles at heterozygous sites. For all 48,630 heterozygous sites, we calculated the allelic ratio defined by the ratio between the number of ChIP-seq reads from the allele with stronger binding affinity and a total number of reads from two alleles. For cases where multiple TFs shared a heterozygous variant, we took the maximum ratio.
4 RESULTS
4.1 SURF outperforms other groups in CAGI5 regulation saturation challenge
SURF combines features from RegulomeDB, which directly intersects variants with functional genomics annotations, and DeepSEA, which generates transfer learning features from genomics assays. For assessment, both Pearson and Spearman correlation coefficients were calculated for predicted direction and effect size from MPRA on test data. To examine how false positive rate changes with a true positive rate, the AUROC was also calculated (Table 1). Overall, we were close to group 7 on correlation coefficients, and we outperformed all groups in terms of all three categories of AUROC, especially in the case when distinguishing between variants with positive and those with negative effects on expression level. In addition, we note that it is generally easier to predict negative effects compared with positive effects, which might be because there were more examples with negative effects in training set.
| Participant (lab-submission) | Pearson correlation | Spearman correlation | Pos V Neg AUROC | Pos V Rest AUROC | Neg V RestAUROC |
|---|---|---|---|---|---|
| 3–4 (our group) | 0.301 | 0.239 | 0.842 | 0.716 | 0.835 |
| 7–3 | 0.318 | 0.249 | 0.762 | 0.706 | 0.776 |
| 5–6 | 0.255 | 0.235 | 0.714 | 0.608 | 0.691 |
| 1–2 | 0.069 | 0.046 | 0.544 | 0.553 | 0.636 |
| 6–1 | 0.103 | 0.094 | 0.537 | 0.544 | 0.584 |
| 4–2 | 0.041 | 0.033 | 0.556 | 0.528 | 0.571 |
- Abbreviation: AUROC, area under the receiver operating characteristic.
4.2 Model performance in different enhancers and promoters
We assessed our performance in each of the five enhancers and nine promoters (Figure 2). Continuous value predictions were used for calculating Pearson correlation with effect sizes. We observe no evident difference in performance between enhancers and promoters, but predictions on enhancers are more consistent in terms of AUROC performance. Also, our model performance has no strong association with cell types. The four regions in HEK293T (HNF4A, MSMB, TERT, and MYC) have a wide range of performance. Overall, we predicted most accurately in regions of MYC (HEK293T), PKLR (K562) and HBB (HEL_92.1.7). Interestingly, the cell line HEL_92.1.7 has no corresponding functional genomics data from the ENCODE project. In addition, ZFAND3 data is from mouse pancreatic beta cell lines (MIN6). These imply our model is able to predict these effects from the available data in other cell types.
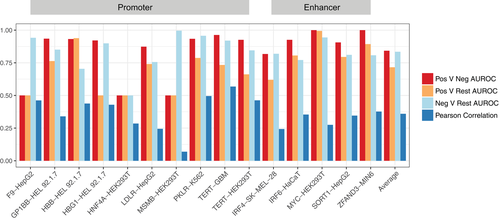
Performance across regions. Cell type names are appended at the end of promoter and enhancer regions. The average performance across all regions is also shown. AUROC, area under the receiver operating characteristic
4.3 Features from RegulomeDB provide complementary information to DeepSEA scores
We next analyzed the predictive importance of RegulomeDB features. We calculated the Pearson correlation of features and an absolute value of effect sizes in test data (Figure 3a). All features have a positive correlation, which is consistent with the fact that the variants in functional regulatory elements have a higher chance of affecting the expression level downstream. Among all binary features from RegulomeDB, features such as matched TF motif and matched DNase footprint have the highest correlation coefficients, which indicates that integrating sequence information with evidence from functional genomics data directly into one feature assists prediction accuracy. We further examined two of the most predictive features in the region of MYC enhancer, where we achieved the best AUROC compared with other enhancers and promoters. As shown in Figure 3b, these two features from RegulomeDB, DNase footprint, and matched DNase footprint, are largely in agreement with the position of variants leading to a significant change of the gene expression beyond DeepSEA scores.
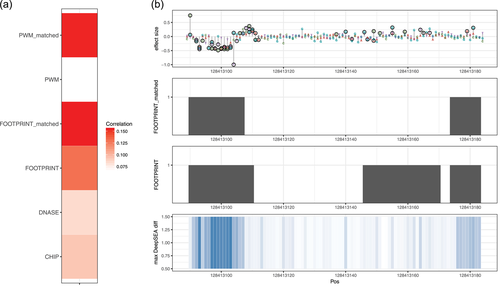
Features from RegulomeDB facilitate prediction. (a) Pearson correlation of features from RegulomeDB and an absolute value of effect sizes from MPRA in test data. (b) A region of the MYC enhancer in HEK293T cell line showing measured MPRA data with SNVs having significant effect circled. Two binary features from RegulomeDB (DNase footprint and DNase footprint with matched TF ChIP-seq peak) show agreement with the position of these variants. DeepSEA scores also identify some of the functional variants in this enhancer. MPRA, massively parallel reporter assays; SNVs, single nucleotide variants
4.4 Predicting allele specific TF binding events
To test the generality of our model, we next evaluated how SURF performs on predicting allele-specific TF binding events identified from ChIP-seq data. We collected 1,848 variants associated with allele-specific binding in GM12878 cell line, and then generated prediction scores using the binary classifier we trained from variants with no effects versus the rest of the variants in CAGI5 training set. Overall, our model is able to predict allele-specific binding events with fairly good performance (AUROC = 0.6218; AUPRC = 0.2298). We further relaxed our thresholds to examine the performance on a wider spectrum of allelic ratio, which is defined by the ratio between the number of ChIP-seq reads from the allele with stronger binding affinity and a total number of reads from two alleles. We found a significant difference in prediction scores for heterozygous sites showing balanced (allelic ratio smaller than 0.6) and imbalanced (allelic ratio equal or larger than 0.9) TF binding affinity (Figure 4; p value = 9.735e-311 from a t test).
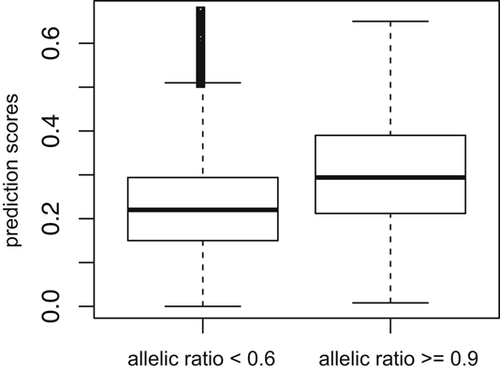
Boxplot of prediction scores for heterozygous sites showing balanced and imbalanced TF binding affinity from two alleles. Allelic ratio is calculated by the number of ChIP-seq reads from the allele with stronger binding affinity divided by the total number of reads from two alleles
5 DISCUSSION
Understanding the function of variants in noncoding regions remains a major challenge to interpret results from GWAS studies. The CAGI5 Regulation Saturation challenge has provided a valuable data set for developing prediction models on regulatory variants leading to significant effects on expression level. Here, we described our model, SURF, on the basis of our existing resource RegulomeDB, that achieves the top performance in this challenge (Table 1). However, one limitation of the evaluation with AUROC is that the imbalance rate was different across groups, which makes it hard to compare. A more accurate comparison is the correlation between continuous prediction scores and effect sizes from MPRA, which is shown in Table S1 but only available from three groups.
We found that the direct annotations from functional genomics data queried through RegulomeDB enable the improvement of prediction beyond the transfer learning features from the DeepSEA model. One possible reason to explain the improvement is that the chromatin features from underrepresented cell types in deep learning model are compensated by direct annotations from RegulomeDB. Thus, continued working on RegulomeDB resource, including updates and expansion of the available data from ENCODE project, will enable us to develop prediction models with better accuracy. For example, 3D chromatin interaction data illustrating loops between enhancers and promoters can be used to assign target genes of variants in regulatory elements. In addition, ATAC-seq as an alternative method for studying chromatin accessibility will potentially give us complementary information to DNase-seq.
Furthermore, instead of obtaining general features through all available cell types in RegulomeDB, as we did in this challenge, it is possible to query features in a cell type-specific way to improve performance. Although a previous study suggests that limiting features to be cell type-specific does not increase prediction accuracy for MPRA data (Kreimer, Yan, Ahituv, & Yosef, 2017), it is worth exploring further whether this is because of the limitation of MPRA to capture cell type-specific activity. Another strategy is to integrate cell type-specific features with a generic model trained with all available cell types, thus taking advantage of a sufficient set of training data as well as retention of cell type-specific information.
The initial premise behind the development and scoring in the RegulomeDB tool was that functional genomics data is key to understanding and prioritizing variants that may be disrupting transcription factor binding and thus having a direct effect on the gene expression. We have shown that these data have aided our model to perform well on MPRA training data and improve the ability to predict allele-specific TF binding events. Multiple studies have successfully applied RegulomeDB to infer regulatory variants in cancer genomes (Melton, Reuter, Spacek, & Snyder, 2015; Sharma, Jiang, & De, 2018), and continued work is needed with the increasing availability of cancer whole genome data. Encouraged by these results, we are currently developing a newer version of RegulomeDB, which will provide all the features we used in this challenge, including the allelic scores, such as information content change of TF motifs. We will also make our prediction scores available to general users, thus to help research on prioritizing noncoding variants in various contexts.
ACKNOWLEDGMENTS
SD and APB were supported by NIH U41 HG009293. The CAGI experiment coordination is supported by NIH U41 HG007346 and the CAGI conference by NIH R13 HG006650. We thank the organizers of the Fifth Critical Assessment of Genome Interpretation for hosting the challenge. We also thank Adam Diehl, Sierra Nishizaki, Ningxin Ouyang and Samuel Zhao for constructive feedback.


