Using secondary structure to predict the effects of genetic variants on alternative splicing
For the CAGI5 Special Issue.
Abstract
Accurate interpretation of genomic variants that alter RNA splicing is critical to precision medicine. We present a computational framework, Prediction of variant Effect on Percent Spliced In (PEPSI), that predicts the splicing impact of coding and noncoding variants for the Fifth Critical Assessment of Genome Interpretation (CAGI5) “Vex-seq” challenge. PEPSI is a random forest regression model trained on multiple layers of features associated with sequence conservation and regulatory sequence elements. Compared to other splicing defect prediction tools from the literature, our framework integrates secondary structure information in predicting variants that disrupt splicing regulatory elements (SREs). We applied our model to classify splice-disrupting variants among 2,094 single-nucleotide polymorphisms from the Exome Aggregation Consortium using model-predicted changes in percent spliced in (ΔPSI) associated with tested variants. Benchmarking our model against widely used state-of-the-art tools, we demonstrate that PEPSI achieves comparable performance in terms of sensitivity and precision. Moreover, we also show that using secondary structure context can help resolve several cases where changes in the counts of SREs do not correspond with the directionality of ΔPSI measured for tested variants.
1 INTRODUCTION
Alternative splicing is a major regulatory mechanism that accounts for the macromolecular and cellular complexity observed in eukaryotic organisms (Nilsen & Graveley, 2010). During alternative splicing, the exons of primary transcripts are spliced together in different arrangements by the spliceosome, yielding a structurally and functionally diverse population of messenger RNAs (mRNAs) and proteins. The activity of the spliceosome is primarily regulated through interactions with cis-acting RNA sequence elements, including the donor splice site, acceptor splice site, and branch point site. There are also additional regulatory sequences known as splicing regulatory elements (SREs) that influence choice of adjacent splice sites. By convention, SREs are organized by localization and effect on splicing as exonic splicing enhancers (ESEs), exonic splicing silencers (ESSs), intronic splicing enhancers, and intronic splicing silencers. Intriguingly, studies have demonstrated that molecular recognition of SREs is influenced by RNA secondary structure and chromatin states, which mediate sequence accessibility (Fu & Ares, 2014).
Given the complex regulation of alternative splicing, it is unsurprising that genetic variants that impact pre-mRNA splicing efficiency are implicated in many diseases. In fact, it has been suggested that approximately one-third of all disease-causing mutations alter pre-mRNA splicing (Lim, Ferraris, Filloux, Raphael, & Fairbrother, 2011). Therefore, developing methods that can accurately identify genomic variants that alter splicing is critical to advancing personalized medicine.
A splicing reporter mini-gene assay is an experimental strategy to systematically evaluate the effects of genetic variants on splicing of a certain exon. Recently, a high-throughput reporter system called Vex-seq was developed to determine the splicing impact of exonic and intronic variants for the same exon simultaneously (Adamson, Zhan, & Graveley, 2018). Vex-seq compares the percent spliced-in (PSI or  )—a metric representing the fraction of transcripts harboring a given exon—between constructs containing a reference sequence and constructs containing a particular variant. The change in PSI (
 ) is then calculated for each tested variant. While such assays are straightforward and reliable for detecting splicing defects, there are technical limitations that prohibit its use in routine clinical practice. Moreover, such assays do not fully represent true in vivo splicing given they only represent one or several exons and lack the context of the entire gene.
Over the past several years, a number of in silico prediction tools for detecting mutations that alter splicing have been developed. One class of tools, including MutPredSplice (Mort et al., 2014) and Human Splicing Finder (Desmet et al., 2009), integrate multiple layers of regulatory sequence features to output a score representing the probability that a given variant disrupts splicing. However, the outputs of these tools fail to capture the resulting physical effects of variants on splicing, such as the extent to which a variant increases or decreases the frequency of alternative exon inclusion.
Alternatively, there are other computational models, including HAL (Rosenberg, Patwardhan, Shendure, & Seelig, 2015) and SPANR (Xiong et al., 2014), that directly predict the effects of genetic variants on the relative amounts of alternatively spliced isoforms. However, these tools are often limited in terms of the types of variants that they can evaluate. For example, SPANR is limited to analyzing single nucleotide changes, whereas HAL is limited to variants within the alternative exon. Additionally, while these tools do claim predictive power, their predictions are still far from reliable enough for clinical translation.
A common approach used by many tools for predicting the impact of mutations on splicing is to analyze a given sequence for hexamers that may putatively function as SREs. However, it is possible that for a given sequence context, an identified SRE may not be active because it is occluded by secondary structure. This derives from a long-standing view that sequence-specific RNA binding proteins have limited accessibility to the bases within the major groove of double-stranded RNA, which is narrower than that of double-stranded DNA (Mattaj & Nagai, 1994). It has been experimentally shown that several major splicing factors, such as SR proteins and hnRNP proteins, exhibit reduced binding efficiency to sequence motifs that form secondary structures (Buratti et al., 2004; Damgaard, Tange, & Kjems, 2002). Under this framework, we hypothesized that methods that solely count the number of SREs lost/gained as a result of a mutation may yield several false positives and false negatives when predicting splice-altering variants.
To investigate this idea, we developed a computational framework for predicting the splicing impact of coding and noncoding variants as part of the Fifth Critical Assessment of Genome Interpretation (CAGI5) “Vex-seq” challenge. We trained a random forest regression model, Prediction of variant Effect on Percent Spliced In (PEPSI) using multiple layers of features associated with sequence conservation and regulatory sequence elements. In particular, for features related to SREs, we leverage RNA secondary structure information to characterize the impact of variants that disrupt putatively identified SREs. Compared to state-of-the-art splicing prediction tools, PEPSI achieves comparable sensitivity and precision in classifying splice-disrupting variants based on predicted  of genomic variants. Moreover, we demonstrate that RNA secondary structure information can help resolve several cases where changes in the counts of SREs do not correspond with the directionality of
  measured for tested variants.
2 MATERIALS AND METHODS
2.1 Training and test datasets
The results of the Vex-seq experiment were provided as training and test sets in the CAGI5 “Vex-seq” challenge to evaluate computational approaches for predicting the impact of genetic variants on splicing.
The Vex-seq experiment measured the  of 2,055 variants from the Exome Aggregation Consortium (ExAC; Kircher et al., 2014) using a library of reporter constructs transfected into HepG2 cells (Adamson et al., 2018). Variants on chromosomes 1–8 were assigned to the training set, and variants on chromosomes 9–22 and chromosome X were assigned to the test set. There were 957 variants within or adjacent to 52 exons in the training set, including 488 exonic single-nucleotide variants (SNVs), 14 exonic insertions/deletions (indels), 425 intronic SNVs, and 30 intronic indels. In contrast, there were 1,098 variants within or adjacent to 58 exons in the test set, of which there were 563 exonic SNVs, nine exonic indels, 495 intronic SNVs, and 31 intronic indels (Figure 1a).
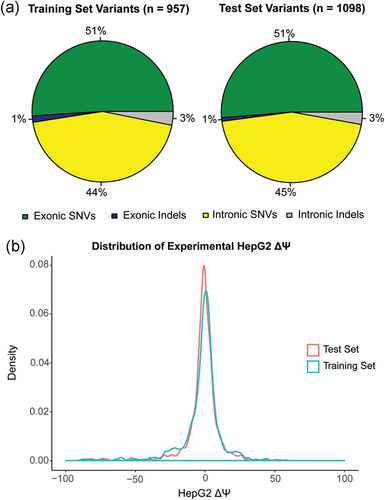
Training and test data sets. (a) Pie chart showing the distribution of exonic SNVs, intronic SNVs, exonic indels, and intronic indels in the Vex-seq training and test sets. (b) Density plot showing the distribution of ΔΨ for variants in the Vex-seq training set and for variants in the Vex-seq test set. SNV, single-nucleotide variant
The median  among the variants in the training set was
  whereas the median
  among the variants in the test set was
  . Given that these values are reasonably close to 0%, we concluded that variants in the both the training set and test set were equally likely to increase or decrease the frequency of alternative exon inclusion. In both the training set and test set, the distribution of
  among the variants revealed that more than 50% of the variants had a measured
  (Figure 1b). Based on this threshold (Xiong et al., 2014), a large proportion of the variants from ExAC did not appear to disrupt splicing in HepG2 cells.
2.2 Features
We assembled 20 features characterizing each variant (Table 1), including distance to the nearest splice site, exon length, seven sequence-based features, and 11 conservation scores derived from annotations used in version 1.3 of CADD (Kircher et al., 2014). We chose to incorporate conservation features in our model given that previous studies have demonstrated how functional sequence elements associated with alternative splicing are phylogenetically and spatially conserved (Minovitsky, Gee, Schokrpur, Dubchak, & Conboy, 2005).
| Name | Description | Type | Source |
|---|---|---|---|
| GC | Percent GC in a window of ±75 bp | num | CADD v1.3 |
| priPhCons | Primate PhastCons conservation score (excl. human) | num | CADD v1.3 |
| mamPhCons | Mammalian PhastCons conservation score (excl. human) | num | CADD v1.3 |
| verPhCons | Vertebrate PhastCons conservation score (excl. human) | num | CADD v1.3 |
| priPhyloP | Primate PhyloP score (excl. human) | num | CADD v1.3 |
| mamPhyloP | Mammalian PhyloP score (excl. human) | num | CADD v1.3 |
| verPhyloP | Vertebrate PhyloP score (excl. human) | num | CADD v1.3 |
| GerpN | Neutral evolution score defined by GERP++ | num | CADD v1.3 |
| GerpS | Rejected Substitution score defined by GERP++ | num | CADD v1.3 |
| bStatistic | Background selection score | int | CADD v1.3 |
| mutIndex | Genome-wide mutability index | int | CADD v1.3 |
| fitCons | fitCons score | num | CADD v1.3 |
| nearest_ss_dist | Distance to nearest splice site | int | |
| exon_length | Length of exon | int | |
| exon | Variant is located within an exon | bool | |
| MaxEntScan_5ss | Difference in MaxEntScan::score5ss scores between mutated and reference sequences | num | MaxEntScan |
| MaxEntScan_3ss | Difference in MaxEntScan::score3ss scores between mutated and reference sequences | num | MaxEntScan |
| SVM_BP | Difference in SVM-BP branch point scores between mutated and reference sequences | num | SVM-BP |
| ESEseq | Weighted loss/gain of ESE sequence motifs | num | Ke et al. (2011) |
| ESSseq | Weighted loss/gain of ESS sequence motifs | num | Ke et al. (2011) |
- Abbreviations: ESE, exonic splicing enhancer; ESS, exonic splicing silencer; PEPSI, Prediction of variant Effect on Percent Spliced In; SVM, single-nucleotide variant.
To measure the impact of variants on splice site strength, we reported the difference in MaxEntScan (Yeo & Burge, 2004) scores between the mutated and reference sequences (MaxEntScan_5ss and MaxEntScan_3ss from Table 1). Specifically, we ran MaxEntScan::score5ss for variants that were either within 3 base pairs (bp) upstream or within 6 bp downstream of the splice donor site. We ran MaxEntScan::score3ss for variants that were either within 20 bp upstream or within 3 bp downstream of the splice acceptor site. Variants that were not within the specified window for either MaxEntScan tool were assigned a score difference of 0.
To assess the impact of variants on branch point sequence recognition, we reported the difference in SVM-BPfinder (Corvelo, Hallegger, Smith, & Eyras, 2010) scores between the mutated and reference sequences (SVM_BP from Table 1) for variants upstream of the splice acceptor site. For each oligo sequence used to assemble a Vex-seq splicing reporter, we ran SVM-BPfinder on the subsequence upstream of the 3′-splice site to identify candidate branch point sequences. We used the score associated with the “best” branch point sequence when calculating the score difference between mutated and reference sequences. Variants that were not upstream of the splice acceptor site were assigned a score difference of 0.
To measure the impact of variants on SRE recognition, we considered datasets of ESE hexamers (ESEseq from Table 1) and ESSs hexamers (ESSseq from Table 1) that were identified using a 3-exon minigene splicing assay (Ke et al., 2011). For each test exon associated with a given variant, we considered a sequence window from 40 bp upstream of the 3′-splice site to 40 bp downstream of the 5′-splice site. A score representing the weighted loss/gain of sequence motifs was calculated for each data set of SREs as follows:
 be the reference sequence window, and let
  be the mutated sequence window. For a list of SREs,
  , let
, let  be the subset of SREs in
  that are present in the exonic region of
  , and let
  be the subset of SREs in
  that are present in exonic region of
  . The weighted loss/gain of sequence motifs from L for this variant is given by:
 (1)
(1) for
for  is a weighted count of sequences motifs from L present in
  , defined as
 (2)
(2) to be the probability that motif m from
  is unpaired within the sequence context of
  .
.  is calculated using RNAplfold (Lorenz et al., 2011), which estimates the probability that a region is unpaired by calculating local-pair probabilities for bases with a maximum span of L nucleotides via a sliding window of size W nucleotides along the input sequence
  . The parameters W and L were set to 80 and 40, respectively, having been previously optimized for small interfering RNA binding predictions (Tafer et al., 2008).
 (3)
(3) and
and  are the reference and mutated sequence windows, respectively,
  is a list of SREs, and
  is a subset of SREs in
  that are present in the exonic region of sequence
  for
for  . We separately trained a control model, PEPSI-noSS, using scores for unweighted loss/gain of SREs.
2.3 Computational framework
 for each variant. We observed that interpreting the impact of a variant with a given
  will depend on the reference
  of the alternative exon. Two variants with the same
  value affecting two different exons will have different consequences if one exon is weakly spliced in (low reference
  ) and the other exon is frequently spliced in (high reference
  ). Given that model features should directly reflect consequences to splicing, we chose to predict on
  values to numerically distinguish such cases in which two exons with very different reference
  are each affected by a variant with the same measured
  . For a given reference
  and
and  associated with a particular variant, we calculate the
  as follows:
 (4)
(4)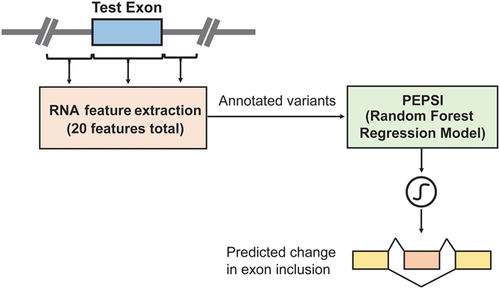
Computational framework. The computational framework first annotates variants using a total of 20 features related to sequence conservation and regulatory sequence elements. A random forest regression model predicts the Δlogit(Ψ) for each annotated variant, and a separate module converts Δlogit(Ψ) to predicted ΔΨ. PEPSI, Prediction of variant Effect on Percent Spliced In
 and
and  to
to  to avoid getting infinitely large/small values upon taking the logit transformation. Predicted
  values for variants in the test set were converted back to
  values as follows:
 (5)
(5)Our random forest regression model used a total of 2,000 trees and randomly sampled seven variables as candidates at each split. The importance of each feature during training was calculated as the total decrease in node impurity over all splits involving that feature within each tree, averaged across all trees in the forest as implemented in the randomForest package in R (Breiman, 2001).
2.4 Benchmarking against state-of-the-art splicing defect prediction tools
We benchmarked our method against commonly used state-of-the-art models for predicting the impact of variants on splicing, including HAL (Rosenberg et al., 2015), SPANR (Xiong et al., 2014), and MutPredSplice (Mort et al., 2014). HAL is a linear model trained on over two million random sequences to predict the splicing impact of exonic variants in terms of  . SPANR is another method that predicts the
  of exonic and intronic SNVs using a Bayesian deep learning algorithm trained on exon skipping events with 1,393 genomic feature annotations. On the other hand, MutPredSplice is a random forest model trained on various sequence-based and conservation-related features that reports the probability that a given variant is splice-altering.
To carry out this benchmark analysis, we used splicing functional assay data from the Multiplexed Functional Assay of Splicing using Sort-seq (MFASS) experiment (Cheung et al., 2019). The MFASS experiment assayed a total of 27,733 ExAC SNPs within or adjacent to 2,339 exons. Similar to the Vex-seq experiment, MFASS uses a set of three-exon, two-intron reporters in which skipping of the middle exon leads to reconstitution of fluorescence. Fluorescence-activated cell sorting was used to separate the pooled library of splicing reporters into separate bins based on observed fluorescence representing different splicing behavior. An exon inclusion index (EI) was then calculated for each tested sequence based on a weighted average of normalized read counts multiplied by the average exon inclusion level across all bins. The change in inclusion index  for a particular library sequence between the reference and mutant was determined for each assayed variant.
Splice-disrupting variants (SDVs) were defined in the MFASS experiment as variants that change the inclusion index of a tested exon by at least 0.5. Based on this threshold, the MFASS experiment determined a total of 1,050 SDVs out of all 27,733 scored variants. We constructed a separate test set consisting of 2,094 ExAC SNPs measured in the MFASS experiment, consisting of 1,047 SNVs classified as splice-disrupting and 1,047 SNVs not considered as splice-disrupting.
We trained PEPSI and PEPSI-noSS on all 2,055 variants from the Vex-seq experiment and predicted the  of SNVs in the test set that we constructed from the results of the MFASS experiment. Given that the Vex-seq experiment and the MFASS experiment both assayed variants from ExAC, we made sure that our curated test set from the MFASS experiment did not include any variants from the Vex-seq experiment. We then classified variants as splice-disrupting if the predicted
  (Xiong et al., 2014).
SPANR predictions for MFASS test set variants were determined using pre-computed annotation scores for SPANR (SPIDEX) that were downloaded from http://www.openbioinformatics.org/annovar/spidex_download_form.php. We used the HAL webserver (http://splicing.cs.washington.edu/SE) and MutPredSplice webserver (http://www.mutdb.org/mutpredsplice/submit.htm) to obtain respective tool predictions for the variants in the MFASS test set. We proceeded to classify variants as splice-disrupting based on scores produced by each tool as follows. For tools that characterize the splicing impact of variants using  , such as SPANR and HAL, we applied the same threshold of
  to classify variants as splice-disrupting. For MutPredSplice, we used the default tool threshold for general scores, in which variants with general scores
  were considered as splice-disrupting.
3 RESULTS AND DISCUSSION
3.1 Incorporating secondary structure into predicting variants that disrupt SREs
We first trained PEPSI and PEPSI-noSS on the Vex-seq training set and predicted the splicing impact of variants from the Vex-seq test set. For PEPSI, we observed a Pearson correlation of  between predicted
  and experimentally measured
  (Figure 3a). Interestingly, for our control model PEPSI-noSS, we observed a slightly better Pearson correlation of
  between predicted
  and experimentally measured
  (Figure 3b). For both PEPSI and PEPSI-noSS, MaxEntScan scores and distance to nearest splice site were considered to be the most predictive features during model training. Interestingly, we also observed that our SRE features, ESEseq and ESSseq, were ranked with greater importance during model training for PEPSI than during model training for PEPSI-noSS (Tables S1 and S2).
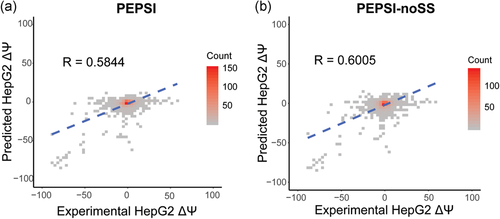
Performance on Vex-seq test set. (a) Measured ΔΨ (x-axis) vs. ΔΨ values predicted by PEPSI (y-axis) for variants in Vex-seq test set. (b) Measured ΔΨ (x-axis) vs. ΔΨ values predicted by PEPSI-noSS for variants in Vex-seq test set. PEPSI, Prediction of variant Effect on Percent Spliced In
To analyze how the incorporation of secondary structure influences the prediction accuracy of SREs, such as ESEs and ESSs, we compared the distribution of  for variants which gain more ESEs than ESSs (ESEseq
 ESSseq) and for variants that gain more ESSs than ESEs (ESEseq
 ESSseq). In particular, we focused on 1,002 exonic variants that were more than two nucleotides away from the nearest splice site to avoid cases where the measured
  could be attributed to disruption of splice sites or branch point sequences instead of ESEs/ESSs. For PEPSI, where SRE count changes were weighed by probability of secondary structure formation, we observe that ESEseq
 ESSseq variants have a significantly more positive
  distribution compared to ESEseq
 ESSseq variants,
  (the Wilcoxon Rank-Sum Test; Figure 4a).
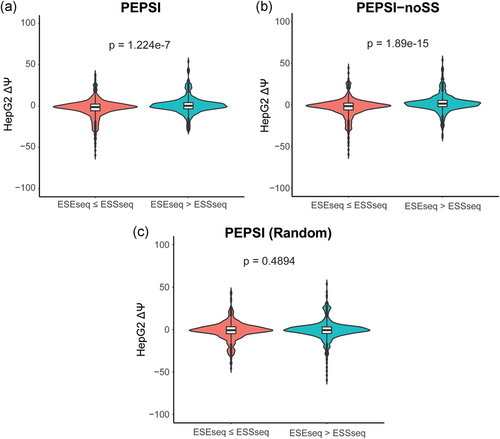
Relationship Between ESEseq scores, ESSseq scores, and HepG2 ΔΨ. (a) Distribution of HepG2 ΔΨ of variants with a greater ESEseq score than ESSseq score and that of variants with a smaller ESEseq score than ESSseq score, as measured in the PEPSI framework. (b) Distribution of HepG2 ΔΨ of variants with a greater ESEseq score than ESSseq score and that of variants with a smaller ESEseq score than ESSseq score, as measured in the PEPSI-noSS framework. (c) Distribution of HepG2 ΔΨ of variants with a greater ESEseq score than ESSseq score and that of variants with a smaller ESEseq score than ESSseq score, measured in a modified framework of PEPSI where the probabilities of single-strandedness used to weight motif count changes were randomly generated based on a shuffling of the original sequence window. ESE, exonic splicing enhancer; ESS, exonic splicing silencer; PEPSI, Prediction of variant Effect on Percent Spliced In
For PEPSI-noSS, where SRE count changes were unweighted, we also observed a significantly more positive  distribution among ESEseq
 ESSseq variants compared to ESEseq
 ESSseq variants,
  (the Wilcoxon Rank-Sum Test; Figure 4b). To determine if the probabilities used in weighing SRE count changes were introducing random noise, we recalculated SRE count changes using probabilities of secondary structure formation derived from a randomly shuffled version of the original sequence window. Using these recalculated scores, we did not observe any statistically significant difference in the
  distribution between ESEseq
 ESSseq variants and ESEseq
 ESSseq variants,
  (the Wilcoxon Rank-Sum Test; Figure 4c). This suggests that the original probabilities used in adjusting SRE count changes in PEPSI did not necessarily introduce random noise to the model.
Interestingly, for PEPSI-noSS, we observed multiple variants in which count changes in SREs did not correspond with the directionality of the measured  . Out of the 1,002 exonic variants, 160 ESEseq
 ESSseq variants had a negative
  and 219 ESEseq
 ESSseq variants had a positive
  . Integrating secondary structure information into calculating SRE count changes for these 379 variants yielded 113 cases in which weighted count changes of SREs corresponded with the directionality of measured
  (Table S3).
Some of these resolved cases yield interesting insights into the role of secondary structure in SRE recognition. For example, the variant rs771094081:A>C, which had a measured  , was associated with the loss of 2 putative ESS motifs AGGAGG and AGGTGG. However, based on variant annotations by PEPSI, the weighted count change in ESS motifs indicates a net increase in the number of ESS motifs free of secondary structure. We hypothesized that the two putative ESS motifs that were lost as a result of the mutation were occluded by secondary structure in the original sequence context, thus rendering them inactive. As a result, the loss of these two motifs should not directly correspond to a positive
  . Instead, it is possible that the point mutation alters the landscape of secondary structures such that a pre-existing ESS motif sequestered by secondary structure in the original sequence context is more accessible for binding in the mutated sequence context. This could potentially explain the negative
  that was measured for this particular variant.
To validate our hypothesis, we considered the original and mutated 95 bp sequences for the exon harboring the mutationNC_000001.11:g.24339710A>C. RNA secondary structures for both the original and mutated sequences were predicted using the Mfold web server (Zuker, 2003). Folding was simulated at a temperature of 37°C and ionic conditions of 1M NaCl. If the Mfold web server produced multiple secondary structures, the structure with the highest negative free energy was chosen to be the representative structure. Comparing the secondary structures for the reference and mutant sequences (Figure 5a,b), we discovered an ESS motif TTGAGG present in both sequences that was more likely to be single-stranded in the mutant sequence compared to the reference sequence.
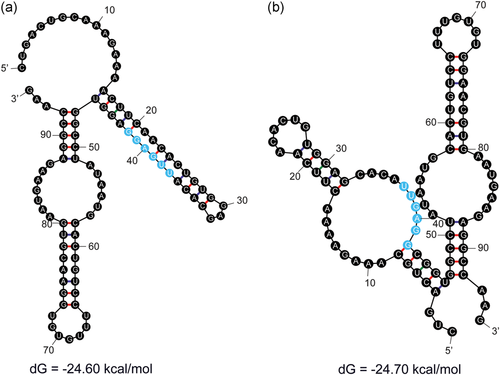
The variant rs771094081:A>C results in the loss of two putative ESS motifs but still decreases exon splicing efficiency. (a) The wild-type sequence of the exon harboring the mutation rs771094081:A>C has a putative ESS motif TTGAGG that is occluded by secondary structure. (b) The mutated sequence of the same exon results in a secondary structure conformation that increases the binding accessibility of putative ESS motif TTGAGG. ESS, exonic splicing silencer
3.2 Benchmarking against state-of-the-art splicing defect prediction tools
We next compared the performance of PEPSI and PEPSI-noSS in classifying SDVs among SNPs assayed in the MFASS experiment (Cheung et al., 2019) using several state-of-the-art tools, including HAL (Rosenberg et al., 2015), SPANR (Xiong et al., 2014), and MutPredSplice (Mort et al., 2014). We first compared the sensitivity and precision of PEPSI and PEPSI-noSS to SPANR in classifying SDVs from all 2,094 SNPs in the curated test set given that SPANR is capable of scoring both exonic and intronic SNPs. Both PEPSI and PEPSI-noSS demonstrated higher sensitivity and precision in classifying SDVs in the MFASS test set compared to SPANR (Table 2). Given that SPANR was trained to predict  of exons using human RNA-seq data (Xiong et al., 2014), predictions made by SPANR may more accurately reflect actual in vivo splicing than splicing activity observed in mini-gene splicing assays such as Vex-seq and MFASS. This could explain why SPANR underperformed in classifying SDVs in the MFASS test set compared to PEPSI and PEPSI-noSS.
| Model | TP | TN | FP | FN | Recall (%) | Precision (%) | Accuracy (%) | F1 score |
|---|---|---|---|---|---|---|---|---|
| PEPSI | 528 | 981 | 66 | 519 | 50.43 | 88.89 | 72.06 | 0.6435 |
| PEPSI-noSS | 604 | 978 | 69 | 443 | 57.69 | 89.75 | 75.55 | 0.7023 |
| SPANR | 398 | 958 | 89 | 649 | 38.01 | 81.72 | 64.76 | 0.5189 |
On the other hand, HAL and MutPredSplice were only able to make predictions on a subset of variants in the MFASS test set that were exonic, with HAL being able to predict on 1,045 variants (49.9% of the original test set) and MutPredSplice only able to predict on 575 variants (27.5% of the original test set). We restricted our benchmark analysis of PEPSI, PEPSI-noSS, SPANR, HAL, and MutPredSplice to the 575 exonic SNVs that were classifiable by all five tools (Table 3). For exonic variants, PEPSI and PEPSI-noSS again demonstrate better sensitivity and precision in predicting SDVs compared to SPANR. Moreover, PEPSI and PEPSI-noSS exhibited higher precision while maintaining the same level of sensitivity in predicting SDVs compared to MutPredSplice. In addition, while HAL had achieved the greatest sensitivity predicting SDVs among the tools tested, HAL also produced the most number of false-positive predictions.
| Model | TP | TN | FP | FN | Recall (%) | Precision (%) | Accuracy (%) | F1 score |
|---|---|---|---|---|---|---|---|---|
| PEPSI | 77 | 293 | 19 | 186 | 29.28 | 80.21 | 64.35 | 0.4290 |
| PEPSI-noSS | 119 | 291 | 21 | 144 | 45.25 | 85.00 | 71.30 | 0.5906 |
| SPANR | 57 | 275 | 37 | 206 | 21.67 | 60.64 | 57.74 | 0.3193 |
| HAL | 192 | 179 | 133 | 71 | 73.00 | 59.08 | 64.52 | 0.6531 |
| MutPredSplice | 79 | 269 | 43 | 184 | 30.04 | 64.75 | 60.52 | 0.4104 |
Given that the Vex-seq experiment was carried out using HepG2 cells whereas the MFASS experiment was carried out using Hek293T cells, we hypothesized that differences in transcriptome profiles between the two cell lines could explain for incorrect predictions made by both PEPSI and PEPSI-noSS. To approximate the correlation in transcriptome expression between HepG2 cells and Hek293T cells, we identified a total of 18 ExAC SNPs that were measured in both the Vex-seq experiment and the MFASS experiment. The Spearman correlation coefficient between the Vex-seq  values and the MFASS
  values for these 18 SNVs was
  (Figure 6). Based on this information, it is possible that better predictions by PEPSI and PEPSI-noSS could be achieved if our test set involved variants whose change in exon inclusion index were measured within HepG2 cells instead of Hek293T cells.
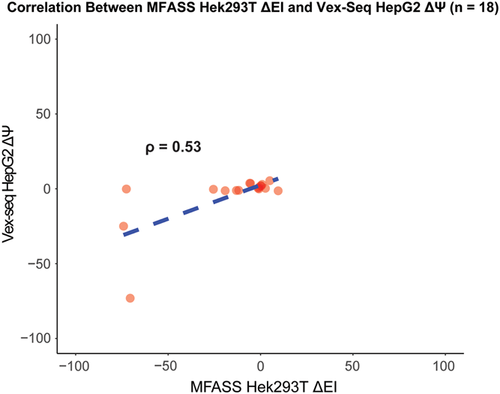
Correlation between HepG2 ΔΨ and Hek293T ΔEI for 18 ExAC SNVs, Measured HepG2 ΔΨ values (x-axis) vs. measured Hek293T ΔEI values (y-axis) for 18 ExAC SNVs that were assayed in both the Vex-seq experiment and the MFASS experiment. EI, exon inclusion index; ExAC, Exome Aggregation Consortium; SNV, single nucleotide variant
Interestingly, our control model PEPSI-noSS demonstrated greater sensitivity while maintain the same level of precision in predicting SDVs compared to PEPSI. There still remain several limitations in the SRE scoring method used by the PEPSI framework that could account for the model's underperformance in sensitivity. First, the region that is free to fold behind the transcribing RNA polymerase is not always of a fixed size, which PEPSI assumes for convenience of calculation. The size of this region and the availability of secondary structures that can form are influenced by the speed of transcription and local concentration of RNA binding proteins (Schroeder, Grossberger, Pichler & Waldsich, 2002). Moreover, it is possible that there are splicing factors that exclusively recognize RNA secondary structural elements. It is also possible that proteins that bind near the proximity of secondary structural elements can influence their single-strandedness. In such cases, the probability of single-strandedness may underestimate the true activity of the SRE. Devising a more nuanced method that considers the different ways in which secondary structure influences SRE recognition, as outlined above, could not only help explain directionality changes in measured  for variants, but also improve the sensitivity of predictions for splice-disrupting variants.
4 CONCLUSION
In the CAGI5 “Vex-seq” challenge, we investigated whether the use of secondary structure information could help improve predictions for genomic variants that disrupt SREs. We demonstrated that secondary structure information can help resolve cases where direct count changes in SREs do not correspond with the directionality of measured  values. Moreover, in a benchmark analysis involving other state-of-the-art splice prediction tools, we show that the PEPSI framework achieves comparable sensitivity and precision in predicting variants that disrupt splicing. However, the approach that PEPSI uses in weighing SRE count changes by the probability of secondary structure formation has several limitations that may restrict its sensitivity in detecting splice-disrupting variants.
There are also several limitations in using PEPSI to model in vivo splicing. First, our model was trained on data from massively parallel splicing assays. The design of these assays lack the full context of an entire gene and chromatin states, which have been shown to regulate in vivo splicing (Luco, Allo, Schor, Kornblihtt, & Misteli, 2011). Moreover, our model was not designed to predict  of variants in a cell-type specific manner. Given that the transcriptome profiles of HepG2 cells and Hek293T cells are likely to differ, training our model on Vex-seq experimental data may have led to misleading predictions of splice-disrupting variants detected in the MFASS experiment. Developing a cell-type specific model would provide a more accurate characterization of variant impact on exon splicing, especially in the context of certain diseases.
The predictive power of our computational model can likely be further improved through improvements to our approaches in SRE modeling using secondary structure and increased availability of splicing assay data for different cell types. Our model is openly available at https://github.com/rwang916/PEPSI for researchers to use freely for downstream analysis. All source code for PEPSI was built and tested on a Linux system.
ACKNOWLEDGEMENTS
We thank the organizers of the Fifth Critical Assessment of Genome Interpretation, especially Steven Brenner, John Moult, and Gaia Andreoletti, for coordinating and hosting these challenges. We are grateful to Scott Adamson and Brenton Graveley from the University of Connecticut for providing the Vex-seq experimental data in the “Vex-seq” challenge. We are also grateful to Steven Brenner for helpful discussions. This study was conducted in the laboratory of Steven Brenner at the University of California, Berkeley, Department of Plant and Microbial Biology. The CAGI experiment coordination is supported by NIH U41 HG007346 and the CAGI conference is supported by NIH R13 HG006650, U19 HD077627.
Open Research
DATA AVAILABILITY STATEMENT
Our tool is freely available to researchers at: https://github.com/rwang916/PEPSI.


