Risks of Light and Moderate Alcohol Use in Fatty Liver Disease: Follow-Up of Population Cohorts
Abstract
Background and Aims
The effects of alcohol use in nonalcoholic fatty liver disease are unclear. We investigated the impact of alcohol use in fatty liver disease on incident liver, cardiovascular, and malignant disease, as well as death.
Approach and Results
Our study comprised 8,345 persons with hepatic steatosis (fatty liver index >60) who participated in health-examination surveys (FINRISK 1992-2012 or Health 2000), with available data on baseline alcohol intake. Main exclusions were baseline clinical liver disease, viral hepatitis, ethanol intake >50 g/day, and current abstainers. Data were linked with national registers for hospital admissions, malignancies, and death regarding liver, cardiovascular, and malignant disease, as well as all-cause death. Adjustment were for multiple confounders. Alcohol consumption showed a dose-dependent risk increase for incident advanced liver disease and malignancies. Consuming 10-19 g/day of alcohol in general or 0-9 g/day as nonwine beverages doubled the risk for advanced liver disease compared to lifetime abstainers. In contrast, alcohol intake up to 49 g/day was associated with a 22%-40% reduction of incident cardiovascular disease (CVD). We observed a J-shaped association between alcohol intake and all-cause death with a maximal risk reduction of 21% (95% confidence interval, 5%-34%) at alcohol intake of 0-9 g/day compared to lifetime abstainers. However, these benefits on CVD and mortality were only observed in never smokers. Alcohol intake >30 g/day yielded increased risk estimates for mortality compared to lifetime abstainers. In a subpopulation with longitudinal data, alcohol intake remained stable over time in >80% of subjects.
Conclusions
Even low alcohol intake in fatty liver disease is associated with increased risks for advanced liver disease and cancer. Low to moderate alcohol use is associated with reduced mortality and CVD risk but only among never smokers.
Abbreviations
-
- ASA
-
- acetylsalicylic acid
-
- CI
-
- confidence interval
-
- CVD
-
- cardiovascular disease
-
- FLI
-
- fatty liver index
-
- HR
-
- hazards ratio
-
- ICD10
-
- International Classification of Diseases, Tenth Revision
-
- NAFLD
-
- nonalcoholic fatty liver disease
Nonalcoholic fatty liver disease (NAFLD) is the leading cause of chronic liver disease in Western countries with around 25% of the adult population affected.1 NAFLD encompasses a spectrum from simple accumulation of fat in the liver (steatosis) to steatohepatitis, fibrosis, liver cirrhosis, and hepatocellular carcinoma, with only a fraction of NAFLD patients developing advanced liver disease. The condition is interlinked with features of the metabolic syndrome including obesity, insulin resistance, type 2 diabetes, and atherogenic dyslipidemia. Paralleling the worldwide increase of obesity and the metabolic syndrome, NAFLD is rapidly becoming the leading indication for liver transplantation and a major cause for liver cancer.2
Although heavy alcohol intake has many detrimental effects on health, epidemiological data link light to moderate drinking with reduced cardiovascular mortality in the general population.3, 4 Cardiovascular disease (CVD) is the most common cause of death in NAFLD,5 but it remains unclear whether the proposed cardiovascular benefits of light alcohol use extend to individuals with NAFLD (without cirrhosis). Furthermore, even minimal alcohol consumption has been linked to an increased risk for certain cancers,6, 7 and cancer is another leading cause of death in NAFLD.5
Whether light to moderate alcohol use affects progression of NAFLD is also unclear.8 NAFLD is currently separated from alcoholic liver disease by an arbitrary daily alcohol intake of 30 g for men and 20 g for women, under the assumption that alcohol intake below these thresholds is insufficient to induce hepatic steatosis.9-11 Evidence from some studies even points to protective effects of light to moderate alcohol consumption in the form of a reduced prevalence of NAFLD and liver fibrosis.12-16 These studies, however, are cross-sectional, use surrogate endpoints, are typically based on selected patients, and are limited by incomplete adjustment for confounders. Many studies failed to consider the pattern and type of alcohol use in addition to average alcohol intake and did not separate between lifetime abstainers and current abstainers, the latter of whom may be enriched in former heavy drinkers. In addition, with regard to the risk for advanced liver disease, prospective studies from the general population suggest that no safe limit of alcohol use exists.17, 18
The potential benefit and harm of light to moderate alcohol use in NAFLD is therefore currently unclear. Therefore, no evidence-based recommendations can currently be given on how to counsel patients with NAFLD regarding alcohol use.8, 19 This is an important issue given that the majority of subjects with NAFLD do consume some amount of alcohol.20, 21
We analyzed the effect of various levels of alcohol intake on the risk for development of advanced liver disease, CVD, malignancies, and all-cause death among individuals with fatty liver disease in a large general population cohort with linkage to national health care registries.
Materials and Methods
Cohorts
Baseline data were extracted from the population-based National FINRISK Studies from 1992, 2002, 2007, and 2012 and the Health 2000 survey from 2000-2001.22, 23 The FINRISK studies are cross-sectional population surveys carried out in Finland in a systematic and standardized fashion every 5 years since 1972 by the National Institute for Health and Welfare (previously the National Public Health Institute), to assess risk factors for chronic diseases in representative population samples of adults aged 25-74 years (FINRISK 1992: 25-64 years) drawn from the Finnish Population Information System, stratified by sex, 10-year age groups, and four to six geographical areas of Finland. The number of invitees has varied over the years from 7,927 to 13,498, as have participation rates from 57% to 94%.23
The Health 2000 Survey was also coordinated by the National Institute for Health and Welfare (previously the National Public Health Institute), and originally comprised 8,028 adults aged 30 years and over; participation rate in the full examinations was 80%.22 The cohort is considered representative of the entire Finnish population through a regional two-stage stratified cluster sampling procedure.
The methods, measurements, and protocols used in the FINRISK studies have been essentially the same over time and are similar to those in the Health 2000 Survey.22, 23 Data were collected from each participant at baseline through interviews (Health 2000), questionnaire, and health examination by trained physicians and nurses (Health 2000), and trained nurses (FINRISK) using standardized procedures of the MONICA24 and European Health Risk Monitoring 25 projects. Blood samples collected at baseline for a wide spectrum of laboratory measurements were handled using a standardized protocol. Detailed descriptions of study protocols have been published.22, 23 All participants provided signed informed consent, and the studies were approved by the Coordinating Ethical Committee of the Helsinki and Uusimaa Hospital District (previously studies were also approved by the institutional review board of the National Public Health Institute).
Participants
The present study included individuals with fatty liver disease, defined as a fatty liver index (FLI) ≥ 60,26 and with available data on alcohol use. A description of the FLI is found in the Supporting Information. We excluded individuals with a baseline diagnosis of chronic liver disease (International Classification of Diseases, Tenth Revision [ICD10], K70-K77, C22.0; ICD8/9, 570-573, 155.0), chronic viral hepatitis at baseline or during follow-up (ICD10, B18), current alcohol abstainers (had used alcohol earlier and then stopped), and subjects reporting consumption of >50 g ethanol/day (Fig. 1). NAFLD is usually differentiated from alcoholic fatty liver disease by an arbitrary limit of daily alcohol intake of 30 g for men and 20 g for women. As this limit is based on minimal evidence, we extended the limit to include up to 49 g to allow for a more comprehensive picture of the impact of alcohol.

Baseline Data
Respondents were asked to report how often they had consumed alcoholic beverages during the previous year and the average amount they had consumed per week during the previous month. Average alcohol intake (grams per day) was calculated as the sum of the daily number of drinks multiplied by the average alcohol content per type of alcoholic beverage. The fraction of wine consumption of total alcohol use was assessed separately. Participants were also asked if they had been abstinent their entire life (lifetime abstainer) or had used alcohol earlier and then stopped (current abstainer). Binge drinking was defined as drinking five or more alcohol drinks per occasion, in line with previous studies.27, 28 Respondents reported the number of times during the last 12 months that they had consumed five or more drinks per occasion.
Current and previous use of acetylsalicylic acid (ASA) was reported. Exercise was assessed by asking how often the subject performs leisure-time physical exercise for at least 20-30 minutes so that he or she is at least slightly out of breath and sweaty. Diabetes was defined either by a fasting serum glucose ≥7.0 mmol/L (126 mg/dL), by taking diabetic medication, or by having a prior known diabetes diagnosis. Baseline cardiovascular risk was calculated by the FINRISK score (see Supporting Information).
Follow-Up Data
Follow-up data for hospitalizations were obtained from the National Hospital Discharge Register, which covers all hospitalizations in Finland since 1969. One or several ICD diagnoses are assigned to each hospitalization at discharge; these diagnosis codes are systematically recorded in the National Hospital Discharge Register. Data for malignancies were obtained from the Finnish Cancer Registry, with nationwide cancer records since 1953. Vital status and the cause of death data were obtained from Statistics Finland, which systematically collects data about the deaths of all Finnish citizens. In Finland, each person who dies is by law assigned a cause of death (in accordance with the ICD) on the official death certificate, issued by the treating physician based on medical or autopsy evidence or forensic evidence when necessary; the death codes are then verified by medical experts at the register and recorded according to systematic coding principles. Data collection for all these registries is mandatory by law, and general quality is consistent and complete.29 Linkage was performed using the unique personal identity code assigned to all Finnish residents. Follow-up for deaths and hospitalizations was until December 2013 and for cancers until December 2012 or until emigration. With the help of these nationwide registers, the follow-up is virtually 100% complete.
Outcomes
Study endpoints were fatal and nonfatal advanced liver disease (requiring hospital admission or causing liver cancer or liver-related death), CVD events, cancer, and all-cause death. The ICD codes used for defining these various endpoints are listed in Supporting Table S1. Hospital admission due to liver disease means that a liver-related complication was the main cause or a highly relevant contributing cause of hospitalization. A breakdown of ICD codes for hospital admissions is shown in Supporting Fig. S2.
Subpopulation With Follow-up Data on Alcohol Intake
To study the stability of alcohol intake over time, we performed a subpopulation analysis on general population subjects who by chance had participated in two different surveys. We included subjects regardless of the FLI but otherwise with the same study inclusion and exclusion criteria. Pearson’s correlation was used for testing a potential association between baseline FLI and a change in alcohol intake by >10 g/day at follow-up.
Statistical Analyses
For comparing groups, we used chi-squared or Mann Whitney tests as appropriate. Average alcohol intake was divided into the following strata: lifetime abstainers, 0-9, 10-19, 20-29, 30-39, and 40-49 g/day. Trends in baseline characteristics across alcohol strata were tested, for continuous variables, by the Jonckheere-Terpstra test and, for categorical variables, by the linear-by-linear test. Baseline predictors of outcome events were estimated by adjusted hazard ratios (HRs) with 95% confidence intervals (CIs) using the Cox proportional hazards models with time to first event as the outcome variable. Several multivariate models were constructed separately for each outcome with various levels of adjustment (see Supporting Information for a detailed description of multivariate analyses). The proportional hazards assumption of the Cox model was checked using Schoenfeld residuals, and no violations were detected. The relationship between average alcohol use and the various outcomes was examined using the penalized spline smoothing method30 with multivariate adjustment. Individuals with baseline CVD or cancer were excluded from the analyses that looked at these outcomes. Subgroup analyses were by age tertiles, gender, calendar-time period, wine intake, diabetes status, smoking status (current, former, never), and binge-drinking habits (excluding subjects reporting ≥5 drinks per occasion at least once monthly). Separate analyses were performed with death at age <75 years (premature death) or more severe forms of liver disease as the outcome (Supporting Information). Effect modification of the FLI for the association between alcohol use and liver-disease risk was analyzed in the overall cohort of 27,774 individuals (Fig. 1) in three strata: FLI < 30 (no steatosis), 30-59 (possible steatosis), and ≥60 (steatosis). P values < 0.05 were considered statistically significant. Data were analyzed with SPSS, version 23, and R software, version 3.2.5.
Results
The study comprised 8,345 individuals with fatty liver disease, 5,048 men and 3,297 women (Table 1). There were significant differences between men and women for all the baseline variables except for exercise habits, systolic blood pressure, total cholesterol, and low-density lipoprotein cholesterol level (Table 1). We observed significant trends across strata of average alcohol intake for all baseline variables except for the fraction of wine consumption, total cholesterol, low-density lipoprotein cholesterol, and family history of CVD or cancer (Supporting Table S2). In particular, lifetime abstainers were on average older, more often women, in lower educational groups, and less often smokers and exhibited higher 10-year risk for CVD (17% among abstainers versus 7.8%-10% in the various alcohol strata) as calculated by the FINRISK score (Supporting Table S2).
| All Subjects | Men | Women | P | |
|---|---|---|---|---|
| Persons | 8,345 | 5,048 | 3,297 | |
| Age (years), mean (SD) | 53.7 (12.6) | 52.5 (12.3) | 55.5 (12.9) | <0.001 |
| Marital status, n (%) | <0.001 | |||
| Married/partnership | 6,189 (74) | 4,027 (80) | 2,162 (66) | |
| Single | 2,146 (26) | 1,016 (20) | 1,130 (40) | |
| Education, n (%) | <0.001 | |||
| Basic | 3,046 (37) | 1,673 (33) | 1,373 (42) | |
| Secondary | 2,765 (33) | 1,753 (35) | 1,012 (31) | |
| Higher | 2,449 (30) | 1,584 (32) | 865 (27) | |
| Employment status, n (%) | <0.001 | |||
| Part-time or full-time employed | 4,652 (56) | 3,104 (62) | 1,548 (47) | |
| Retired | 2,866 (35) | 1,555 (31) | 1,311 (40) | |
| Other | 758 (9) | 348 (7) | 410 (13) | |
| Alcohol consumption (g/day), n (%) | <0.001 | |||
| Lifetime abstainer | 993 (12) | 272 (5) | 721 (22) | |
| 0-9 | 4,429 (53) | 2,353 (47) | 2,076 (63) | |
| 10-19 | 1,448 (17) | 1,139 (23) | 309 (9) | |
| 20-29 | 761 (9) | 657 (13) | 104 (3) | |
| 30-39 | 460 (6) | 397 (8) | 63 (2) | |
| 40-49 | 254 (3) | 230 (4) | 24 (1) | |
| Percentage wine consumption of total alcohol consumption, mean (SD)* | 23 (33) | 17 (28) | 37 (40) | <0.001 |
| 0% | 2,933 (53) | 2,210 (57) | 723 (42) | |
| 1%-40% | 1,282 (23) | 977 (26) | 305 (18) | |
| >40% | 1,357 (24) | 667 (17) | 690 (40) | |
| Frequency of binge drinking, n (%)† | <0.001 | |||
| Weekly | 673 (12) | 579 (18) | 94 (5) | |
| Monthly | 885 (17) | 713 (22) | 172 (8) | |
| Less often or never | 3,752 (71) | 1,911 (60) | 1,841 (87) | |
| Smoking status, n (%) | <0.001 | |||
| Current | 1,941 (23) | 1,350 (27) | 591 (18) | |
| Former | 2,399 (29) | 1818 (36) | 581 (18) | |
| Never | 3,967 (48) | 1,858 (37) | 2,109 (64) | |
| Excercise, n (%) | 0.16 | |||
| At least 2 times a week | 3,613 (52) | 2,166 (51) | 1,447 (54) | |
| 2-4 times a month | 1,922 (28) | 1,182 (28) | 740 (27) | |
| Less often | 1,404 (20) | 881 (21) | 523 (19) | |
| Body mass index (kg/m2), mean (SD) | 31.5 (4.4) | 30.3 (3.7) | 33.3 (4.7) | <0.001 |
| Waist circumference (cm), mean (SD) | 105.0 (10.1) | 106.0 (9.7) | 103.4 (10.4) | <0.001 |
| Diabetes, n (%) | 1,198 (14) | 622 (12) | 576 (18) | <0.001 |
| Systolic blood pressure (mm Hg), mean (SD) | 141 (20) | 141 (18) | 142 (21) | 0.36 |
| Serum total cholesterol (mmol/L), mean (SD) | 5.8 (1.1) | 5.8 (1.2) | 5.9 (1.1) | 0.069 |
| Serum LDL cholesterol (mmol/L), mean (SD) | 3.6 (1.0) | 3.6 (1.0) | 3.6 (1.0) | 0.13 |
| Serum HDL cholesterol (mmol/L), mean (SD) | 1.3 (0.3) | 1.2 (0.3) | 1.3 (0.4) | <0.001 |
| Serum triglycerides (mmol/L), mean (SD) | 2.1 (1.3) | 2.3 (1.4) | 2.0 (1.2) | <0.001 |
| Glutamyltransferase (U/L), mean (SD) | 53.0 (68.9) | 56.8 (70.5) | 47.0 (66.0) | <0.001 |
| History of CVD | 514 (6) | 394 (8) | 120 (4) | <0.001 |
| History of cancer | 327 (4) | 146 (3) | 181 (6) | <0.001 |
| Family history of CVD, n (%) | 2,815 (44) | 1,682 (41) | 1,133 (49) | <0.001 |
| Family history of cancer, n (%) | 1,662 (34) | 1,000 (33) | 662 (36) | 0.024 |
| FINRISK score, mean (SD) | 10.2 (15.0) | 10.6 (15.2) | 9.6 (14.8) | <0.001 |
| Use of ASA, n (%) | 0.046 | |||
| In the past week | 926 (19) | 608 (19) | 318 (17) | |
| Earlier | 364 (7) | 214 (7) | 150 (8) | |
| Never | 3,719 (74) | 2,315 (74) | 1,404 (75) | |
| Unknown | 3,336 (40) | 1,911 (38) | 1,425 (43) | |
- * Calculated for subjects reporting alcohol use (abstainers excluded).
- † Five or more alcohol portions per occasion (1 portion = 12 g of ethanol).
- Abbreviations: HDL, high-density lipoprotein; LDL, low-density lipoprotein.
The mean follow-up time until death or end of follow-up was 11.1 years (SD, 5.9; range, 0-23.0), yielding 92,350 person-years of follow-up. During follow-up, we observed 152 events of incident advanced liver disease (admission, liver cancer, or death), 1,003 incident CVD events, 794 incident cancers, and 1,142 deaths. Among men, the respective numbers of observed liver events, CVD events, cancers, and deaths were 94, 680, 489, and 718 and among women, 58, 323, 305, and 424.
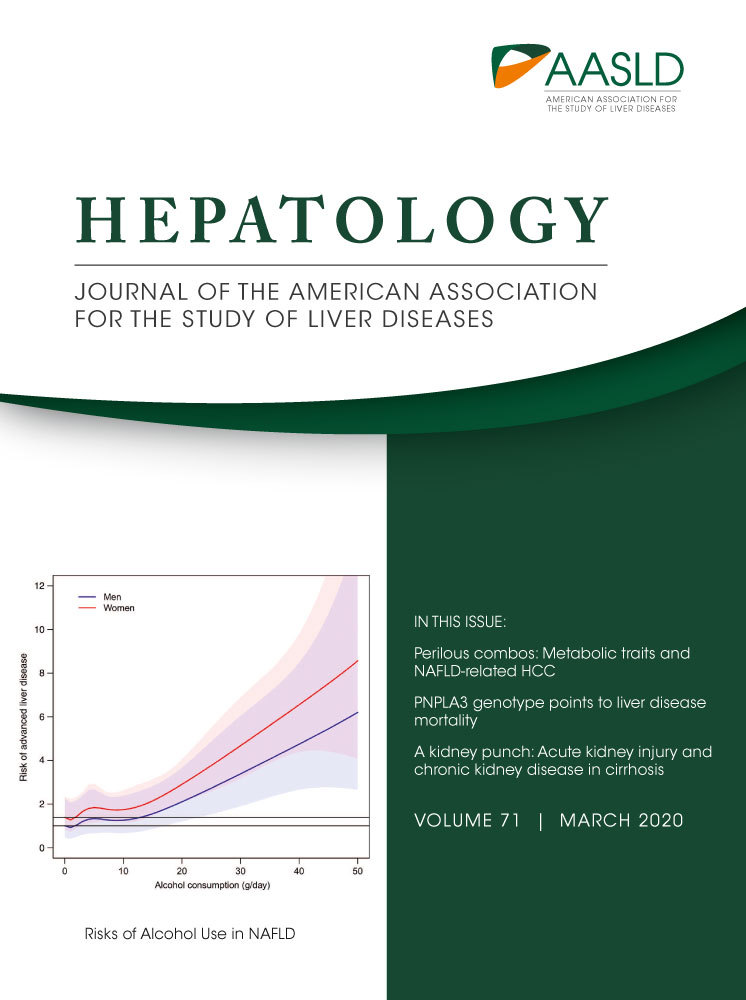
Table 2 shows the number of outcome events, age-adjusted incidence rates, and adjusted HRs for the four different outcomes across strata of alcohol intake. Figure 2 shows the association between average alcohol intake and the risk for the four outcomes separately for men and women. Even low alcohol use (0-9 g/day) produced elevated HRs for incident liver disease compared to lifetime abstainers, but these estimates became statistically significant at an alcohol intake of 10-19 g/day (Table 2).
| Lifetime Abstainer | Alcohol Use (g/day) | |||||
|---|---|---|---|---|---|---|
| 0-9 | 10-19 | 20-29 | 30-39 | 40-49 | ||
| Liver outcomes | ||||||
| No. events | 13 | 59 | 25 | 22 | 16 | 17 |
| Age-adjusted incidence rate (per 100,000) | 94.0 | 123.0 | 148.7 | 250.9 | 333.2 | 570.8 |
| Age-adjusted and sex-adjusted HR (95% CI) | Reference | 1.34 (0.72-2.49) | 2.16 (1.05-4.46) | 3.67 (1.73-7.78) | 4.71 (2.14-10.40) | 9.53 (4.33-21.00) |
| Model 1 HR (95% CI) | Reference | 1.40 (0.74-2.62) | 2.23 (1.06-4.70) | 3.80 (1.76-8.24) | 4.71 (2.09-10.58) | 9.29 (4.16-20.75) |
| Model 2 HR (95% CI) | Reference | 1.37 (0.72-2.59) | 2.24 (1.06-4.75) | 3.83 (1.76-8.35) | 4.61 (2.04-10.43) | 9.34 (4.14-21.09) |
| Model 3 HR (95% CI) | Reference | 1.38 (0.74-2.58) | 2.18 (1.05-4.53) | 3.62 (1.69-7.76) | 3.53 (1.53-8.14) | 8.79 (3.95-19.56) |
| CVD outcomes | ||||||
| No. events | 176 | 519 | 154 | 84 | 49 | 21 |
| Age-adjusted incidence rate (per 100,000) | 1139.5 | 1101.9 | 1123.1 | 1255.6 | 1191.9 | 1838.6 |
| Age-adjusted and sex-adjusted HR (95% CI) | Reference | 0.80 (0.67-0.96) | 0.82 (0.65-1.05) | 0.78 (0.59-1.04) | 0.80 (0.59-1.04) | 0.64 (0.40-1.03) |
| Model 1 HR (95% CI) | Reference | 0.88 (0.73-1.06) | 0.93 (0.73-1.19) | 0.88 (0.66-1.17) | 0.87 (0.62-1.22) | 0.71 (0.45-1.14) |
| Model 2 HR (95% CI) | Reference | 0.89 (0.74-1.08) | 0.98 (0.76-1.25) | 0.89 (0.66-1.19) | 0.90 (0.64-1.27) | 0.76 (0.47-1.21) |
| Model 3 HR (95% CI) | Reference | 0.78 (0.64-0.95) | 0.78 (0.60-1.01) | 0.71 (0.53-0.97) | 0.71 (0.50-1.00) | 0.60 (0.37-0.96) |
| Cancer | ||||||
| No. events | 110 | 430 | 123 | 58 | 47 | 26 |
| Age-adjusted incidence rate (per 100,000) | 608.6 | 837.7 | 855.5 | 649.4 | 1235.3 | 2389.9 |
| Age-adjusted and sex-adjusted HR (95% CI) | Reference | 1.34 (1.07-1.67) | 1.47 (1.11-1.96) | 1.29 (0.91-1.82) | 1.86 (1.29-2.68) | 1.99 (1.27-3.12) |
| Model 1 HR (95% CI) | Reference | 1.25 (0.99-1.58) | 1.34 (0.99-1.81) | 1.16 (0.81-1.65) | 1.64 (1.13-2.40) | 1.77 (1.12-2.80) |
| Model 2 HR (95% CI) | Reference | 1.23 (0.97-1.56) | 1.30 (0.96-1.76) | 1.13 (0.79-1.62) | 1.62 (1.11-2.37) | 1.76 (1.11-2.79) |
| Model 3 HR (95% CI) | Reference | 1.24 (0.98-1.57) | 1.31 (0.96-1.77) | 1.14 (0.79-1.63) | 1.58 (1.08-2.32) | 1.75 (1.10-2.79) |
| All-cause death | ||||||
| No. events | 260 | 554 | 150 | 81 | 63 | 34 |
| Age-adjusted incidence rate (per 100,000) | 1104.1 | 1026.9 | 956.4 | 1185.7 | 1440.9 | 1696.5 |
| Age-adjusted and sex-adjusted HR (95% CI) | Reference | 0.79 (0.67-0.92) | 0.89 (0.70-1.11) | 0.87 (0.66-1.14) | 1.24 (0.92-1.67) | 1.29 (0.89-1.88) |
| Model 1 HR (95% CI) | Reference | 0.73 (0.61-0.86) | 0.75 (0.59-0.96) | 0.71 (0.54-0.95) | 1.00 (0.73-1.35) | 1.03 (0.70-1.51) |
| Model 2 HR (95% CI) | Reference | 0.75 (0.63-0.89) | 0.80 (0.63-1.02) | 0.74 (0.55-0.98) | 1.03 (0.76-1.41) | 1.12 (0.76-1.64) |
| Model 3 HR (95% CI) | Reference | 0.79 (0.66-0.95) | 0.87 (0.68-1.11) | 0.79 (0.59-1.06) | 1.05 (0.76-1.45) | 1.20 (0.81-1.77) |
- Adjustments are for (A) liver events, in model 1: age, sex, body mass index, smoking, exercise, and diabetes; in model 2: model 1 + employment, marital status and education; in model 3: age, sex, employment, exercise, waist circumference, diabetes, systolic blood pressure, high-density lipoprotein cholesterol, glutamyltransferase and FINRISK score. (B) CVD events, in model 1: age, sex, FINRISK score, ASA use, and exercise; in model 2: model 1 + employment, marital status and education; in model 3: age, sex, ASA use, education, employment, smoking, exercise, waist circumference, diabetes, systolic blood pressure, total cholesterol, high-density lipoprotein cholesterol, triglyceride level, serum glutamyltransferase, and history of cancer. (C) Cancer, in model 1: age, sex, smoking, body mass index, ASA use, exercise, diabetes, and family history of cancer; in model 2: model 1 + employment, marital status and education; in model 3: age, sex, ASA use, marital status, education, employment, smoking, exercise, waist circumference, diabetes, systolic blood pressure, total cholesterol, triglyceride level, family history of cancer, and history of CVD. (D) All-cause death, in model 1: age, sex, smoking, exercise, diabetes, body mass index, systolic blood pressure, and total cholesterol; in model 2: model 1 + employment, marital status and education; in model 3: age, sex, marital status, education, employment, smoking, exercise, body mass index, waist circumference, diabetes, systolic blood pressure, ASA use, serum glutamyltransferase, history of cancer, and history of CVD.

Low alcohol use (0-9 g/day) was also associated with an increased risk for incident cancer compared to lifetime abstainers (Table 2), with borderline significance in multivariate analyses. At alcohol intake >30 g/day the increased risk for cancer was significant in all multivariate models (Table 2 and Fig. 2).
Alcohol intake up to 49 d/day was associated with reduced risks for incident CVD events, with the risk reduction varying by alcohol strata from 22% to 40% in the fully adjusted model (Table 2 and Fig. 2).
We observed a J-shaped association between alcohol intake and all-cause death with a maximal risk reduction of 21% at alcohol intake of 0-9 g/day in the fully adjusted model (Table 2). With alcohol intake >30 g/day, the risk of death tended to increase along with rising alcohol consumption above that observed in lifetime abstainers in all models and among both men and women (Table 2 and Fig. 2).
Effect Modification of Wine
The effect of alcohol intake of 0-24 g/day on the risk for incident CVD was sensitive to the fraction of wine intake, with a larger risk reduction seen in preferential wine drinkers compared to lifetime abstainers (Fig. 3). A similar trend was seen for all-cause death. In addition, whereas consumption of nonwine alcohol beverages of <25 g/day raised the risk for liver events 2.1-fold compared to lifetime abstainers, low preferential wine drinking exhibited nonsignificant risk estimates for liver disease (Fig. 3). In contrast, low drinking raised the risk for cancer without any clear effect modification from the fraction of wine.

Alcohol intake of 25-49 g/day was associated with increased risks for liver disease and cancer regardless of the fraction of wine and an increased risk for death in preferential non–wine drinkers (Fig. 3).
Subgroup Analyses
Risk estimates for low alcohol use were increased in the lowest age tertile compared to the middle and highest tertiles (Supporting Table S3). There was no evident effect modification of age for other outcomes.
With regard to smoking status, the reduced risks for CVD and mortality with low alcohol use were evident only among never smokers (Supporting Table S3), a finding confirmed in multivariate-adjusted analysis (Fig. 4). The alcohol-related risk increase for cancers was accentuated among current smokers (Supporting Table S3).

We observed no major effect modification by diabetes status or binge-drinking status on the HR estimates for each outcome across strata of average alcohol intake (Supporting Table S3). The effect of alcohol on cancer risk was more evident in older cohorts (FINRISK 1992 and 2002 and Health 2000), where the follow-up was longer and the number of events higher (Supporting Table S3).
Findings were practically unaltered when considering premature death as the outcome (Supporting Table S5) or when restricting liver outcomes to ICD codes reflective of liver cirrhosis, liver dysfunction, or equivalent (Supporting Table S6).
Effect Modification of the FLI
In the overall cohort of 27,774 individuals, we found a steeper increase in the adjusted HRs for liver disease in the higher FLI groups at any given level of alcohol use (Supporting Fig. S1), suggesting increased harm from alcohol in the presence of fatty liver disease.
Stability of Alcohol Intake Over Time
Among 492 subjects (mean age 47 years, women 53%) who had participated in two different surveys at an average of 9.0 years (SD, 4.6) apart, mean alcohol intake changed from 7.2 g/day (SD, 9.4) to 10.2 g/day (SD, 18.0) (P = 0.30). Percentage wine consumption of total alcohol consumption increased from 26% to 33% (P < 0.001).
Alcohol intake remained stable in 373 (82%) subjects, increased by >10 g/day in 57 (13%), and decreased by >10 g/day in 27 (6%). All lifetime abstainers either remained abstainers or drank <10 g/day at follow-up. Among those consuming 0-9 g/day, alcohol use remained stable in 91%. In contrast, among those with baseline alcohol intake >30 g/day, 48% had reduced their alcohol intake by >10 g/day at follow-up. We found no significant correlation between baseline FLI and the change in alcohol consumption over time (P = 0.83).
Discussion
This study analyzes the associations between alcohol and incident liver disease, CVD, cancer, and all-cause mortality specifically in persons with a fatty liver. We found no benefits from low alcohol intake with regard to the risk for advanced liver disease in such persons. While there was no appreciable liver harm from consuming one glass of wine per day, even low consumption of nonwine beverages doubled the risk for liver disease. Consuming >10 g/day of alcohol increased the risk for liver disease in a dose-dependent fashion regardless of the level of adjustment for confounders. In addition, moderate alcohol intake, and with borderline significance also low alcohol intake, whether wine or nonwine, tended to increase the risk for cancers in both men and women.
Alcohol consumers had a consistently lower risk for incident CVD than lifetime abstainers, an effect most obvious in the fully adjusted multivariate model. We observed a J-shaped relationship between alcohol use and all-cause mortality, with a maximal risk reduction of 21% at alcohol intake of 0-9 g/day in the fully adjusted model. Larger risk reductions for both death and CVD were seen in preferential wine drinkers than in non–wine drinkers. Alcohol intake >30 g/day was associated with increased mortality. However, the J-shaped relationship between alcohol and mortality was only evident in never smokers.
Strengths of our study include the large and well-characterized population-based cohorts of men and women with longitudinal follow-up and hard endpoints (hospital admission, cancer, death) from reliable national registries. We were able to adjust for multiple acknowledged confounders.3, 31 Additional strengths include the ability to account for wine intake and binge drinking and exclusion of current abstainers, which may be enriched with former heavy drinkers and more comorbidity.32, 33 By exclusion of cases with chronic viral hepatitis at baseline or during follow-up, we avoided any confounding impact of these factors.
Underreporting alcohol use and recall bias is a concern in any observational study but more so when data are collected in liver clinics from patients with known liver disease where awareness of the liver condition may affect patient responses.8 In contrast, because the majority of subjects in our study were likely unaware of having a fatty liver, bias from intentional underreporting of alcohol consumption is likely considerably lower in this setting. Recall bias is still a concern because respondents were asked to recall the frequency of alcohol use during the previous year. Underreporting alcohol use would tend to bias the risk estimates toward the null hypothesis, which is less of an issue when the risk estimates, as in our study, are significantly elevated.
A major study limitation is that alcohol habits were assessed only once, during the previous year. However, we were able to analyze changes over time in alcohol use in a subpopulation and found that 82% had stable alcohol consumption over time. As in previous studies,34, 35 we found that drinking habits remained much more stable in low and moderate drinkers than in heavy drinkers, with >90% of those consuming alcohol 0-9 g/day remaining in the same consumption category.
Despite a large number of factors adjusted for in multivariate analyses, residual uncontrolled confounding may exist. For instance, wine drinkers may exhibit a healthier lifestyle profile, such as eating healthier food36 and more often being nonsmokers. However, such uncontrolled confounding could be reasonably minimized by adjusting for a wide variety of factors that are also affected by the same lifestyle habits, such as obesity, blood pressure, cholesterol and triglyceride levels, and diabetes, as well as socioeconomic status. Indeed, adherence to a healthy diet is associated with less abdominal obesity.37 Nonetheless, uncertainty remains as to whether the observed benefits of light wine consumption are due to wine itself or associated health behaviors not controlled for in our study. Another study limitation was the inability to analyze effect modification by race as the Finnish population is chiefly Caucasian.
The diagnosis of hepatic steatosis was based on the FLI, which is a surrogate rather than an absolute measure of liver fat. It is, however, a widely validated index, supported by the European Association for the Study of the Liver to be used in large population studies.9 The applicability of the FLI is further supported by the fact that the prevalence of hepatic steatosis (FLI ≥ 60) of 30% in our cohorts was very similar to that reported in previous Finnish studies using other diagnostic modalities.38 A limitation was our inability to study the impact of the severity of liver fibrosis or steatohepatitis on outcomes.
Previous Studies On Liver Outcomes
No prospective trial on low to moderate alcohol use in NAFLD exists, and current evidence therefore relies on observational studies. In the general population not specific to NAFLD, alcohol intake as low as 12-20 g/day has been associated with increased risk for liver disease.39 However, these studies typically failed to adjust for metabolic factors, and many were performed before the current NAFLD pandemic. In addition, many studies failed to consider nonfatal liver disease outcomes, which neglects a significant portion of clinically relevant liver events.
Furthermore, in NAFLD, the impact of alcohol is more complex. Some cross-sectional studies on NAFLD subjects suggest that moderate alcohol use, compared to abstinence, is associated with less advanced histological liver disease.12, 14-16 However, as recently reviewed,8 these studies are limited by major methodological concerns including the cross-sectional design, incomplete adjustment for confounders, and statistical power. Cross-sectional studies are unable to establish temporal relationships. In addition, various lifestyle factors may affect the pattern of alcohol use and thereby confound the observed associations. Most studies looked at the degree of liver fibrosis but not clinical liver complications.
One recent longitudinal study of 285 patients with biopsy-confirmed NAFLD found that alcohol intake of two or fewer drinks per day was associated with lower odds of histological steatohepatitis resolution compared to total abstinence.20 Longitudinal studies on subjects with advanced liver fibrosis or cirrhosis have moreover reported associations between low to moderate alcohol use and increased risks for hepatocellular carcinoma,40, 41 liver decompensation, and liver-related death.41 Although based on specific patient groups with advanced liver disease, these studies seem to support our finding that no safe limit of alcohol exists with regard to the risk for progression of liver disease in subjects with a fatty liver.
Previous Studies On Nonhepatic Outcomes
A 2006 meta-analysis3 of 34 studies with 1,015,835 subjects and 94,533 deaths found a J-shaped relationship between alcohol use and all-cause mortality in the general population. In the studies with lifetime abstainers as the reference group, the maximal risk reduction of approximately 15% was seen at alcohol intake of 0-10 g/day with a significant risk reduction up to 30 g/day.3 This finding is well in line with our findings. Another meta-analysis found a similar J-shaped association between alcohol, especially wine, and CVD risk.31 The protective effect of low alcohol intake from CVD and death has been attributed to an improved insulin sensitivity and lipid profile, inhibition of platelet activation, reduction of fibrinogen level, and anti-inflammatory effects of alcohol.42, 43 Phenols and polyphenols in wine and beer are potential mediators.44
In the NAFLD population, one cross-sectional study found moderate alcohol use to be associated with decreased odds of having subclinical CVD, compared to abstinence.45 This is in contrast with a more recent study with prospectively assessed alcohol consumption over time, which found no association between alcohol use and the presence of CVD risk factors or subclinical CVD.46 Nonetheless, clinical CVD events were not analyzed.
A recent study based on the US population with 4,568 subjects with NAFLD (defined by the hepatic steatosis index) found reduced mortality among subjects consuming 0.5-1.5 alcoholic drinks/day, whereas >1.5 drinks/day became harmful, thus reinforcing a J-shaped association.47
In the general population, a number of studies link light to moderate alcohol intake with elevated risk for certain cancers,6, 7 similar to what was observed in our study on NAFLD subjects.
Our findings may help in individualized counseling regarding alcohol intake for individuals with NAFLD. We found no evidence for appreciable harm from one glass of wine per day in nonsmoking NAFLD patients, so this may not need to be prohibited in the average individual with NAFLD without advanced liver disease. In NAFLD with advanced liver disease or particular risk for progressive liver disease, however, complete alcohol abstinence seems warranted. The clinical implications of the J-shaped association between alcohol and incident CVD and death in never smokers remain unclear. From a holistic point of view, there are more effective and safer means to reduce CVD risk, and given the elevated risk estimates for liver disease and cancer, light to moderate alcohol drinking cannot be encouraged in NAFLD subjects.
In conclusion, in subjects with fatty liver disease, even light consumption of nonwine alcoholic beverages doubled the risk for future advanced liver disease. Moderate alcohol intake increased the overall risk for cancer. Alcohol intake was associated with a reduced risk for CVD events and with a J-shaped association with all-cause mortality in nonsmoking subjects.
Acknowledgment
The data used for the research were from THL (obtained from THL Biobank). We thank all study participants for their generous participation in the FINRISK 1992-2012 studies and the Health 2000 Survey.