Characteristics of Immune Response to Tumor-Associated Antigens and Immune Cell Profile in Patients With Hepatocellular Carcinoma
Abstract
Host antitumor immune responses may be different between hepatocellular carcinoma (HCC) caused by metabolic disorders and HCC associated with hepatitis virus infection. In this study, we examined the immune response of tumor-associated antigen (TAA)–specific T cells and immune cell profile in patients with HCC separated by cause. Thirty-two patients with hepatitis B virus (HBV)–related HCC, 42 patients with hepatitis C virus–related HCC, and 18 patients with nonalcoholic steatohepatitis (NASH)–related HCC were analyzed. The frequencies of TAA-specific T cells, the expression levels of surface markers on each immune cell, and the expression of each TAA in HCC tissue were measured. The immune response to TAA and immune cell profile were markedly different among the three groups. The immune response to TAA in the NASH-related HCC group was weaker than the responses in the other two groups. In patients with NASH-related HCC, the frequencies of effector regulatory T cells (eTregs) and cluster of differentiation 8–positive (CD8+) T cells strongly expressing cytotoxic T-lymphocyte antigen (CTLA)-4 were high. The frequency of CD8+ T cells strongly expressing programmed cell death 1 was the highest in patients with HBV-related HCC. Among these immune cell profiles, the frequencies of C-X-C motif chemokine receptor 3+ eTregs and CTLA-4+CD8+ T cells were inversely correlated with the strength of the TAA-specific T-cell immune response, and the restoration of TAA-specific T-cell responses by anti-CTLA-4 antibody was observed. Conclusion: The immune response to TAA were markedly different among the three groups, and a correlation with the immune cell profile was observed, suggesting that development of immunotherapy based on the etiology of HCC may lead to more effective treatment outcomes.
Abbreviations
-
- AFP
-
- alpha-fetoprotein
-
- CCR
-
- C-C chemokine receptor
-
- CD
-
- cluster of differentiation
-
- CMV
-
- cytomegalovirus
-
- CTL
-
- cytotoxic T lymphocyte
-
- CTLA-4
-
- cytotoxic T-lymphocyte antigen-4
-
- CXCR
-
- C-X-C motif chemokine receptor
-
- ELISPOT
-
- enzyme-linked immunospot
-
- eTreg
-
- effector Treg
-
- FACS
-
- fluorescence-activated cell sorter/sorting
-
- FoxP3
-
- forkhead box P3
-
- GPC3
-
- glypican 3
-
- HBsAg
-
- hepatitis B surface antigen
-
- HBV
-
- hepatitis B virus
-
- HCC
-
- hepatocellular carcinoma
-
- HCV
-
- hepatitis C virus
-
- HIV env
-
- human immunodeficiency virus envelope
-
- HLA
-
- human histocompatibility leukocyte antigen
-
- Hsp
-
- heat shock protein
-
- IFN
-
- interferon
-
- IMP-3
-
- insulin-like growth factor-II mRNA binding protein 3
-
- MDSC
-
- myeloid-derived suppressor cell
-
- MRP
-
- multidrug resistance protein
-
- NASH
-
- nonalcoholic steatohepatitis
-
- NY-ESO-1
-
- New York esophageal squamous cell carcinoma 1
-
- PBMC
-
- peripheral blood mononuclear cell
-
- PD-1
-
- programmed cell death-1
-
- PD-L1
-
- PD-1 ligand
-
- RPMI-1640
-
- Roswell Park Memorial Institute 1640 medium
-
- SART
-
- squamous cell carcinoma antigen recognized by CTLs
-
- SCCA
-
- squamous cell carcinoma antigen
-
- TAA
-
- tumor-associated antigen
-
- Treg
-
- regulatory T cell
Hepatocellular carcinoma (HCC) is the sixth most frequent cancer type with the second highest mortality among cancer deaths.1 Established treatments for HCC include liver transplantation, surgical resection, radiofrequency ablation, vascular catheterization, and chemotherapy with sorafenib; but the recurrence rate is high even if treated in the early stage, and the survival rate of patients with advanced cancer is poor even with treatment.2, 3
Immunotherapy has recently been developed as a new cancer treatment method, including for treatment of HCC.4 Tumor-associated antigens (TAAs) expressed in HCC and their T-cell epitopes have been identified over the last 10-15 years, demonstrating the occurrence of T-cell immune responses against HCC.5-9 In studies in which the frequency of TAA-specific T cells was analyzed in patients with HCC using the enzyme-linked immunospot (ELISPOT) assay, including our previous studies, the frequency of TAA-derived, epitope-specific cytotoxic T lymphocytes (CTLs) in peripheral blood mononuclear cells (PBMCs) was low in patients with HCC, and the weak response may be insufficient when compared with responses against virus-derived exogenous antigens.
Several mechanisms have been proposed for this insufficient exertion of antitumor immunity against HCC. The presence of cells controlling negative immune responses, represented by regulatory T cells (Tregs) and myeloid-derived suppressor cells (MDSCs), and their mechanisms in HCC were recently clarified.10, 11 Tregs are immunosuppressor cells, and their functions are well understood. These cells increase in PBMCs along with tumor-infiltrating lymphocytes in patients with HCC and are involved in tumor advancement. MDSCs induce forkhead box P3 (FoxP3) and interleukin-10 in cluster of differentiation 4–positive (CD4+) T cells through arginase activity and inhibit the T-cell function by inducing Tregs. Human MDSCs are a heterogeneous population, mainly divided into granulocytic CD14− and monocytic CD14+ subtypes. A recent study reported that CD14+ human histocompatibility leukocyte antigen (HLA)–DR−/low MDSCs increase in peripheral blood in patients with HCC,11 but the details regarding the association between these immunosuppressor cells and the insufficient immune response of antigen-specific T cells and its mechanism remain unclear.
Many cases of HCC are caused by chronic hepatitis or hepatic cirrhosis induced by hepatitis B virus (HBV) and hepatitis C virus (HCV) infections, but an increase in the incidence of HCC associated with nonalcoholic steatohepatitis (NASH) and metabolic syndrome has recently been reported.12, 13 In NASH, apoptosis of CD4+ T cells in the liver is induced by fatty acids accumulated in hepatocytes, thereby reducing the cell number.14 As these metabolic disorders may directly cause abnormalities in host immune responses, the host antitumor immune response and efficacy of immunotherapy may be different from those in patients with HBV-related and HCV-related HCC.
In this study, we analyzed the immune response of TAA-specific CTLs in patients with HCC and the profile of peripheral blood immune cells, including Tregs and MDSCs, separated by cause of HCC to clarify their immunological characteristics.
Materials and Methods
Patient Population
Subjects were 92 patients with HCC (68 male and 24 female patients, mean age 64.7 ± 11.0 years) treated at the Department of Gastroenterology of Kanazawa University Hospital. Patients were classified into the following three groups: hepatitis B surface antigen (HBsAg)–positive, anti-HCV antibody–negative (HBV-related HCC group comprising 32 patients); HBsAg-negative, anti-HCV antibody–positive and HCV RNA–positive (HCV-related HCC group comprising 42 patients); and HBsAg-negative and anti-HCV antibody–negative patients diagnosed with NASH by liver biopsy (NASH-related HCC group comprising 18 patients). In addition, 12 HBsAg-negative and anti-HCV antibody–negative subjects with no past medical history of malignant tumor and liver disease were analyzed as a control group.
All subjects were examined by imaging (dynamic computed tomography or magnetic resonance imaging), and HCC was diagnosed when typical intense staining was observed in the early phase and then washed out in the late phase of contrast-enhanced imaging, in addition to intense staining of the tumor.
All patients gave written informed consent to participate in the study in accordance with the Helsinki declaration. This study was approved by the regional ethics committee (Medical Ethics Committee of Kanazawa University, no. 829).
Laboratory And Virological Testing
HBsAg, anti-HCV antibody, and HCV RNA were measured in sera of the patients using commercial immunoassays (Fuji Rebio, Tokyo, Japan). HLA typing of patients and healthy subjects was performed using PBMCs and the PCR–reverse-sequence-specific oligonucleotide method. The serum alpha-fetoprotein (AFP) level was measured using enzyme immunoassays (AxSYM AFP; Abbott, Tokyo, Japan).
The severity of liver disease was diagnosed by liver biopsy following the classification established by Desmet et al.15
Synthetic Peptides And PBMC Preparation
Peptides of HLA-A24-restricted CTL epitopes with amino acid sequences derived from the previously reported 16 TAAs were synthesized (Table 1).9, 16-30
| Peptide No. | Peptide Name | Source | Reference | Amino Acid Sequence |
|---|---|---|---|---|
| 1 | Cyp-B109 | Cyp-B | 16 | KFHRVIKDF |
| 2 | SART2899 | SART2 | 17 | SYTRLFLIL |
| 3 | SART3109 | SART3 | 18 | VYDYNCHVDL |
| 4 | p53161 | p53 | 19 | AIYKQSQHM |
| 5 | MRP3765 | MRP3 | 20 | VYSDADIFL |
| 6 | AFP403 | AFP | 9 | KYIQESQAL |
| 7 | hTERT461 | hTERT | 21 | VYGFVRACL |
| 8 | survivin2B80 | survivin2B | 22 | AYACNTSTL |
| 9 | WT1235 | WT1 | 23 | CYTWNQMNL |
| 10 | EpCAM173 | EpCAM | 24 | RYQLDPKFI |
| 11 | EZH2291 | EZH2 | 25 | KYDCFLHPF |
| 12 | GPC3298 | GPC3 | 26 | EYILSLEEL |
| 13 | NY-ESO-1158 | NY-ESO-1 | 30 | LLMWITQCF |
| 14 | SCCA112 | SCCA | 27 | TYLFLQEYL |
| 15 | IMP-3508 | IMP-3 | 28 | KTVNELQNL |
| 16 | Hsp70136 | Hsp70 | 29 | GYPVTNAVI |
| 17 | HIV env584 | HIV env | 9 | RYLRDQQLL |
| 18 | CMV pp65328 | CMV pp65 | 31 | QYDPVAALF |
- Abbreviations: Cyp-B, cytochrome P450B; EpCAM, epithelial cell adhesion molecule; EZH2, enhancer of zeste homolog 2; hTERT, human telomerase reverse transcriptase; WT1, Wilms tumor 1.
In addition, peptides with amino acid sequences of previously reported HLA-A24-restricted cytomegalovirus (CMV) pp65-derived and human immunodeficiency virus envelope (HIV env)-derived CTL epitopes were synthesized as control peptides.9, 31 They were identified using mass spectrometry, and their purities were determined to be >80% by analytical high-performance liquid chromatography.
PBMCs were isolated from 50 mL of peripheral blood as described.9 PBMCs were resuspended in Roswell Park Memorial Institute 1640 medium (RPMI-1640) containing 80% fetal bovine serum and 10% dimethylsulfoxide (Sigma, St. Louis, MO) and cryopreserved until use.
ELISPOT Assay
A 96-well plate was coated with antihuman interferon (IFN)-γ antibody at 4°C overnight and washed 4 times with sterile phosphate-buffered saline (PBS). The plate was blocked with 5% fetal calf serum (FCS)–containing RPMI-1640 at 25°C for 2 hours, and 3 × 10⁵ PBMCs were added together with 10 μg/mL of peptide per well containing RPMI-1640 with 5% FCS. Two wells were used for each peptide in the assay. After 24 hours, the plate was washed 8 times, and 100 μL of biotin-conjugated antihuman IFN-γ antibody (Mabtech, Nacka, Sweden) was added and reacted overnight. After washing 4 times, streptavidin-alkaline phosphatase (Mabtech) was added, and the plate was incubated for 2 hours. Finally, the plate was washed 4 times with PBS, and newly prepared nitro blue tetrazolium chloride/5-bromo-4-chloro-3-indolyl phosphate solution (BioRad, Hercules, CA) was added for color development. The reaction was stopped by washing with distilled water, the plate was dried at room temperature, and spots were counted using an ELISPOT reader (Zeiss, Tokyo, Japan). The number of specific spots was calculated by subtracting the number of spots in wells to which no peptide was added from the number in wells to which the peptide was added. Regarding judgment of the reaction against the peptide on ELISPOT assay, when 10 or more specific spots were present in the peptide-added wells and the number was 2 times or more of that in the non-peptide-added wells, the immune reaction on ELISPOT assay of IFN-γ was judged as positive. For positive controls on the IFN-γ ELISPOT assay, 10 ng/mL of phorbol 12-myristate 13-acetate (Sigma) and HLA-A24-restricted CMV pp65-derived peptide were used. In the ELISPOT assay with blocking cytotoxic T-lymphocyte antigen-4 (CTLA-4) and C-X-C motif chemokine receptor (CXCR3), anti-CTLA (eBioscience, Tokyo, Japan) and anti-CXCR3 (Abcam, Tokyo, Japan) were added at final concentrations of 10 µg/mL and 2.5 µg/mL, respectively. As a control, a functional-grade mouse immunoglobulin G2a isotype control was used.
Analysis of Peripheral Immune Cell Profiles
For the analysis of peripheral immune cell profiles, PBMCs were isolated from 51 randomly selected patients (17 patients with HBV-related HCC, 17 patients with HCV-related HCC, and 17 patients with NASH-related HCC). We examined the expression of CD25, CTLA-4, C-C chemokine receptor 4 (CCR4), CXCR3, CCR6, and CD80 on T cells based on our previous data showing that the expression levels of these molecules in the liver differed among HBV, HCV, and NASH patients (Supporting Table S1). In addition, we analyzed the expression of 4-1BB, OX40, and programmed cell death-1 (PD-1), which have been associated with T-cell dysfunction and Treg infiltration into cirrhotic or tumor tissues and shown to be good targets for restoration of T-cell function.32-34 To determine the frequency of immune cells, multicolor fluorescence-activated cell sorting (FACS) analysis was performed using the following antibodies: anti-CD3, CD4, CD8, CD14, CD15, CD25, CD80, CD45RA, HLA-DR, FoxP3, CTLA-4, PD-1, PD-1 ligand (PD-L1), CCR4, CCR6, CXCR3, 4-1BB, and OX40 (Becton Dickinson). Flow cytometry was carried out using the Becton Dickinson FACSAria II system. We confirmed the reported inhibitory function of separated Tregs and MDSCs on PBMCs.11, 35 The methods of GeneChip analysis, fatty acid extraction, measurement of serum fatty acids, and measurement of immune cell profiles in PBMCs incubated with palmitic acid are described in the Supporting Information.
Statistical Analysis
Data are expressed as the mean ± SD. Fisher’s exact test (two-sided P value) and the unpaired Student t test were used to analyze the clinical factors in the patients with HCC. Linear regression lines for the correlation between the strength of peptide-specific T-cell responses, the expression levels of TAAs, and the frequencies of several immune cells were calculated using Pearson’s correlation coefficient. A level of P < 0.05 was considered significant.
Results
Patient Profile
The clinical background factors of the HBV-related, HCV-related, and NASH-related patients with HCC analyzed in this study are shown in Table 2. The sex ratio was not significantly different among the three groups, but the age was significantly lower in the HBV-related HCC group than the other two groups. No significant difference was noted in serum alanine aminotransferase or AFP levels, Child-Pugh class, tumor diameter, tumor multiplicity, presence or absence of vascular invasion, or tumor stage among the three groups.
| Etiology | HBV-Related HCC | HCV-Related HCC | NASH-Related HCC | P |
|---|---|---|---|---|
| No. of patients | 32 | 42 | 18 | |
| Sex (M/F) | 26/6 | 31/11 | 11/7 | NS |
| Age (years) | 58 (37-78) | 70.5 (54-83) | 67 (41-88) | 0.0007 |
| ALT (IU/L) | 41 | 44.5 | 30.5 | NS |
| AFP (ng/mL) | 12 | 16.5 | 3.5 | NS |
| Child-Pugh (A/B/C) | 27/4/1 | 30/11/1 | 10/6/2 | NS |
| Tumor diameter (cm) | 3.2 | 2.3 | 2.2 | NS |
| Tumor multiplicity (solitary/multiple) | 18/14 | 22/20 | 8/10 | NS |
| Vascular invasion (–/+) | 20/12 | 32/10 | 12/6 | NS |
| TNM stage (I/II/III/IVa/IVb) | 7/8/6/7/4 | 7/18/11/4/2 | 3/6/5/1/3 | NS |
- Abbreviations: ALT, alanine aminotransferase; NS, not significant; TNM, tumor–node–metastasis.
Detection of TAA-Specific T Cells in Patients With Hcc
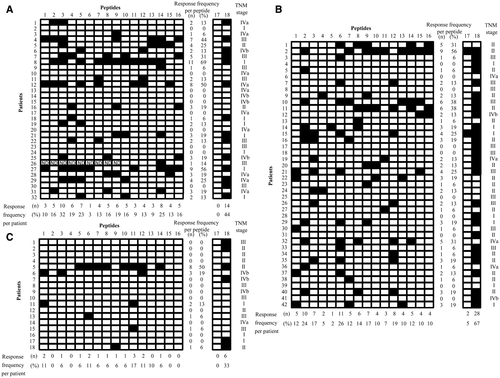
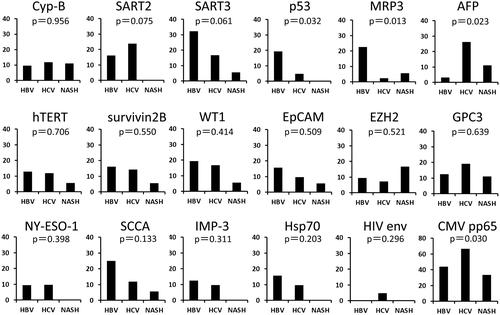
IFN-γ production by TAA-specific T cells was measured in the HBV-related, HCV-related, and NASH-related HCC groups using ELISPOT assays (Fig. 1). In the HBV-related HCC group, the immune response was positive for at least one TAA-derived peptide in 22 (68.8%) of the 32 patients (Fig. 1A). A positive reaction was detected in 32/42 (76.2%) (Fig. 1B) and 6/18 (33.3%) (Fig. 1C) in the HCV-related and NASH-related HCC groups, respectively, demonstrating that the frequency of positive patients was lower in the NASH-related HCC group. The rate of positive response to each peptide was different among the groups, and the positive rates against p53-derived, multidrug resistance protein 3 (MRP3)–derived, and AFP-derived peptides were significantly different among the three groups (Fig. 2). The absence of positive reactions in all patients was not noted for any of the peptides in the HBV-related and HCV-related HCC groups, but no immune response to squamous cell carcinoma antigen (SCCA) recognized by CTLs 2 (SART2)–derived, p53-derived, New York esophageal squamous cell carcinoma 1 (NY-ESO-1)–derived, insulin-like growth factor-II mRNA binding protein 3 (IMP-3)–derived, and heat shock protein 70 (Hsp70)–derived peptides was observed in the NASH-related HCC group (Fig. 1C). On analysis by peptide, the immune responses to SART3-derived, p53-derived, MRP3-derived, and SCCA–derived peptides were detected at a high frequency in the patients with HBV-related HCC, whereas the immune responses to SART2-derived, AFP-derived, and glypican 3 (GPC3)–derived peptides were detected at a high frequency in the patients with HCV-related HCC. In the patients with NASH-related HCC, the immune response was not readily induced.
Expression of TAAs In HCC Tissue
To examine the possibility that the difference in the immune response among the groups was due to the type or amount of antigen expressed in HCC tissue, antigen expression levels were measured using real-time PCR in patients from whom cancer tissue could be collected by surgical resection or tumor biopsy. The immune response was significantly different for three antigens (p53, MRP3, and AFP; Fig. 2), but no significant difference was noted in the expression level of any of the 16 TAA mRNAs, including these three antigens, among the three groups (Supporting Fig. S1). To examine the expression of each TAA at the protein level, we performed immunohistochemical staining using the remaining tumor tissues obtained by surgical resection in 10, 7, and 3 patients with HCC and HBV infection, HCV infection, and NASH, respectively. Expression of all TAAs except survivin2B and SCCA was confirmed, and the expression levels were not different among HBV-related, HCV-related, and NASH-related HCC tissues (Supporting Fig. S2).
Comparison of TAA-Specific T-Cell Responses and the Expression of TAAs
Immune responses to p53 and MRP3 were detected at a high frequency in the HBV-related HCC group, and responses to AFP were detected at a high frequency in the HCV-related HCC group. The correlation between the number of spots against the peptide and antigen expression level was examined in 19 patients with HCC infected with HBV or HCV, but none was found for any of these antigens (Supporting Fig. S3).
Immune Cell Profiles in Peripheral Blood
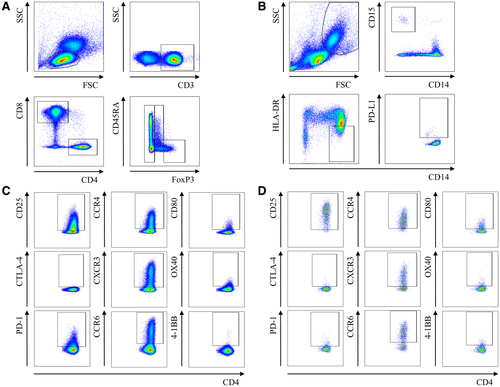
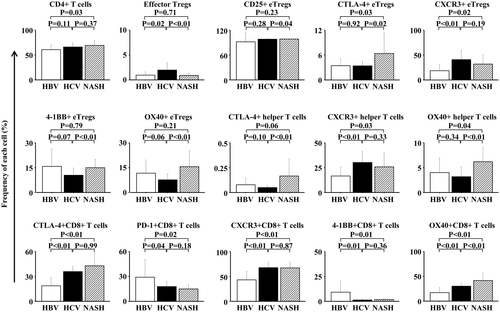
The peripheral blood immune cell profile was investigated in 17 randomly extracted patients from each of the HBV-related, HCV-related, and NASH-related HCC groups (Table 3). The clinical background of these patients was not different from that of the original patient population. CD8+ T cells and CD4+ T cells were isolated, and the CD4+ T cells were further separated into CD45RA− effector Tregs (eTregs) strongly expressing FoxP3 or FoxP3−CD4+ cells (defined as helper T cells), as reported (Fig. 3A).35 Peripheral blood MDSCs were separated into CD14+HLA-DR− or low MDSCs and CD14−CD15+ MDSCs based on the CD14, CD15, and HLA-DR expression levels; their frequencies were measured; and the PD-L1 expression level was measured in each fraction (Fig. 3B). In addition, the CD25, CTLA-4, PD-1, CCR4, CXCR3, CCR6, CD80, OX40, and 4-1BB expression levels were measured in each T-cell fraction (Fig. 3C,D). The profiles of these peripheral blood immune cells, which were significantly different among the HBV-related, HCV-related, and NASH-related HCC groups, are shown in Fig. 4. Of the peripheral blood immune cells investigated, the frequency of CD4+ T cells was higher in the NASH-related HCC group than in the HBV-related HCC group. The frequency of eTregs was higher in the HCV-related HCC than the other two groups, and the CD25, CTLA-4, CXCR3, 4-1BB, and OX40 expression levels in eTregs were significantly different among the three groups. Although no significant difference was observed in the frequency of peripheral blood helper T cells, the expression levels of the cell surface markers CTLA-4, CXCR3, and OX40 were significantly different among the three groups. In particular, the CTLA-4 and OX40 expression levels were higher in the NASH-related HCC group than in the other two groups. In CD8+ T cells, the CTLA-4, PD-1, CXCR3, 4-1BB, and OX40 expression levels were significantly different among the three groups. The PD-1 and 4-1BB expression levels were the highest and the CXCR3 expression level the lowest in the HBV-related HCC group, and the OX40 expression level was the highest in the NASH-related HCC group. To examine what biological phenomena may be at play, we examined the association between serum fatty acids and immune cell profiles. In this analysis, we found that the frequencies of CTLA-4+ and OX40+CD8+ T cells were positively correlated with the serum palmitic acid to palmitoleic acid ratio (Supporting Fig. S4). Furthermore, palmitic acid affected the frequencies of CTLA-4+ and OX40+CD8+ T cells in vitro (Supporting Fig. S5).
| Etiology | HBV-Related HCC | HCV-Related HCC | NASH-Related HCC | P |
|---|---|---|---|---|
| No. of Patients | 17 | 17 | 17 | |
| Sex (M/F) | 13/4 | 13/4 | 11/6 | NS |
| Age (years) | 53 (37-78) | 69 (54-83) | 65 (41-85) | 0.007 |
| ALT (IU/L) | 41 | 41 | 31 | NS |
| AFP (ng/mL) | 10 | 15 | 5 | NS |
| Child-Pugh (A/B/C) | 13/3/1 | 10/6/1 | 9/6/2 | NS |
| Tumor diameter (cm) | 3.6 | 3.0 | 2.2 | NS |
| Tumor multiplicity (solitary/multiple) | 9/8 | 9/8 | 7/10 | NS |
| Vascular invasion (–/+) | 11/6 | 14/3 | 11/6 | NS |
| TNM stage (I/II/III/IVa/IVb) | 4/0/4/5/4 | 3/7/5/1/1 | 2/6/5/1/3 | NS |
- Abbreviations: ALT, alanine aminotransferase; NS, not significant; TNM, tumor–node–metastasis.
Comparison of TAA-Specific T-Cell Responses and Immune Cell Profiles
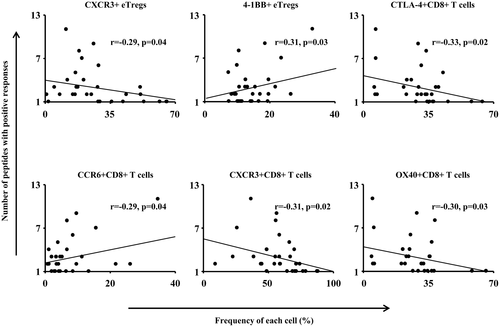
We then examined TAA-specific T-cell immune responses and peripheral blood immune cell profiles in the HBV-related, HCV-related, and NASH-related HCC groups, i.e., the frequencies of CD4+ T cells, CD8+ T cells, Tregs, and MDSCs and the correlation with these cell surface marker expression levels. The peripheral blood immune cell profiles, which were significantly different among the three groups, were evaluated; and their correlation with the number of TAA-derived peptides for which a positive reaction was detected on the ELISPOT assay was analyzed. Significant correlations were detected in the following cells: CXCR3+ eTregs, CTLA-4+CD8+ T cells, CXCR3+CD8+ T cells, and OX40+CD8+ T cells were inversely correlated with the TAA-specific immune response, whereas 4-1BB+ eTregs and CCR6+CD8+ T cells were positively correlated (Fig. 5).
These results suggest that inhibition of these cells or the molecules expressed on the cell surface can restore the TAA-specific T-cell responses. To test this hypothesis, we performed IFN-γ ELISPOT assays using PBMCs newly obtained from 18 patients with HCC that were incubated with anti-CXCR3 or anti-CTLA-4 antibodies. In these ELISPOT assays, anti-CTLA-4, but not anti-CXCR3, antibodies were able to restore the frequency of IFN-γ-producing TAA-specific T cells in 5 out of 18 patients (Supporting Fig. S6A). However, such restoration of T cells against CMV-derived peptide (peptide 18) was not observed. In addition, the expression level of CTLA-4 on CD8+ T cells in patients with restoration of TAA-specific T-cell responses by anti-CTLA-4 antibodies was higher than that in patients without restoration (Supporting Fig. S6B).
Discussion
The host TAA-specific immune response and peripheral blood immune cell profile were analyzed by cause of HCC. It has been reported that DNA-methylated genes in cancer tissue and the proteins expressed on proteome analysis are different between viral infection–induced HCC and HCC associated with metabolic disorders, represented by NASH,36, 37 demonstrating that the carcinogenesis process is different between viral infection–associated and NASH-associated HCC. This suggests that the influences on the protein expression levels, including TAAs, and the host immune system are different. The host immune response to the TAAs differed among the HBV-related, HCV-related, and NASH-related HCC groups, as expected. Specifically, immune responses to p53 and MRP3 were observed at a high frequency in the HBV-related HCC group, and response to AFP was observed at a high frequency in the HCV-related HCC group. In the NASH-related HCC group, the immune response to at least one TAA was detected in only 6 (33.3%) of the 18 patients, and this frequency was lower than that (22/32, 68.8%) in the HBV-related HCC group and that (32/42, 76.2%) in the HCV-related HCC group, suggesting low immunogenicity of NASH-related HCC.
Thus, we clarified the TAA expression levels in the HBV-related, HCV-related, and NASH-related HCC groups. As the frequencies of the immune responses to p53, MRP3, and AFP differed among the three groups, their expression levels in cancer tissue were quantitated using real-time PCR and immunological staining. However, no significant difference was found among the three groups (Supporting Figs. S1 and S2), suggesting that the antigen expression level is not involved in the difference in frequency of the immune response to the TAAs. Therefore, this difference in the frequency among the three groups may have been due to certain antigen-specific, immune response–suppressive mechanisms or dysfunction of antigen-specific T cells.
To clarify these mechanisms, we analyzed the peripheral blood immune cell profile in the HBV-related, HCV-related, and NASH-related HCC groups. The analysis was focused on CD4+ T cells, CD8+ T cells, Tregs, and MDSCs among peripheral blood immune cells. As the correlation between Tregs exhibiting immunosuppressive effects and diseases was recently found by classifying CD4+ cells into eTregs and naive Tregs based on FoxP3 and CD45RA,35 we performed the analysis focusing on eTregs. On comparison among the three groups, the frequency of CD4+ T cells was increased in the NASH-related HCC group and that of eTregs was increased in the HCV-related HCC group. No significant difference was noted in the frequency of the subtype CD8+ T cells or MDSCs, among the three groups. Regarding the limitations of this study, the peripheral blood immune cell profile was not analyzed in HCV-infected, HBV-infected, or NASH patients without HCC; therefore, the possibility of influencing factors from background diseases cannot be ruled out. However, the frequency of CD4+ T helper 17 cells has been reported to increase in patients with NASH compared with healthy subjects or patients with simple fatty liver38; and as fatty acids in hepatocytes induce apoptosis in CD4+ T cells in liver tissue,14 the results of our study were considered to sufficiently reflect the immunological pathologies of background disease in patients with HCC. Tregs have been reported to increase in patients with HCC. Although eTregs were not closely examined in previous studies, their frequency was higher in the HCV-related HCC group than in the other two groups, suggesting that HCV infection directly increased eTregs.
On investigation of the surface expression in each cell population, the frequencies of eTregs, CD4+ helper T cells strongly expressing CTLA-4, and CD4+ helper T cells strongly expressing OX40 were high in the NASH-related HCC group. On analysis of CD8+ T cells, the frequencies of cells strongly expressing CTLA-4 and OX40 were high in the NASH-related HCC group. To examine what biological phenomena may be at play, we examined the association between serum fatty acids and immune cell profiles. In this analysis, we found that the frequencies of CTLA-4+ and OX40+CD8+ T cells were positively correlated with the serum palmitic acid to palmitoleic acid ratio (Supporting Fig. S4). Furthermore, palmitic acid affected the frequencies of CTLA-4+ and OX40+CD8+ T cells in vitro (Supporting Fig. S5). In addition, our previous study demonstrated that the C16:1n7 (palmitoleic acid)/C16:0 (palmitic acid) ratio increased in accordance with the progression of lobular inflammation and fibrosis in NASH patients.39 These results suggest that some serum fatty acids affect the immune cell profile and T-cell function in patients with NASH.
The frequency of cells strongly expressing PD-1 was the highest in the HBV-related HCC group and the lowest in the NASH-related HCC group. Therefore, the immune cell profile was markedly different among patients with HCC depending on the background liver disease.
We then examined the influence of these differences in the immune cell profile on the immune response of TAA-specific T cells. The frequencies of CXCR3+ eTregs, CTLA-4+CD8+ T cells, CXCR3+CD8+ T cells, and OX40+CD8+ T cells were inversely correlated with the strength of the TAA-specific T-cell immune response, whereas the frequencies of 4-1BB+ eTregs and CCR6+CD8+ T cells were positively correlated with the response. In contrast, no correlation was observed between the frequencies of CD4+ helper T cells, each subtype of MDSCs, or PD-L1 expression level in MDSCs and the strength of the TAA-specific T-cell immune response. This suggested that the phenotypes of eTregs and CD8+ T cells are correlated with the reaction of peripheral blood TAA-specific T cells, compared with MDSCs, in patients with HCC. In NASH-related HCC in particular, the frequency of CTLA-4+CD8+ T cells was high, which may have caused the weak immune response by TAA-specific T cells. The restoration of TAA-specific T-cell responses (Supporting Fig. S6) supports this phenomenon. The results of the present study suggest that anti-CTLA-4 antibodies may improve the effects of immunotherapy in some patients with HCC who have an immune cell profile with high frequency of CTLA-4+CD8+ T cells.
The incidence of viral infection–associated HCC may decrease in the future with progress in antiviral therapy against HCV and HBV. However, the incidence of HCC associated with metabolic disorders, such as NASH and diabetes, may increase. Previous immunotherapy may have been insufficient for metabolic disorder–associated HCC because it was developed based on studies on virus-associated HCC and the molecular-biological or immunological properties of metabolic disorder–associated HCC are different. No difference in the objective rate of response to HCC treatment with an anti-PD-1 antibody, nivolumab, among the HCC etiologies was reported; but the number of analyzed patients was small.40 The results of analysis involving a large number of patients are awaited.
In our previous study on the frequency of TAA-specific T cells compared among many TAA-derived epitopes in patients with HCC using IFN-γ ELISPOT assays, the frequency of TAA-derived epitope-specific CTLs was 10-60.5 cells/300,000 PBMCs in patients with HCC,41 suggesting that the frequency of TAA-derived, epitope-specific T cells in PBMCs is not high in patients with HCC and that their response is weaker than the host immune response to virus-derived exogenous antigens, which is insufficient to remove the tumor. Knowledge on the relationship between the immune cell profile based on HCC etiology and TAA-specific T-cell response may be useful to develop treatments to enhance the T-cell response to tumors.
In conclusion, we clarified the characteristics of TAA-specific T-cell responses by HCC etiology and examined the immune cell profiles influencing the immune response. Development of complex immunotherapies based on the immune cell profile of individual patients with HCC may be important for treatment of HCC in the future.
Potential conflict of interest
Nothing to report.


