TCPOBOP-Induced Hepatomegaly and Hepatocyte Proliferation are Attenuated by Combined Disruption of MET and EGFR Signaling
Potential conflict of interest: Nothing to report.
Abstract
TCPOBOP (1,4-Bis [2-(3,5-Dichloropyridyloxy)] benzene) is a constitutive androstane receptor (CAR) agonist that induces robust hepatocyte proliferation and hepatomegaly without any liver injury or tissue loss. TCPOBOP-induced direct hyperplasia has been considered to be CAR-dependent with no evidence of involvement of cytokines or growth factor signaling. Receptor tyrosine kinases (RTKs), MET and epidermal growth factor receptor (EGFR), are known to play a critical role in liver regeneration after partial hepatectomy, but their role in TCPOBOP-induced direct hyperplasia, not yet explored, is investigated in the current study. Disruption of the RTK-mediated signaling was achieved using MET knockout (KO) mice along with Canertinib treatment for EGFR inhibition. Combined elimination of MET and EGFR signaling [MET KO + EGFR inhibitor (EGFRi)], but not individual disruption, dramatically reduced TCPOBOP-induced hepatomegaly and hepatocyte proliferation. TCPOBOP-driven CAR activation was not altered in [MET KO + EGFRi] mice, as measured by nuclear CAR translocation and analysis of typical CAR target genes. However, TCPOBOP-induced cell cycle activation was impaired in [MET KO + EGFRi] mice due to defective induction of cyclins, which regulate cell cycle initiation and progression. TCPOBOP-driven induction of FOXM1, a key transcriptional regulator of cell cycle progression during TCPOBOP-mediated hepatocyte proliferation, was greatly attenuated in [MET KO + EGFRi] mice. Interestingly, TCPOBOP treatment caused transient decline in hepatocyte nuclear factor 4 alpha expression concomitant to proliferative response; this was not seen in [MET KO + EGFRi] mice. Transcriptomic profiling revealed the vast majority (~40%) of TCPOBOP-dependent genes primarily related to proliferative response, but not to drug metabolism, were differentially expressed in [MET KO + EGFRi] mice. Conclusion: Taken together, combined disruption of EGFR and MET signaling lead to dramatic impairment of TCPOBOP-induced proliferative response without altering CAR activation.
Abbreviations
-
- CAR
-
- constitutive androstane receptor
-
- cdk1
-
- cyclin-dependent kinase
-
- EGFR
-
- epidermal growth factor receptor
-
- EGFRi
-
- EGFR inhibitor (Canertinib)
-
- FOXM1
-
- forkhead box protein M1
-
- HGF
-
- hepatocyte growth factor
-
- HNF4α
-
- hepatocyte nuclear factor 4 alpha
-
- IPA
-
- ingenuity pathway analysis
-
- KO
-
- knockout
-
- LW/BW
-
- liver weight to body weight ratio
-
- PHx
-
- partial hepatectomy
-
- Rb
-
- retinoblastoma
-
- RTK
-
- receptor tyrosine kinase
-
- TCPOBOP
-
- 1,4-Bis [2-(3,5-Dichloropyridyloxy)] benzene
-
- YAP
-
- Yes associated protein
Liver has an extraordinary capacity to regenerate upon tissue loss. Liver regeneration can occur as a compensatory response to toxin-induced liver injury, surgical resection, or infection.1 Interestingly, many xenobiotics, retinoic acids, and thyroid hormone can stimulate hepatocyte proliferation and cause liver enlargement in the absence of liver injury/tissue loss through activation of nuclear receptors belonging to the steroid/thyroid superfamily (such as constitutive androstane receptor [CAR], peroxisome proliferator-activated receptor-α, retinoic acid receptor [RAR], and thyroid hormone receptor).2 TCPOBOP (1,4-Bis [2-(3,5-Dichloropyridyloxy)] benzene) is a CAR agonist that induces robust hepatocyte proliferation and hepatomegaly after acute administration and is one of the strongest known chemical mitogens to mouse liver.3 TCPOBOP directly binds to CAR, leading to its nuclear translocation and activation of its target genes. TCPOBOP-induced proliferative response is very rapid and comparable to proliferative response after 2/3 partial hepatectomy (PHx).4 The regenerative response induced by treatment with TCPOBOP can protect liver from failure even after massive tissue loss (91% hepatectomy), indicating great clinical potential.5 However, signaling mechanisms of cell proliferation induced by TCPOBOP or any other nuclear receptor agonists have not been extensively explored.
MET and epidermal growth factor receptor (EGFR) are receptor tyrosine kinases (RTKs) and play an important role in liver pathobiological processes including development, proliferation, and hepatocellular cancer. Ligands for EGFR (such as EGF and transforming growth factor alpha, and MET (hepatocyte growth factor [HGF]) are the only known direct mitogens for liver that can cause hepatocyte proliferation in vitro (in chemically defined serum-free media) and in vivo.1 Our recent study demonstrated that combined elimination of MET and EGFR signaling results in complete inhibition of liver regeneration after PHx.6 No other study has previously shown complete abolition of liver regeneration in any model after inhibition of any extracellular signaling pathways (either alone or in combination), highlighting that availability of combined MET and EGFR signaling pathways is indispensable for liver regeneration.
A previous study using CAR-knockout (KO) mice have shown that TCPOBOP-induced hyperplasia is completely dependent on CAR.7 However, proliferative signaling pathways underlying this CAR-initiated response are not well characterized. The mechanisms underlying TCPOBOP-induced direct hyperplasia are considered to be unrelated to classical regenerative pathways, with studies showing no role of cytokines such as IL-6 and TNF-α.4, 8-12 Recent studies have indicated an emerging role of various signaling mediators in this context such as β-catenin, Hippo signaling/Yes-associated protein (YAP), c-myc, forkhead box protein M1 (FOXM1), and mir-122.13-17 However, the role of RTKs (specifically MET and EGFR) is not yet explored. Considering the indispensable role of MET and EGFR for liver regeneration, we hypothesized that these receptors are also important for TCPOBOP-induced hepatocyte proliferation and hepatomegaly. Here we report that combined MET KO and EGFR inhibition results in dramatic attenuation of TCPOBOP-induced proliferative response in liver without altering CAR activation. No previous studies, to our knowledge, have shown such a remarkable effect on TCPOBOP-induced proliferative response by altering any mediator other than its direct interacting nuclear receptor, CAR. Our study changes the paradigm that nuclear receptor agonist–mediated direct hyperplasia is unrelated to signaling of liver regeneration.
Materials and Methods
Animals, Treatments and Tissue Harvesting
METfl/fl: Tam-Cre+/+ mice with a targeted deletion for exon 16 were generated and characterized as described previously.6 These mice were injected intraperitoneally for 5 consecutive days with tamoxifen (100 μL of a 10 mg/mL solution in corn oil) to obtain MET KO mice. The control group consisted of littermates injected with vehicle (corn oil) only. A single dose of TCPOBOP (3 mg/kg, prepared in corn oil) was administered by oral gavage at least 5 days after the last tamoxifen injection. For EGFR inhibition, Canertinib, an EGFR inhibitor (EGFRi), was administered to mice in diet at 80 mg/kg/day as described previously.6 Canertinib is a very potent and highly selective irreversible EGFRi, and has been used previously to effectively inhibit EGFR signaling in liver.6, 18, 19 Canertinib diet was initiated 1 day prior to TCPOBOP injection. For combined inhibition of MET and EGFR [MET KO + EGFRi], Canertinib diet was administered to MET KO mice at least 4 days after tamoxifen injection. Combined MET KO + EGFR inhibition strategy was previously used by our group to successfully block both RTK signaling in the PHx model.6 For initial studies, mice from control, EGFRi, MET KO, and [MET KO + EGFRi] groups (n = 6-8) were sacrificed at 2 days (48 hours) after TCPOBOP administration (experimental design shown in Fig. 1A). For time-course analysis, mice from control and [MET KO + EGFRi] group (n = 6-10) were euthanized at various time points (0, 1, 2, 5, and 10 days) after TCPOBOP administration (experimental design shown in Fig. 2A).
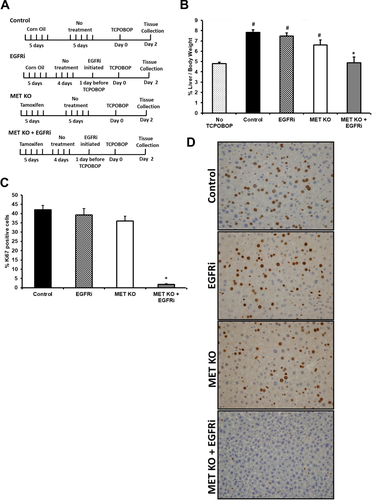
 ). All liver samples were collected from various groups of mice (control: vehicle-treated wild type; EGFRi: Canertinib-treated (80 mg/kg/day) wild type; MET KO; and [MET KO + EGFRi]: Canertinib-treated MET KO) at 48 hours after TCPOBOP treatment. No TCPOBOP group in (B) was similar to control group except without TCPOBOP treatment. #,*Significant difference with respect to no TCPOBOP and control group, respectively, at P < 0.05.
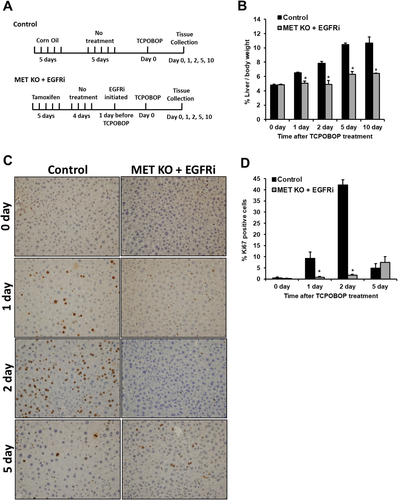
 ). (D) Percentage of hepatocytes in DNA synthesis (Ki67 positive nuclei). All samples were collected from control and Canertinib-treated MET KO mice [MET KO + EGFRi] at various time points after TCPOBOP treatment. *Significant difference with respect to control group at a particular time point; P < 0.05.
Other method details are provided in the Supporting Information.
Results
TCPOBOP-Induced Hepatomegaly and Hepatocyte Proliferation Remarkably Attenuated after Combined MET KO and EGFR Inhibition
MET KO mice or EGFRi mice were administered TCPOBOP. Because these RTKs are known to compensate for each other,6, 20 MET KO mice were treated with EGFR inhibitor [MET KO + EGFRi] for combined disruption of MET and EGFR signaling. Female mice were used in all of these studies unless specified, as TCPOBOP-induced proliferative response is known to be higher in females.21 Liver weight to body weight ratio (LW/BW) and hepatocyte proliferation were analyzed at 48 hours after TCPOBOP treatment (Fig. 1A-D). As expected, TCPOBOP-treated control mice showed remarkable (1.6-fold versus no TCPOBOP control) increase in LW/BW ratio at 48 hours (Fig. 1B). EGFRi mice had a similar increase and MET KO displayed a slightly lower increase, but not significantly different compared with control. Strikingly, [MET KO + EGFRi] mice did not show any increase in LW/BW ratio (1.008-fold versus no TCPOBOP control) (Fig. 1B). Robust hepatocyte proliferation was observed in control, EGFRi, and MET KO groups with no significant difference among these groups. However, proliferation was completely abolished in [MET KO + EGFRi] mice with almost no observable Ki67 positive cells (Fig. 1C,D). No effect of tamoxifen was observed on TCPOBOP-induced hepatocyte proliferation or hepatomegaly in METfl/fl: Tam-Cre-/- mice (Supporting Fig. S1A-C).
Because a major difference was observed only in [MET KO + EGFRi] mice, this group was analyzed further. A time-course analysis (0-10 days after TCPOBOP treatment) was performed in these mice, comparing to control mice (Fig. 2A-D). At day 0 (prior to TCPOBOP treatment), the LW/BW ratio was similar in [MET KO + EGFRi] and control mice, indicating that the basal liver size is not altered. The LW/BW ratio increased consistently with time in the control group and was about 2.2-fold higher at day 5 versus day 0 (Fig. 2B). [MET KO + EGFRi] mice did not show any increase in LW/BW ratio at day 1 and day 2 but displayed a slight increase at day 5 (1.3 fold). The LW/BW ratios in both groups at day 10 remain similar to respective day 5 values, indicating plateauing of hepatomegaly response. The LW/BW ratio remained significantly lower in [MET KO + EGFRi] mice compared with control mice at all of the analyzed time points after TCPOBOP treatment (1, 2, 5, and 10 days) (Fig. 2B). Similarly, hepatocyte proliferation increased in control mice with time, peaking at day 2 and decreasing sharply at day 5 (Fig. 2C,D). In contrast, proliferation was significantly lower in [MET KO + EGFRi] mice at day 1 and day 2, with no obvious Ki67 positive cells; some Ki67 positive cells were observed only at day 5 (Fig. 2C,D). Similar protein expression profile was also observed for proliferating cell nuclear antigeph, another marker for proliferation (Fig. 4A). All of these experiments were also repeated in male mice with similar findings (Supporting Fig. S2A-C).
CAR Activation after TCPOBOP Treatment Remained Unaffected by Combined MET KO and EGFR Inhibition
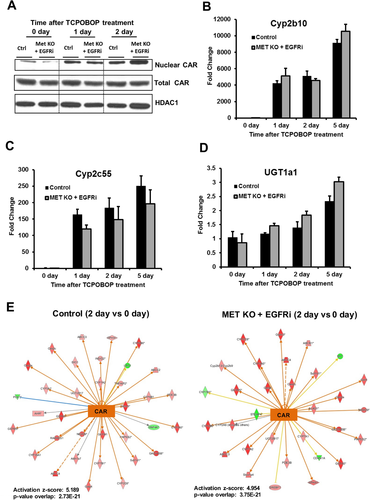
TCPOBOP-induced hepatocyte proliferation is known to be a CAR-dependent process; therefore, the activation status of CAR was analyzed.7 Following TCPOBOP-binding, CAR translocates to nucleus and activates its target genes. Total CAR levels were not altered in [MET KO + EGFRi] mice (Fig. 3A). Nuclear CAR levels remarkably increased at day 1 and day 2 after TCPOBOP treatment in both control and [MET KO + EGFRi] mice compared with day 0 (Fig. 3A). Further, induction of classical CAR target genes (Cyp2b10, Cyp2c55, and UGT1a1) was comparable in both control and [MET KO + EGFRi] mice after TCPOBOP treatment (Fig. 3B-D). Notably, Cyp2b10 was induced more than 4000-fold at all of the time points in both groups (Fig. 3B). Next, microarray analysis was performed on samples from control and [MET KO + EGFRi] groups at various time points (0, 1, 2, and 5 days) and data were analyzed using ingenuity pathway analysis (IPA) to look at global picture of CAR target genes. Overall, CAR target genes were induced similarly in both the groups at day 2, as evidenced by a comparable z-score for CAR activation in both groups (Fig. 3E). High order of P value (approximately 2-3  10-21) of overlap between CAR target genes induced in both the experimental groups versus CAR target genes in the reference genome demonstrates robust activation of CAR in both the groups (Fig. 3E). In fact, CAR turned out to be the topmost transcription factor predicted to be activated at all of the time points (days 1, 2, and 5) in both groups compared with basal levels (day 0) based on upstream regulator analysis using IPA (Supporting Fig. S4B; CAR is represented as NR1I3). All of these data clearly demonstrate that despite defective proliferative response, CAR activation remained unaltered in [MET KO + EGFRi] mice after TCPOBOP treatment.
Impaired Cell Cycle Activation in [MET KO + EGFRi] Mice
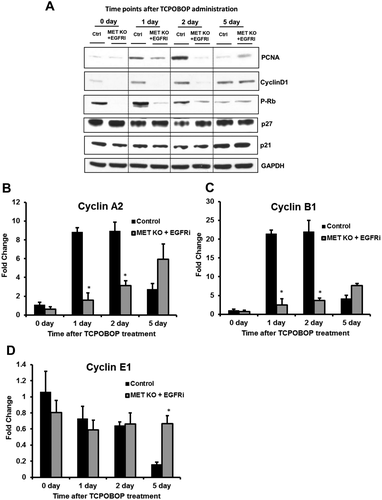
At downstream level, both MET and EGFR are known to activate core cell cycle machinery and induce cyclins including cyclin D1, which controls entry into the cell cycle. To further elucidate the mechanisms for attenuated proliferative response in [MET KO + EGFRi] mice, status of core cell cycle machinery was assessed. Cyclin D1 protein expression increased at all of the time points (1, 2, and 5 days) after TCPOBOP treatment in control mice compared with basal levels (day 0) (Fig. 4A). Cyclin D1 did not increase at all in [MET KO + EGFRi] mice at days 1 and 2 and was remarkably lower compared with control group, increasing only at day 5 (Fig. 4A). Cyclin D1 binds to cyclin-dependent kinase 4, triggering its activation, which then phosphorylates retinoblastoma (Rb) protein, ultimately resulting in induction of several cell cycle genes. Phosphorylation of Rb protein increased in the control group at day 1 compared with day 0 and gradually decreased later on. However, phosphorylation of Rb protein remained very low at all of the time points (including day 5) in [MET KO + EGFRi] mice (Fig. 4A). Next, we investigated the gene expression of cyclin E1, cyclin A2, and cyclin B1 (Fig. 4B-D), which sequentially regulate progression through cell cycle. Apart from cyclin E1, which appeared not to be induced after TCPOBOP treatment, both of the other later-stage cyclins (cyclin A2 and cyclin B1) were induced after TCPOBOP treatment in the control group and were significantly lower at days 1 and 2 in [MET KO + EGFRi] mice (Fig. 4B-D). Additionally, the protein levels of major cell cycle inhibitory proteins (p21 and p27) were measured (Fig. 4A). The p21 levels were similar between the two groups across the time course but induced in both groups at day 5. The p27 levels moderately decreased at the time point of peak proliferation (day 2) in control mice and returned to basal levels at day 5. However, p27 expression remained constant in [MET KO + EGFRi] mice across the time course and appeared to be higher compared with control mice at day 2 (Fig. 4A).
Downregulation of FOXM1 Transcription Factor and its Downstream Gene Network in [MET KO + EGFRi] Mice
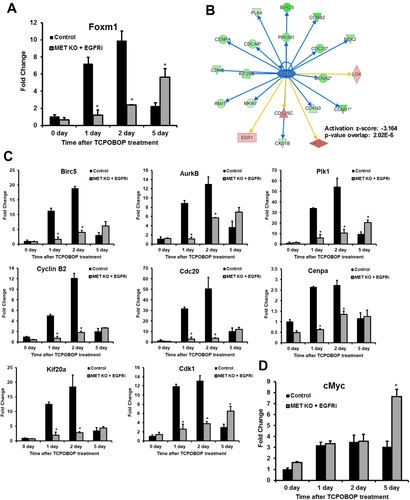
We also studied various signaling pathways downstream of MET and EGFR involved in hepatocyte proliferation. There was no apparent alteration of extracellular signal-regulated kinase, protein kinase B, and mammalian target of rapamycin activation that could be consistent with decreased proliferation in [MET KO + EGFRi] mice (Supporting Fig. S3A). β-catenin signaling is another pathway regulated by MET and reported to be involved in TCPOBOP-induced proliferation13, 17, 22 that was not altered in our model (Supporting Fig. S3B). Our previous data and several other reports indicated that both MET and EGFR can regulate an important transcription factor, FOXM1, which governs transcription of genes important for DNA replication and mitosis.6, 23-27 FOXM1 is considered to be critical for inducing TCPOBOP-mediated hepatocyte proliferation.3, 5, 14, 16, 22, 28 Consistent with these previous reports, FOXM1 was remarkably induced by TCPOBOP at all of the time points in control mice with peak induction (10-fold) coinciding with the time point of peak proliferation (day 2) (Fig. 5A). Interestingly, there was a significant delay in FOXM1 induction in [MET KO + EGFRi] mice. FOXM1 induction was significantly attenuated in [MET KO + EGFRi] at day 1 and day 2 but was higher at day 5 compared with control (Fig. 5A). IPA analysis of microarray data further substantiated downregulation of FOXM1 in [MET KO + EGFRi] mice compared with control; several FOXM1-inducible genes that were upregulated in control mice were greatly downregulated in [MET KO + EGFRi] mice at day 2 (Fig. 5B and Supporting Table S1). In fact, FOXM1 was among the top transcription factors predicted to be inhibited (activation z-score:  3.164) in [MET KO + EGFRi] mice compared with control based on upstream regulator analysis using IPA (Figs. 5B and 7D). Further, downregulation of FOXM1 was confirmed by investigating the expression of several FOXM1 target genes (Birc5/survivin, aurora B Kinase, polo-like kinase 1, cyclin B2, Cdc20, Cenpa, Kif20a, and cyclin-dependent kinase [cdk1]) using real-time PCR; all of these genes were significantly downregulated at day 1 and day 2 in [MET KO + EGFRi] mice (Fig. 5C). Previous studies indicated c-myc as an important transcriptional regulator for induction of FOXM1 during TCPOBOP-mediated proliferation.16 C-myc is also a known downstream effector of both MET and EGFR. Although c-myc expression was increased at RNA and protein level after TCPOBOP treatment in both groups, c-myc expression was not lower in the [MET KO + EGFRi] group (Fig. 5D and Supporting Fig. S3A).
Effect on Hepatocyte Nuclear Factor 4 α Expression after Combined MET KO and EGFR Inhibition
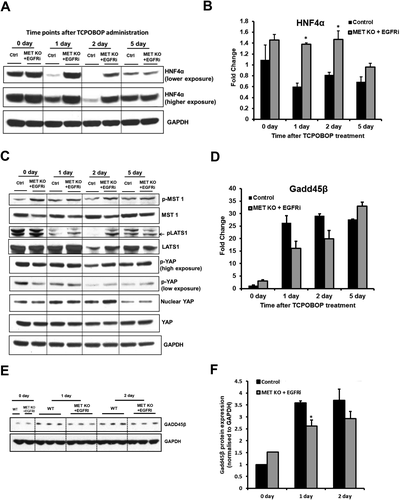
Transcription factor, hepatocyte nuclear factor 4 alpha (HNF4α), is important for maintaining differentiated state and inhibiting proliferation in quiescent liver.29-32 Several studies indicate crosstalk between CAR and HNF4α involving direct competition.14, 33-35 Here we report that HFN4α protein expression decreases dramatically after TCPOBOP treatment in control mice (Fig. 6A). HNF4α expression was lowest at day 2 after TCPOBOP treatment in control mice, coinciding with the time point of peak proliferation, and increased later on at day 5 (Fig. 6A). In contrast, HNF4α expression was maintained in [MET KO + EGFRi] mice after TCPOBOP treatment and was strikingly higher compared with control mice at day 1 and day 2 (Fig. 6A). Similar changes were also observed at the transcriptional level; HNF4α mRNA levels were significantly higher at day 1 and day 2 in [MET KO + EGFRi] mice compared with control mice (Fig. 6B). However, these changes were not as striking as observed at the protein level.
Effect on Hippo Signaling Pathway after Combined MET KO and EGFR Inhibition
Organ size, including that of liver, is known to be tightly controlled by the transcriptional regulator YAP. Overexpression of YAP in a normal mouse liver results in hepatocyte proliferation and hepatomegaly.36 Recent studies also indicate a role of YAP in controlling TCPOBOP-induced hepatocytes proliferation.15 Hippo signaling pathway mediators (MST1/2 and LATS1/2) negatively regulate nuclear YAP levels (through its phosphorylation leading to degradation), which were studied in our model (Fig. 6C). Activated phospho-MST1 and phospho-LATS1 were higher in [MET KO + EGFRi] mice compared with control mice at day 2, along with slightly higher phospho-YAP levels at the same time (Fig. 6C). However, these changes were not reflected at nuclear YAP levels, as nuclear YAP was not decreased in [MET KO + EGFRi] mice compared with control (Fig. 6C). Nuclear YAP levels increased at day 1 and day 2 compared with day 0 both in control and [MET KO + EGFRi] mice. Total YAP levels were not altered at any time point (Fig. 6C). Overall, these data suggest that the inhibitory effect of combined MET KO + EGFR inhibition on TCPOBOP-induced proliferative response is not mediated by Hippo pathway and YAP.
Gadd45β is another transcription factor that is reported to control liver size after TCPOBOP treatment and also known to be induced after PHx.37 Gadd45β KO mice show marked growth delay without reduced proliferation after TCPOBOP treatment.37 Further, our previous study showed that Gadd45β gene expression is altered remarkably after combined MET KO and EGFR inhibition in PHx model (lower induction during peak regenerative phase and increased induction during termination compared with wild-type mice).6 Therefore, Gadd45β expression was analyzed in our model (Fig. 6D-F). Gadd45β gene expression was notably upregulated after TCPOBOP treatment in control mice (compared with basal levels). Gadd45β induction appears to be lower in [MET KO + EGFRi] mice compared with control at day 1 and day 2 but did not attain statistical significance (Fig. 6D). Gadd45β protein expression displayed a similar pattern with moderate but significant downregulation in [MET KO + EGFRi] mice compared with control at day 1 (Fig. 6E,F). Analysis of microarray data using IPA revealed Gadd45β signaling as one of the top canonical pathway predicted to be altered in [MET KO + EGFRi] mice compared with control (Fig. 7C and Supporting Fig. S5A).
Global Changes in Gene Expression Profile after Combined MET KO and EGFR Inhibition
Next, we investigated changes in global gene expression profile using microarray. Both intragroup (temporal) and intergroup analyses were performed using IPA. Based on gene signature analysis, SREBF1, SREBF2, and SREBF cleavage-activating proteins were among some of the top upstream regulators that were predicted to be inhibited consistently at all of the time points (except day 5) in the [MET KO + EGFRi] group compared with control (Supporting Fig. S4A). SREBF1 has previously reported as a cotranscriptional regulator affecting CAR-driven transcriptional activity.38 Similar alteration was observed in some of the canonical signaling pathways related to cholesterol biosynthesis and LXR/RXR activation in [MET KO + EGFRi] mice compared with control mice (Supporting Fig. S5A). Temporal analysis revealed, as mentioned previously, CAR (NR1I3) as the topmost upstream regulator predicted to be activated in both groups at all of the time points compared with basal levels (Supporting Fig. S4B). However, several upstream regulators were predicted to be altered only in [MET KO + EGFRi] mice (but not in control mice) consistently at all of the time points after TCPOBOP treatment compared with basal levels (Supporting Fig. S4B). One such transcription factor was TRIM24 (transcriptional intermediary factor 1 alpha), which was predicted to be activated only in [MET KO + EGFRi] mice (Supporting Fig. S4B). A recent study demonstrated TRIM24 to directly interact with CAR as a coregulator at the DNA binding site and alter its transcriptional activity.39 TRIM24 is also a known corepressor of RARs and inhibits proliferation in hepatocytes.40
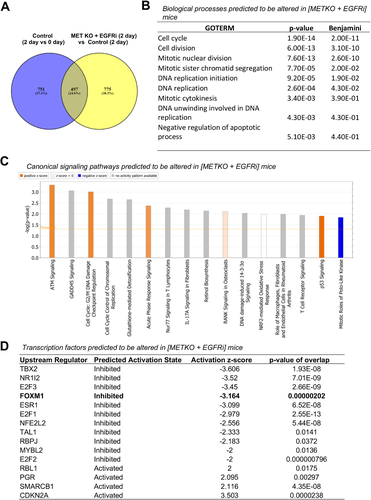
To filter out genes that are relevant to TCPOBOP treatment, we specifically looked at genes that were altered (upregulated/downregulated at least 2-fold) after TCPOBOP treatment compared with basal levels in control mice and were, at the same time, also differentially altered (at least 2-fold) in [MET KO + EGFRi] mice compared with control mice. Interestingly, of the 1248 genes that were altered by TCPOBOP treatment at day 2 compared with day 0, approximately 40% (497 genes) were differentially expressed in [MET KO + EGFRi] mice compared with control mice at day 2 (Fig. 7A). This demonstrates a significant genome-wide effect of combined MET KO and EGFR inhibition on the TCPOBOP response. These mostly included genes that were induced by TCPOBOP and downregulated in [MET KO + EGFRi] mice (249 genes; top 50 listed in Supporting Table S2), along with genes that were repressed by TCPOBOP but upregulated in [MET KO + EGFRi] mice compared with controls (224 genes; top 50 listed in Supporting Table S3). Analysis of the specific genes that were induced by TCPOBOP and downregulated in [MET KO + EGFRi] mice using DAVID (Fig. 7B) revealed that these genes were significantly enriched for biological processes primarily related to cell proliferation, such as cell cycle (specific genes pertaining to this gene ontology term are listed in Supporting Table S4), cell division, mitotic nuclear division, mitotic sister chromatid segregation, and DNA replication. Analysis of all 497 genes (shown as overlap in Fig. 7A) using IPA, taking directionality of change into account, predicted several canonical pathways to be significantly altered in [MET KO + EGFRi] mice versus control mice, including activation of ATM signaling, G2/M DNA damage checkpoint regulation, acute phase signaling, p53 signaling, and inhibition of signaling related to the mitotic role of polo-like kinase (Fig. 7C). Further, based on downstream gene signatures, IPA predicted alteration of several transcriptional factors relevant to cell proliferation (Fig. 7D), including significant inhibition of E2F1, E2F2, E2F3, and FOXM1 and activation of cyclin-dependent kinase inhibitor 2A or p16 in [MET KO + EGFRi] mice. TBX2 and NR1I2 (PXR) were the top two transcription factors predicted to be inhibited in [MET KO + EGFRi] mice (Fig. 7D). Whereas, TBX2 is known to promote cell proliferation and tumorigenesis in several organ systems,41 PXR is reported to potentiate TCPOBOP/CAR-mediated hepatocyte proliferation.42
Discussion
Signaling through MET and EGFR is considered critical for regenerative response in liver with HGF (ligand for MET) and EGFR ligands, as the only known direct mitogens for hepatocytes.1 Numerous previous studies in the PHx model of liver regeneration show that inhibition/elimination of any single extracellular signaling mediator can only delay regenerative response but cannot permanently abolish liver regeneration due to induction of compensatory pathways.1 However, our previous work demonstrated that combined inhibition of MET and EGFR results in complete inhibition of liver regeneration after PHx.6 Here, we report that combined MET KO and EGFR inhibition results in dramatic attenuation of hepatocyte proliferation and hepatomegaly induced by the CAR agonist, TCPOBOP. No previous studies, to our knowledge, have shown such a remarkable effect on TCPOBOP-induced proliferative response by altering any mediator other than its direct interacting nuclear receptor, CAR. Several previous studies have suggested that the proliferative response of TCPOBOP was dependent on CAR and not sharing or depending on signaling pathways operative during liver regeneration after PHx.4, 8-12 Our current findings in this study change this paradigm. The data presented in this study demonstrate that although CAR activation alone can trigger all responses related to activation of drug metabolism, hepatomegaly is dependent on pathways that are controlled by MET and EGFR, requiring cooperative signaling of the two RTKs in order for CAR to exert its effects on hepatocyte proliferation. These results, along with our previous data in the PHx model,6 indicate that combined functioning of EGFR and MET is quintessential for inciting any proliferative response in hepatocytes and may be very critical for maintaining proliferative environment in liver. This is not surprising considering that quiescent liver is constantly exposed to “tonic” effects of both HGF (embedded in hepatic extracellular matrix in high amounts) and EGF (constantly available through portal circulation from Brunner’s glands of the duodenum).1 Thus, both of these growth factors and their receptors constantly affect the protein interactome of quiescent liver. It is of interest, however, that each one of the two RTKs was sufficient to allow TCPOBOP proliferative response, indicating that EGFR and MET can compensate for each other in this process as reported previously in the PHx model.6, 20
One of the most interesting findings of this study was that neither CAR nuclear translocation nor induction of its classical targets (drug metabolic enzymes such as Cyp2b10) were affected in [MET KO + EGFRi] mice, despite remarkable effects on proliferative genes and hepatocyte proliferation. This differential effect suggests that TCPOBOP-driven detoxification and proliferative response, although dependent on initial CAR activation, require diverse co-transcriptional regulators or downstream mediators. Similar differential response has been reported previously, in which repeated administration of TCPOBOP did not result in further increase of hepatocyte proliferation and liver size, but the classic CAR target gene involved in drug metabolism (Cyp2b10) was remarkably upregulated.15 This differential attenuation of proliferation was attributed to decrease in YAP activity, which appeared not to be altered in our model. An inverse effect was observed in female β-catenin KO and Gadd45β KO mice, which displayed a lower level of drug metabolic enzymes but increased proliferative response to TCPOBOP treatment.22, 37
FOXM1 is one of the major transcription factors that regulates cell cycle at multiple levels including progression to S-phase and mitosis. It regulates transcription of cyclins (such as cyclin B1), Cdc25 phosphatases (that activate cyclin-dependent kinases), several mitotic regulators (such as polo like kinase 1, aurora B kinase, and survivin), and negatively regulates the expression of cell cycle inhibitors such as p27. FOXM1 is considered a critical mediator of TCBOBOP-induced proliferative response.3, 5, 14, 16, 22, 28 FOXM1 was reported to be required for improved regenerative response triggered by TCPOBOP treatment in an extensive liver resection (86%) model and also important for maintaining TCPOBOP-induced proliferative response in aged mice.5, 28 Our previous microarray data and various other studies indicated that both EGFR and MET can regulate FOXM1 expression.6, 23-27 Here we report that TCPOBOP-driven FOXM1 induction and its downstream gene network activation was remarkably impaired in [MET KO + EGFRi] mice, which might contribute to attenuated proliferation in our model. Conversely, the inverse phenotype to our model (i.e., increased proliferation but reduced expression of drug metabolic enzymes) previously reported in β-catenin KO mice following TCPOBOP treatment was attributed to increased FOXM1 levels.22
Another important transcription factor that was differentially altered in our model was HNF4α. Sharp decline in HNF4α expression was associated with robust proliferative response following TCPOBOP treatment in control mice. This decline was not observed in [MET KO + EGFRi] mice, which might also contribute to proliferative defect in these mice. This is supported by the fact that liver-specific HNF4α KO mice show hyper-proliferative liver phenotype with hepatomegaly similar to TCPOBOP treatment.29-31 Further, apart from its role in liver differentiation, HNF4α is known to negatively regulate a myriad of proliferative genes in liver.29-32 Several studies have demonstrated crosstalk between CAR and HNF4α, showing competition for the same DR1 DNA binding sites and cotranscription factors and regulation of genes in opposite direction.14, 33-35 The role of HNF4α in CAR-induced proliferation is also supported by a recent study demonstrating that activated CAR after TCPOBOP treatment can displace HNF4α from Pri-miR-122 binding site, suppressing expression of miR-122, which was associated with proliferative response through the c-myc/FOXM1 axis.14
It was impressive to see that 40% of the genes altered by TCPOBOP treatment in control mice were differentially regulated in [MET KO + EGFRi] mice. These genes were mostly enriched for biological processes regulating various aspects of cell proliferation including DNA replication, mitotic nuclear division, mitotic cytokinesis, and checkpoint regulation. This demonstrates an enormous global impact of combined MET KO + EGFR inhibition on TCPOBOP-induced proliferative response in mice. Several canonical signaling pathways and transcription factors activity (some of them are known cotranscriptional regulators of CAR) were also predicted to be altered in [MET KO + EGFRi] mice, which was relevant to impaired proliferative response. Overall, TCPOBOP-induced proliferative response involves complex cybernetics of several signaling mediators, not merely CAR activation, and combined elimination of MET and EGFR signaling appears to disrupt this proliferative gene expression algorithm and protein interactome, without having a major impact on CAR target genes associated with drug metabolism (Fig. 8).
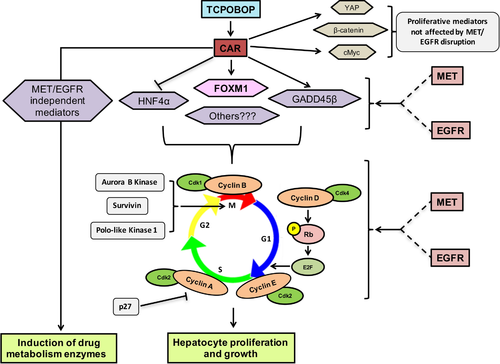
In conclusion, our study revealed that combined disruption of signaling through receptor tyrosine kinases MET and EGFR results in remarkable attenuation of TCPOBOP-induced hepatocyte proliferation and hepatomegaly, without altering CAR activation. Our results support the hypothesis that these RTKs are quintessential for maintaining proliferative responses in liver not only after tissue loss but also in augmentative hepatomegaly induced by chemical mitogens.


