New insights into diagnosis and therapeutic options for proliferative hepatoblastoma
Potential conflict of interest: Nothing to report.
Supported by grants from the French National Cancer Institute (INCa_TRANSLA_2013_209, to T.E., C.F.G., and M.-A.B.), the Fondation pour la Recherche Médicale (DBI20131228566, to J.A., T.C., A.-A.R., and C.F.G.), the l'Etat Français in the framework of the “Investments for the future” Programme IdEx Bordeaux (ANR-10-IDEX-03-02, to K.B.H.), the Ligue Nationale Contre le Cancer (Programme Labellisation Equipe, EL2015.LNCC/JML), and the charity associations Eva pour la Vie, Aidons Marina, and E.S.C.A.P.E. (to the miRCaDe team).
Abstract
Surgery and cisplatin-based treatment of hepatoblastoma (HB) currently guarantee the survival of 70%-80% of patients. However, some important challenges remain in diagnosing high-risk tumors and identifying relevant targetable pathways offering new therapeutic avenues. Previously, two molecular subclasses of HB tumors have been described, C1 and C2, with C2 being the subgroup with the poorest prognosis, a more advanced tumor stage, and the worst overall survival rate. An associated 16-gene signature to discriminate the two tumoral subgroups was proposed, but it has not been transferred into clinical routine. To address these issues, we performed RNA sequencing of 25 tumors and matched normal liver samples from patients. The transcript profiling separated HB into three distinct subgroups named C1, C2A, and C2B, identifiable by a concise four-gene signature: hydroxysteroid 17-beta dehydrogenase 6, integrin alpha 6, topoisomerase 2-alpha, and vimentin, with topoisomerase 2-alpha being characteristic for the proliferative C2A tumors. Differential expression of these genes was confirmed by quantitative RT-PCR on an expanded cohort and by immunohistochemistry. We also revealed significant overexpression of genes involved in the Fanconi anemia (FA) pathway in the C2A subgroup. We then investigated the ability of several described FA inhibitors to block growth of HB cells in vitro and in vivo. We demonstrated that bortezomib, a Food and Drug Administration–approved proteasome inhibitor, strongly impairs the proliferation and survival of HB cell lines in vitro, blocks FA pathway–associated double-strand DNA repair, and significantly impedes HB growth in vivo. Conclusion: The highly proliferating C2A subtype is characterized by topoisomerase 2-alpha gene up-regulation and FA pathway activation, and the HB therapeutic arsenal could include bortezomib for the treatment of patients with the most aggressive tumors. (Hepatology 2018;68:89-102).
Abbreviations
-
- BRCA
-
- breast cancer (gene)
-
- EC50
-
- median effect concentration
-
- FA
-
- Fanconi anemia
-
- FANCI
-
- Fanconi anemia I
-
- FANCD2
-
- Fanconi anemia D2
-
- GSEA
-
- gene set enrichment analysis
-
- HB
-
- hepatoblastoma
-
- HSD17B6
-
- hydroxysteroid 17-beta dehydrogenase 6
-
- ITGA6
-
- integrin alpha 6
-
- NT
-
- nontumoral
-
- RNA-seq
-
- RNA sequencing
-
- SIOPEL
-
- International Childhood Liver Tumor Strategy Group
-
- TOP2A
-
- topoisomerase 2-alpha
-
- VIM
-
- vimentin
Hepatoblastoma (HB) is the most common liver cancer in children. When possible, a complete surgical resection is the mainstay of curative therapy. Cisplatin-based chemotherapy has improved the resectability and contributed to an increase in the 5-year survival rate to >70% of diagnosed patients.1 However, management of cisplatin's side effects as well as an effective treatment of patients with high-risk forms of HB remain challenging.1, 2 In 2000, the International Childhood Liver Tumor Strategy Group (SIOPEL) introduced the PRETEXT staging system.3 Additional criteria were created to describe metastatic spread outside of the liver.4, 5 More recently, an international consortium including SIOPEL presented the Children's Hepatic Tumors International Collaboration–Hepatoblastoma Stratification, which is an updated staging that incorporates PRETEXT and its annotation factors, dividing patients into very low-risk, low-risk, intermediate-risk, and high-risk groups.2 SIOPEL currently recommends progressively more intensive treatment with cisplatin depending on the risk evaluated by the staging schemes. However, those stratifications do not yet take into account the underlying molecular deregulations.
The initial hurdle faced by clinicians in HB management is to easily and confidently diagnose tumors as being of high risk. Alpha-fetoprotein is the most robust biomarker currently employed to diagnose HB. Its persistent or recurring elevation is a sensitive marker of progressive disease, whereas very low alpha-fetoprotein levels are associated with anaplastic histology and poor outcome.6 Elevated expression of β-catenin, cyclin D1, and Ki-67 is indicative of poor prognosis; but they are employed only occasionally to support intervention with more aggressive treatments.7 Very few molecular profiling studies have been performed to elucidate the molecular mechanisms underlying HB development and progression and to identify potential chemotherapeutic targets associated with risk level and tumor subtype. Through transcript profiling, Cairo et al.8 proposed two distinct HB subtypes, a standard-risk C1 and a more aggressive and immature C2, that can be distinguished by a 16-gene signature. The tumors with a C2 signature were shown to be associated with poor prognosis and a more advanced tumor stage (metastasis, vascular invasion). The 2-year overall survival was 44% for patients with C2 tumors against 92% for patients with C1.8 More recently, a genomic and transcriptomic study of 88 HBs proposed incorporating an intermediate subtype, thus dividing HBs into three groups with a distinct prognosis and unique molecular and clinical features.9 Both studies offered substantial insight into the genetic and transcriptional variation within HB tumors. For example, genomic studies have pointed out the crucial role of the Wnt/β-catenin signaling pathway in HB.8, 10-12 Mutations in the gene encoding β-catenin are present in approximately 80% of HBs.8, 9, 13, 14 Furthermore, there is strong evidence for crosstalk between the Wnt/β-catenin and Myc signaling pathways that promotes a more aggressive type of tumor8 and some indication that mutations in the NFE2L2, SPOP, KLHL22, TRPC4AP, and RNF169 genes, which are associated with the ubiquitinated protein degradation machinery, can cause childhood liver cancer beyond Wnt/β-catenin signaling.11, 14, 15 These studies have reinforced efforts to target the Wnt/β-catenin signaling pathway in the treatment of HB. However, it has proven difficult to inhibit β-catenin effectively.16 Therefore, there is a clinical urgency to readily identify high-risk HB and find new targetable pathways. Through transcriptional study we were able to identify a concise signature comprised of just four expression markers that are capable of classifying patients according to HB type; specifically, we identified topoisomerase 2-alpha (TOP2A) as a biomarker of highly proliferative HB. We provide evidence from the increased expression of the Fanconi anemia (FA) pathway in proliferative HB tumors and propose one of its inhibitors, bortezomib, as a complementary treatment option for high-risk patients.
Patients and Methods
PATIENT SAMPLES
All patients were recruited in accordance with European and French law and institutional ethical guidelines.17 A set of 73 liver samples (44 HB and 29 nontumoral [NT] liver including 29 pairs of tumor and adjacent NT liver) was collected from 39 patients treated at French university hospitals or from the SIOPEL Liver Tumor and Tissue Bank (www.siopel.org).
RNA-SEQUENCING ANALYSIS
Total RNA from 50 frozen patient tissues constituting the tumoral and adjacent NT tissues and two cell lines was extracted using the mirVana kit (Thermo Fisher Scientific) according to the supplier's protocol. The RNA integrity number was evaluated by the Agilent 2100 Bioanalyzer. A total of 4 μg was used for generation of each poly-A library with an Illumina TruSeq Stranded mRNA Sample Preparation kit according to standard protocol. Paired-end 125-nucleotide sequencing was performed by the MGX-Montpellier GenomiX platform on an Illumina HiSeq 2500. The quality of the sequencing was evaluated by FastQC and mapped to the human genome (GRCh38) with CRAC (version 2.5.0 with options “-k 22,” “--no-ambiguity,” and “--stranded”),18 and the biological events, including single-nucleotide polymorphisms, indels, and splice junctions, were extracted using cractools (version 1.24 and command “extract”). Reads for each gene were summarized by featureCounts19 using the annotation from Ensembl (version 82). Differential expression was performed by DESeq220 between tumoral subgroups and/or NT samples. Genes with a log2 fold-change absolute value >2 and a false discovery rate <0.05 were considered differentially expressed. Principal component analysis was performed with FactoMineR21 on the regularized logarithm20 of the 1,000 most expressed genes. Sample clustering was performed on variance stabilizing transformed counts20 by heatmap.2 R function from the gplots package, using default parameters (Euclidian distance and “complete” clustering method). Gene set enrichment analysis (GSEA) of MSigDB v5.0 set H and C2:CGP was performed with GSEA 2.1.022 using the results of RNA sequencing (RNA-seq) collapsed to gene names using the Ensembl 82 annotations. Twenty-four NT samples were contrasted with either 18 C1, four C2B, or five C2A samples (three HBs and two cell lines). The sequencing data were deposited in Gene Expression Omnibus (accession number GSE104766).
STATISTICAL ANALYSIS
Statistical analyses were performed using GraphPad Prism 6.0 software as described.17
See Supporting Information for further methods.
Results
RNA-SEQ DATA REVEAL THREE SUBGROUPS OF HB
We performed RNA-seq transcriptomic analysis of 25 paired tumor and 25 NT HB samples and HB cell lines HuH6 and HepG2. The CRAC pipeline was used for read processing and mapping, whereas DESeq2 was used for read normalization and differential gene analysis. We used the 1,000 most expressed genes to visualize sample distances by principal component analysis (Fig. 1A). All NT samples and class C1 HB formed well-defined clusters. Samples from group C2 were more dispersed and appeared to separate into two distinct clusters that we termed “C2A” and “C2B.” The transcriptome profiles of HB cell lines were very similar to that of the C2A group. An analysis of differential gene expression was conducted between groups C1 and C2, and all samples were reclustered hierarchically according to the 300 most differentially expressed genes. Clustering with this set of differentially expressed genes reproduced the apparent clustering observed for the principal component analysis and, importantly, confirmed the division of group C2 into two subgroups (Fig. 1B). However, the grouping of patients appeared to correspond only partially with clinical features such as high or standard risk, invasion, and age. Patients assigned as high risk, according to PRETEXT or the Children's Hepatic Tumors International Collaboration–Hepatoblastoma Stratification classification, were spread among the four clusters, whereas some of the C2 group HB known to have worse survival were assigned to the low-risk group in the Children's Hepatic Tumors International Collaboration–Hepatoblastoma Stratification classification. This result confirmed the relevance of associating clinical stratification and molecular analysis to increase the diagnostic efficiency of high-risk HB.
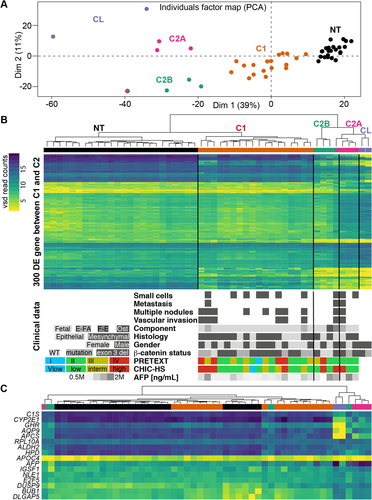
From RNA-seq results we extracted β-catenin mutation status in tumor and NT samples (Fig. 1B, bottom panel). We found that 88% of tumors were affected in β-catenin, with 32% carrying a point mutation and 56% having exon 3 deleted. These percentages are similar to those previously reported for HB in other cohorts.8, 9, 13, 14 Further comparisons with clinical data were limited due to the small number of samples. However, we observed some unusual characteristics in the C2 group: wild-type β-catenin (two of four samples) and other than fetal component (two of four samples) in C2B and high alpha-fetoprotein expression (three of three samples) and the atypical-fetal component in C2A (one of three samples).
Lastly, the expression values for the genes comprising the previously proposed 16-gene signature8 were extracted from the RNA-seq data (Fig. 1C; Supporting Fig. S1) and investigated to determine if this signature was sufficient to distinguish the various groups. This signature, which was designed initially to distinguish between HB groups C1 and C2, indeed identified the C1 and C2 samples but failed to completely separate C2A from C2B (Fig. 1C; Supporting Fig. S1). Moreover, despite being very effective, the 16-gene signature requires analytical expertise for correct interpretation. Therefore, patient stratification requires a more suitable signature, preferably with a unique biomarker for each tumoral subgroup.
A ROBUST FOUR-GENE SIGNATURE FOR MOLECULAR CLASSIFICATION OF HB
From the RNA-seq analysis, we searched for a cohort of genes that possessed the greatest potential to discriminate among the tumoral subgroups. Two important criteria we held in selecting potential candidates were a high level of RNA expression and the availability of suitable antibodies for routine detection of either altered mRNA or protein levels, respectively. This analysis yielded a set of four genes, hydroxysteroid 17-beta dehydrogenase 6 (HSD17B6), integrin alpha 6 (ITGA6), TOP2A, and vimentin (VIM) (Fig. 2A), which were determined to be sufficient to recapitulate the HB subgrouping shown in Fig. 1A. Then, to evaluate this four-gene signature on other cohorts, we reclustered samples from previously published transcriptomic data sets: E-MEXP-1851 from Cairo et al.8 and GSE75271 from Sumazin et al.9 Using expression of probes corresponding to HSD17B6, ITGA6, TOP2A, and VIM, we recapitulated the correct clustering for 78 out of 80 samples (97.5%) (Supporting Fig. S2A,B).
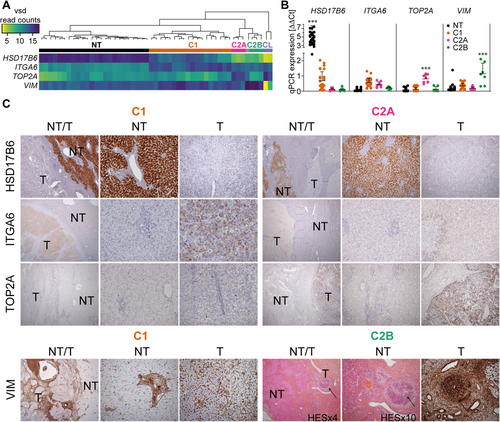
HSD17B6 is a liver-specific cytoplasmic oxidoreductase member of the retinol dehydrogenase family involved in androgen catabolism. ITGA6 is a cell-surface protein involved in cell adhesion and overexpressed in breast cancer stem cells.23 TOP2A is a well-described nuclear enzyme controlling the topologic states of DNA, and it is involved in fundamental processes such as chromosome condensation.24 VIM is a type 3 intermediate filament protein expressed in mesenchymal cells.25 Differential expression of these genes in the various HB subgroups was determined by quantitative RT-PCR on an expanded cohort of 44 HB and 34 NT samples. We saw strict correlation in differential gene expression between quantitative RT-PCR and RNA-seq results, with the HSD17B6 and TOP2A increases being particularly accurate in characterizing NT tissue and C2A HB, respectively (Fig. 2B). Lastly, we used immunohistochemistry to confirm expression of the protein products of the four genes in 13 of the samples (Fig. 2C). Because HSD17B6 is typically expressed in liver, as expected, it was detected exclusively in the cytoplasm of NT hepatocytes (Fig. 2C). ITGA6 was detected primarily at the membrane of tumoral hepatocytes and less frequently in the cytoplasm, with a stronger diffused staining in the C1 group (Fig. 2C). TOP2A was detected in all six C2A samples, where it was visible in the nucleus of 20%-30% of malignant hepatocytes. Strikingly, the protein was absent from samples from all other HB subgroups. These results, supported by the significant up-regulation of TOP2A in C2 cases analyzed in cohorts from Cairo et al.8 and Sumazin et al.9 (Supporting Fig. S2C), indicate that TOP2A is a suitable biomarker for the high-risk C2A HB subgroup (Fig. 2C). Finally, VIM protein expression was observed in all subgroups. However, only in C2B hepatocytes was it organized into visible spindle-shaped structures, whereas it was restricted to the stroma in C1 and C2A tumoral hepatocytes (Fig. 2C).
TRANSCRIPTOMIC STUDIES SHOW MOLECULAR TARGETS IN HB SUBGROUPS
In order to identify biological pathways specifically deregulated in high-risk HB, we performed a GSEA on the differential gene expression data (Fig. 3). All tumor samples displayed consistent up-regulation of notable HB genes, such as LIN28B,26 DLK1,27 the Wnt/beta-catenin pathway targets AXIN2 and LEF1, and their inhibitors NKD1 and DKK1. Genes involved in typical liver functions, including xenobiotic, lipid, and bile acid metabolism, and many long noncoding RNAs, such as antisense to KIRREL3, CALCRL, HAL, and the intergenic RP11-434D9.1 and LINC01093, were generally down-regulated in tumor samples, suggesting an important role in normal liver function. Samples from group C2B were distinguished by an up-regulated expression of TGFB1 and the transforming growth factor-β targets CTGF and JAG1. We also found higher transcript levels for SNAI2, S100A4, and VIM, which are markers of the epithelial–mesenchymal transition,28 and for the mesenchymal stem cell marker SPARC. Accordingly, high expression of VIM could indicate a mesenchymal phenotype for the C2B group.29 We also found higher transcript levels for the transcription factor RUNX230 and cadherin CDH11, which is characteristic for osteoblastic cell lines31 and suggests differentiation of mesenchymal stem cells into osteoblast-like cells. This is additionally supported by the histological data indicating the presence of osteoid foci in four out of six tested C2B samples (see Supporting Table S1).
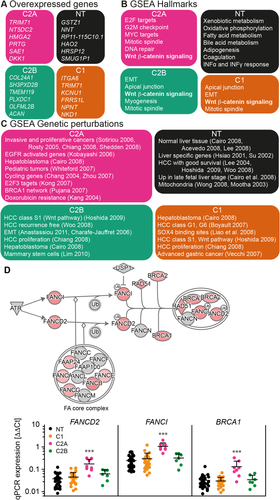
Because our aim was to find targetable pathways in high-risk HB, we chose to focus on proliferative group C2A. The transcriptomic data showed that the HuH6 and HepG2 cell lines are analogous to the C2A group, and thus, the cell lines may represent a good model to characterize novel oncogenic pathways and test new drugs against HB. In this subgroup and the two cell lines, we found a persistent higher level of transcript for genes responsible for activation of cell-cycle checkpoints, chromatid assembly, mitosis, and such transcriptional pathways as E2F and MYC, which characterize highly proliferative tumors (Fig. 3B).32 Specific analysis of Ki67 expression from RNA-seq data confirmed the proliferative feature of C2A tumors. Strong immunolabeling of Ki67 was already observed for certain C2A tumors (data not shown), and transcriptomic results revealed a similar expression profile but 3 times higher for TOP2A (Supporting Fig. S3).
Genetic permutation analysis also revealed breast cancer 1 (BRCA1) network up-regulation and doxorubicin resistance in C2A (Fig. 3C). The FA–BRCA pathway is known to coordinate double-strand DNA homologous recombination repair. It employs a nuclear protein complex (FA core complex) that ubiquitinates Fanconi anemia D2 (FANCD2) and Fanconi anemia I (FANCI), leading to the recruitment of a nuclease complex, which initiates the nucleolytic incisions and DNA repair through translesion DNA synthesis polymerases.33 Specific inherited mutations in BRCA proteins are well known to increase the risk of various types of cancer.34 We observed a significant increase in transcript levels of three key components of the FA pathway, FANCD2, FANCI, and BRCA1, in group C2A within the quantitative PCR study on the HB cohort of 78 samples mentioned above (Fig. 3D), suggesting that the FA–BRCA pathway may constitute a target in proliferative HB.
TARGETING THE FA PATHWAY WITH BORTEZOMIB IMPAIRS HB CELL VIABILITY IN VITRO AND TUMORAL GROWTH IN VIVO
There are three well-known classes of FA–BRCA pathway inhibitors, the USP1/UAF1 inhibitors GW7647, ML323, and pimozide35; the NEDD8 inhibitor MLN492436; and proteasome inhibitors such as MG132 and bortezomib.37 The effect of proteasome inhibitors on apoptosis induction and growth arrest of hepatic cell lines (including HuH6 and HepG2) have been described in vitro38-41 but never investigated and detailed in this context of an up-regulation of the FA pathway in proliferative HB. Therefore, we tested all of the above-mentioned inhibitors on HuH6 and HepG2 cell lines to determine their median effect concentration (EC50) according to a 3-(4,5-dimethylthiazol-2-yl)-5-(3-carboxymethoxyphenyl)-2-(4-sulfophenyl)-2H-tetrazolium assay as a measure of cell viability (Supporting Fig. S4A). The EC50 values of GW7647, ML323, and MLN4924 on the HB cell lines were very high (15-979 μM), making them irrelevant for clinical use in HB. Pimozide had an effect on cell viability at a lower concentration (EC50 = 2.15-2.99 μM). Very interestingly, we found that the proteasome inhibitors MG132 and bortezomib were the most efficient with very low EC50 values (7 nM and 62 nM for bortezomib in HuH6 and HepG2 cells, respectively), rending them compatible for clinical applications in HB. Then we tested the effect of each drug at its EC50 alone or in combination with cisplatin (Fig. 4; Supporting Fig. S4B). GW7647 and ML323 had no additive effect with cisplatin on cell viability, whereas pimozide had only a slight additive effect. Surprisingly, we observed a significant synergic effect of the NEDD8 inhibitor (MLN4924) in combination with cisplatin, but its high EC50 excludes it from viable treatment options. Lastly, proteasome inhibitors had a significant additive effect on HB cell viability in combination with cisplatin (Fig. 4A), also confirmed by sulforhodamine B assays (Fig. 4B). Those tests confirmed that proteasome inhibitors could be promising treatments for HB.
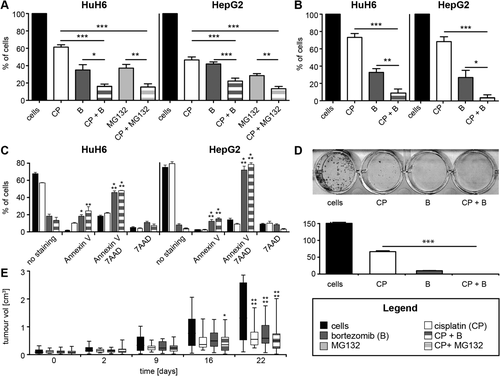
In contrast to MG132, bortezomib is a reversible proteasome inhibitor already approved for treatment of pediatric acute lymphoblastic leukemia42 under the brand Velcade. Therefore, we preferentially used bortezomib for further analyses. As expected, after 3 days of treatment, bortezomib had a dramatic effect on HB cells, inducing early (annexin V) and late (annexin V–7-amino-actinomycin D) apoptosis in HuH6 and HepG2 cells; cisplatin alone had no significant apoptotic effect, and the combination of the two drugs did not further enhance bortezomib efficacy (Fig. 4C; Supporting Fig. S5). We also tested the effect of the two drugs on the clonogenic capacity of HuH6 cells (Fig. 4D). After 10 days, 44% and 7% of clones remained alive after treatment with 9 μM cisplatin and 7 nM bortezomib, respectively; and the combination of the two drugs yielded total elimination of clones (Fig. 4D). Finally, we tested the effect of bortezomib on tumor growth in the HuH6 xenograft mice model. The first sign of a significant decrease in tumor size was observed after 16 days, exclusively for mice treated with the combination of cisplatin and bortezomib. However, by the end of the experiment at day 22, the treatments with individual drugs were found to be as effective as the combined treatment (Fig. 4E).
BORTEZOMIB INHIBITS DNA REPAIR IN HB CELLS THROUGH FA–BRCA PATHWAY INACTIVATION
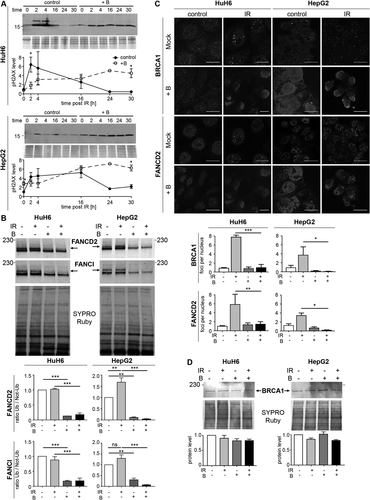
Homologous repair of double-strand DNA damage is partly coordinated by the FA–BRCA pathway, which can be inhibited by proteasome inhibitors such as bortezomib.37, 43 We therefore evaluated the effect of bortezomib on DNA repair in HB cells and more precisely on the FA pathway. Phosphorylation of S139 on H2AX is one of the earliest events following the induction of DNA damage. In order to evaluate whether bortezomib suppresses DNA repair in HB cells, DNA double-strand breaks were induced by γ-irradiation, and H2AX phosphorylation was examined. In untreated HuH6 and HepG2 cells, phospho-H2AX increased more than 6-fold and 4-fold, respectively, 2 hours after irradiation and then decreased to basal levels within 24 hours (Fig. 5A). With bortezomib pretreatment, the phospho-H2AX level steadily accumulated in both cell types in response to irradiation to levels similar to those observed for untreated cells; but this phosphorylation persisted for a further 30 hours after irradiation (Fig. 5A). FA pathway activity is regulated by the monoubiquitination of proteins FANCD2 and FANCI, which then promote recruitment of DNA damage effectors, for example, BRCA1, to nuclear foci where repair is required.37, 44 In HuH6 cells, FANCD2 and FANCI were already ubiquitinated, indicating that the FA pathway was constitutively activated in these cells (Fig. 5B). In contrast, irradiation slightly increased ubiquitination of FANCD2 and FANCI in HepG2 cells. After bortezomib treatment, the ubiquitination state of FANCD2 and FANCI was dramatically reduced in both cell lines, indicating inhibition of the FA–BRCA pathway (Fig. 5C). It was expected that inhibition of the pathway by bortezomib would attenuate the formation of repair foci in response to irradiation. HB cells treated with bortezomib prior to irradiation displayed a significant reduction in FANCD2 and BRCA1 foci after 24 hours as shown by reduced cellular immunofluorescence, whereas FANCD2 and BRCA1 protein levels remained unaffected (Fig. 5B-D; Supporting Fig. S6). Despite repeated attempts, we did not manage to detect FANCI by immunofluorescence. Altogether, these results indicate that global DNA repair capacity is severely compromised in cells treated with bortezomib due to an almost complete inactivation of the FA–BRCA signaling pathway.
Discussion
The goal of finding potentially targetable pathways for treatment of HB prompted us to exploit next-generation RNA-seq to understand better how the transcriptome is modified in tumoral tissue. The practical outcomes would entail finding new biomarkers to simplify the diagnosis of the two molecular subgroups C1 and C2 already described and identify new specific pharmacological targets for proliferative HB, based on previously uncharacterized gene expression patterns. We acquired transcript profiles from both HB cell lines and paired tumoral and NT tissue samples taken directly from patients. Our results confirmed three tumoral subgroups of HB: good prognosis C1, high-risk C2A, and intermediate-risk C2B, corresponding approximately to groups HB1, HB2, and HB3 defined by Sumazin et al.9 Similarly to our approach, Sumazin et al.9 used clustering of transcriptomic profiles to define the HB groups and were able to directly compare their results with those of Cairo et al.8 However, microarrays have a different sensitivity from RNA-seq, with less pronounced differences in gene expression among the groups, even for the LIN28B and HMGA2 genes described by Sumazin et al. to be markers of high-risk HB.9 Despite this limitation, the Sumazin et al. study allowed for comparison of survival among groups thanks to inclusion of a large cohort of 88 samples. It is worth noting that Cairo et al. were the first to report a signature distinguishing high-risk HB according to expression of 16 genes.8 However, their signature was barely used as a diagnosis tool, possibly due to the complexity of performing 16 parallel quantitative PCRs and correctly interpreting their results. Thus, we set out to identify a simpler signature, amenable also for immunohistochemistry routinely used in clinical settings.
We employed a differential gene expression analysis to identify the genes specifically deregulated in tumoral subgroups and noticed that the 16-gene signature proposed Cairo et al.8 can distinguish different groups of HB patients (Supporting Fig. S1) but is not most convenient for routine laboratory use. We thus designed a more straightforward signature and found that the combination of just four genes, HSD17B6, ITGA6, TOP2A, and VIM, each distinguishing one subgroup (NT, C1, C2A, and C2B, respectively), can be used as a robust HB signature. None of those genes were present in the 16-gene signature or reported in HB. We observed that the category C2B could display a mesenchymal phenotype with activation of transforming growth factor-β signaling that, depending on the microenvironment, can lead to cell invasion and cancer progression. Consistently, we found a significant overexpression of vimentin in C2B tumors by quantitative PCR, and immunohistochemistry revealed an atypical high vimentin expression in hepatocyte clusters with spindle-shaped morphology in one of two C2B samples. Due to the small number of samples, those results suggesting mesenchymal features need to be further confirmed. We showed that C2A was a highly proliferative subgroup with activation of cell-cycle checkpoints, mitosis, and transcriptional pathways. After additional validation, TOP2A might become a unique marker for routine diagnosis of proliferative HB.
It has been found that conventional chemotherapy is frequently ineffective for high-risk patients. The SIOPEL studies, which tried to counteract this trend by gradually intensifying chemotherapy, met with only limited success. The modifications attempted in the SIOPEL studies were a decrease in the intervals between treatment cycles, the addition of carboplatin as a chemotherapeutic agent, and increasing the dose of cisplatin.45 Moreover, most patients treated with high-dose cisplatin developed moderate to severe hearing loss due to its ototoxicity, despite the use of sodium thiosulfate as a protective agent. In order to find possible treatments for high-risk tumors, we showed a significant up-regulation of the FA–BRCA pathway involved in DNA interstrand crosslink repair in the C2A group.43 This fits well with current concepts that this pathway is induced in proliferative HB tumors because an active FA–BRCA pathway is likely to counteract the DNA damage that is instigated by cisplatin treatment46 and, thus, provides cells with a mechanism to resist cisplatin-based chemotherapy. Of the variety of FA inhibitors that we tested on HB cell lines, the proteasome inhibitor bortezomib was very efficient at reducing HB cell viability and clonogenic ability and inducing apoptosis. As shown by persistence of the pH2AX signal in bortezomib-treated cells, our results suggest that, as for other types of cancer,47 bortezomib acts in HB cells by decreasing the ubiquitination state of FANCD2 and FANCI, thereby preventing the formation of FANCD2/BRCA1 foci and repair of DNA damage. Although bortezomib clearly inhibits HB cell growth and tumor growth in the mouse model, it is worth noting that it is a broad-spectrum inhibitor and may affect HB cell viability also by other pathways. The exact molecular mechanisms making the link between proteasome inhibition and the FA–BRCA pathway remain obscure.37, 47 In addition, Castella et al.44 revealed recently that the FA–BRCA pathway was more complex than initially proposed, being nonlinear and exhibiting multiple stages of regulation. Identifying the key regulator of the FA–BRCA pathway will be required to unambiguously confirm that bortezomib causes the inhibition of the FA-BRCA pathway and the observed additive effect with cisplatin in HB cells. Finally, bortezomib is an attractive treatment option in pediatric oncology because it is used with success in many cancers48, 49 and is currently being tested in clinical trials for the treatment of acute lymphoblastic leukemia in children.42 Therefore, we speculate that the identification of the protein(s) involved in inhibition of the FA–BRCA pathway by bortezomib would pave the way for targeted therapy of HB and potentially of other cancers overexpressing the FA–BRCA pathway.
Acknowledgment
We thank Laurent Journot and Hugues Parinello (MGX Platform; https://www.igf.cnrs.fr/index.php/fr/research-fr/facility-fr#mgx) and Jérôme Kalisky (Université de Bordeaux and U1026 INSERM) for their helpful technical assistance. We also thank Mark Allen Hooks for critical comments on the manuscript. The scanning and microscopy of tissue sections were done in the Bordeaux Imaging Center, a service unit of the CNRS-INSERM and Bordeaux University, member of the national infrastructure France BioImaging. Flow cytometry was done in the Cytometry Platform, a service unit of the FR TransBiomed and Bordeaux University.
REFERENCES
Author names in bold designate shared co-first authorship.


