Interaction between alcohol consumption and metabolic syndrome in predicting severe liver disease in the general population
Potential conflicts of interest: Nothing to report.
Supported by research grants from the Wilhelm and Else Stockmanns Foundation, Liv och Hälsa, and Finska Läkaresällskapet (to F. Å.).
Abstract
The metabolic syndrome and alcohol risk use are both associated with a high prevalence of hepatic steatosis, but only a minority develop liver failure or liver cancer. Few general population studies have analyzed metabolic predictors of such severe liver complications. We studied which metabolic factors best predict severe liver complications, stratified by alcohol consumption, in 6732 individuals without baseline liver disease who participated in the Finnish population-based Health 2000 Study (2000-2001), a nationally representative cohort. Follow-up data from national registers until 2013 were analyzed for liver-related admissions, mortality, and liver cancer. Baseline alcohol use and metabolic factors were analyzed by backward stepwise Cox regression analysis. Eighty-four subjects experienced a severe liver event during follow-up. In the final multivariate model, factors predictive of liver events were age (hazard ratio [HR], 1.02; 95% confidence interval [CI], 1.004-1.04), sex (women: HR, 0.55; 95% CI, 0.34-0.91), alcohol use (HR, 1.002; 95% CI, 1.001-1.002), diabetes (HR, 2.73; 95% CI, 1.55-4.81), low-density lipoprotein (LDL) cholesterol (HR, 0.74; 95% CI, 0.58-0.93), and homeostasis model assessment of insulin resistance (HOMA-IR) (HR, 1.01; 95% CI, 1.004-1.02). Among alcohol risk users (≥210 g/week for men, ≥ 140 g/week for women), diabetes (HR, 6.79; 95% CI, 3.18-14.5) was the only significant predictor. Among nonrisk drinkers, age, alcohol use, smoking, waist circumference, low LDL cholesterol and HOMA-IR were significant independent predictors. The total-to-LDL cholesterol ratio and waist circumference-to-body mass index ratio emerged as additional independent predictors. Conclusion: Multiple components of the metabolic syndrome independently affected the risk for severe liver disease. Alcohol was significant even when average alcohol consumption was within the limits currently defining nonalcoholic fatty liver disease. (Hepatology 2018;67:2141-2149)
Abbreviations
-
- ALD
-
- alcoholic liver disease
-
- BMI
-
- body mass index
-
- CI
-
- confidence interval
-
- HDL
-
- high-density lipoprotein
-
- HOMA-IR
-
- homeostasis model assessment of insulin resistance
-
- HR
-
- hazard ratio
-
- LDL
-
- low-density lipoprotein
-
- NAFLD
-
- nonalcoholic fatty liver disease
-
- VLDL
-
- very low-density lipoprotein
Chronic liver disease is a major public health concern, being the 13th leading cause of death worldwide.1 Hepatocellular carcinoma, which usually occurs as an extension of chronic liver disease, is the second leading cause of cancer death.2 Finland has one of the highest liver disease mortality rates in Europe, and liver disease-related deaths are rising.3, 4
Alcoholic liver disease (ALD) and nonalcoholic fatty liver disease (NAFLD) are the two most common types of chronic liver disease in European populations.5 However, only 15%-20% of heavy alcohol drinkers ever develop liver cirrhosis, and less than 5% of NAFLD patients die from a liver-related cause.5 The individual susceptibility to progressive and complicated liver disease remains incompletely understood.
ALD and NAFLD are currently distinguished from each other by an arbitrary threshold of average alcohol intake of 30 g/day for men and 20 g/day for women.6, 7 However, even lower amounts of alcohol intake have been linked to increased liver mortality,8 and subjects with metabolic risk factors may be particularly sensitive to alcohol-induced liver injury.9-12 These findings are controversial, however, because mild to moderate alcohol use has also been associated with an improved lipid profile, anti-inflammatory effects, improved insulin sensitivity, and decreased risk of having NAFLD.13-15
Liver fibrosis occurs and progresses in NAFLD in only a minority and at a highly variable rate. The metabolic predictors of actual clinical liver complications are unclear. Obesity is associated with advanced ALD,9, 16-21 but the impact of other metabolic factors among alcohol risk drinkers have not been analyzed comprehensively. In addition, few longitudinal studies have been able to include liver-related hospital admissions as a study outcome, in addition to mortality.8
Because there appears to be considerable overlap and interaction between the risk factors for ALD and NAFLD, it can be argued that, on a population level, a more holistic approach is appropriate where alcohol use and metabolic factors are taken into account simultaneously, and where cirrhosis due to ALD and cirrhosis due to NAFLD are not held as separate outcomes. Both alcohol use and variables of metabolic syndrome are continuous and are not dichotomic variables, as such. There is significant overlap of the risk factors of NAFLD and ALD. Instead of separating these entities, the risk factors should be analyzed as a continuum to obtain an improved picture of the true burden of metabolic factors and alcohol use to liver morbidity and mortality.
An improved understanding of the metabolic factors that predict severe liver disease in the population can help in risk stratification and guide referral practices in primary care, and thereby enable targeted liver diagnostics and follow-up. Risk stratification is becoming more important as the population prevalence of metabolic abnormalities and fatty liver are increasing.
The aim of this study was to investigate which metabolic factors can best be used to predict the development of complicated liver disease in the general population stratified by alcohol consumption. Special emphasis was on the role of lipid abnormalities.
Material and Methods
Baseline data were taken from the Health 2000 Study, a multidisciplinary epidemiologic survey conducted in Finland in 2000-2001. Through a regional two-stage stratified cluster sampling procedure, the cohort is considered representative of the entire Finnish population. The Health 2000 Study was coordinated by the National Public Health Institute (now known as the National Institute for Health and Welfare), and originally comprised 8028 adults aged ≥ 30 years. Data were collected via structured home or telephone interviews, self-report questionnaires, clinical measurements (height, weight, waist circumference, blood pressure), blood tests, and by clinical examination by a physician. The Health-2000-Study protocol is described in detail elsewhere.22
Of the original sample of 8028 adults, 6771 subjects (84%) were interviewed at their homes or at an institution and provided signed informed consent for future registry linkage. The Epidemiology Ethics Committee of the Helsinki and Uusimaa Hospital Region approved the Health 2000 Study protocol, and all participants provided signed informed consent.
Respondents were asked to report how often they consumed alcoholic beverages during the previous year and the average amount they consumed per week during the previous month. Average alcohol consumption (grams per day) were calculated based on these data.
Diabetes was defined either by fasting serum glucose ≥7.0 mmol/L, taking diabetes medication, or a prior known diabetes diagnosis. The homeostasis model assessment of insulin resistance (HOMA-IR) served as an estimate of insulin resistance and was calculated using the following equation as described previously (those on insulin treatment were excluded)23: fasting insulin (μU/mL) × fasting glucose (mmol/L)/22.5. Serum triglycerides, total cholesterol, high-density lipoprotein (HDL) cholesterol, low-density lipoprotein (LDL) cholesterol, apolipoprotein B, glucose, insulin, glycated hemoglobin, and C-reactive protein were all directly measured in an at least 4 hours (50% > 8 hours) fasting state. The biochemical methods are described in detail elsewhere.24
Follow-up data for hospitalizations were obtained from the National Hospital Discharge Register, which covers all hospitalizations in Finland beginning in 1969. Data for cancers were obtained from the Finnish Cancer Registry, and vital status and cause of death data were obtained from Statistics Finland, which systematically collects data about the deaths of all Finnish citizens. In Finland, each person who dies is by law assigned a cause of death (in accordance with the International Classification of Diseases) to the official death certificate, issued by the treating physician based on medical or autopsy evidence, or forensic evidence when necessary; the death codes are then verified by medical experts at the register and recorded according to systematic coding principle. One or several ICD diagnoses are assigned to each hospitalization at discharge; these diagnosis codes are systematically recorded in the National Hospital Discharge Register. Data collection to all these registries is obligatory and general quality is consistent and complete. Linkage was performed using the unique personal identifiers assigned to all Finnish residents.
The primary study endpoint was the first hospitalization due to liver disease or liver-related death or a diagnosis of (primary) liver cancer, whichever came first. In line with previous studies, liver disease was defined as ICD8/9 codes 570-573 and ICD10 codes K70-K77 and C22.9, 25 Liver disease-related death was defined as having one of these as the underlying cause of death. Patients were followed-up for deaths and hospitalizations until December 2013 and for cancers until December 2012.
We excluded participants with records showing that one of the study endpoints (n = 37) occurred before study baseline.
For comparing groups, we used chi-squared, Mann-Whitney, or Kruskal-Wallis tests as appropriate. Correlations between continuous variables were calculated by partial correlation adjusted for age and separately by sex.
Predictors of liver events were estimated with adjusted hazard ratios (HRs) with 95% confidence intervals (CIs) using Cox proportional hazards models with time to first liver event as the outcome variable. Covariates exhibiting statistical significance on age- and sex-adjusted analyses were entered into a backward stepwise Cox regression model. Similar backward elimination modelling was performed in subgroups stratified by alcohol consumption of 210 g/week for men and 140 g/week for women in line with current thresholds used to distinguish ALD from NAFLD.6, 7 The relationship between average alcohol use and incident liver disease, stratified by body mass index (BMI), waist circumference, and diabetes, was examined using the penalized spline smoothing method26 adjusted for age and sex.
The interaction between various lipid levels were analyzed using Spearman correlation and by comparing the predictive value for liver events of various lipid levels and interaction terms. We calculated non-HDL cholesterol by subtracting HDL from total cholesterol. Apolipoprotein B was analyzed as a marker of lipoprotein particle number. Central obesity was assessed by dividing waist circumference by BMI.27 P < 0.05 was considered statistically significant. Data were analyzed with SPSS version 23 and R software version 3.2.5.
Results
The study cohort comprised 6732 participants (Table 1). The mean follow-up time was 11.4 years (standard deviation, 3.3 years [range, 0-13 years]).
| Demographic | All | Men | Women |
|---|---|---|---|
| No. of participants, n (%) | 6732 (100) | 2990 (44) | 3742 (56) |
| Age, years, mean (SD) | 54 (16) | 52 (14) | 55 (17) |
| Alcohol consumption (g/week), mean (SD) | 73 (145) | 124 (191) | 32 (70) |
| ≥210 g/week for men or ≥140 g/week for women, n (%) | 756 (12) | 565 (19) | 191 (5) |
| Smoking status, n (%) | |||
| Current | 1731 (26) | 972 (33) | 759 (20) |
| Former | 1453 (22) | 944 (32) | 509 (14) |
| Never | 3500 (52) | 1060 (35) | 2440 (66) |
| BMI, kg/m2, mean (SD) | 26.9 (4.7) | 27.0 (4.1) | 26.8 (5.1) |
| Waist circumference, cm, mean (SD) | 92.8 (13.3) | 97.8 (11.5) | 88.7 (13.3) |
| Elevated blood pressure,a n (%) | 4227 (64) | 2043 (69) | 2184 (60) |
| Diabetes, n (%) | 674 (10) | 301 (10) | 373 (10) |
| Impaired fasting glucose or diabetes, n (%) | 2425 (36) | 1277 (43) | 1148 (31) |
| Total cholesterol, mmol/L, mean (SD) | 5.93 (1.12) | 5.94 (1.12) | 5.92 (1.12) |
| LDL cholesterol, mmol/L, mean (SD) | 3.71 (1.06) | 3.82 (1.05) | 3.62 (1.06) |
| HDL cholesterol, mmol/L, mean (SD) | 1.32 (0.38) | 1.20 (0.34) | 1.43 (0.38) |
| Triglycerides, mmol/L, mean (SD) | 1.62 (1.05) | 1.81 (1.27) | 1.46 (0.79) |
| Non-HDL cholesterol, mmol/L, mean (SD)b | 4.60 (1.15) | 4.74 (1.15) | 4.49 (1.14) |
| Apolipoprotein B, mmol/L, mean (SD) | 1.22 (0.29) | 1.28 (0.29) | 1.18 (0.29) |
| Glycated hemoglobin, %, mean (SD) | 5.35 (0.71) | 5.44 (0.73) | 5.28 (0.68) |
| C-reactive protein, mg/L, mean (SD) | 2.27 (6.32) | 2.33 (7.16) | 2.22 (5.52) |
| HOMA-IR, mean (SD) | 2.51 (5.47) | 2.77 (7.23) | 2.3 (3.37) |
- a Blood pressure ≥ 130/85 mm Hg or antihypertensive medication.
- b Total cholesterol - HDL cholesterol.
At baseline, 46% of subjects had metabolic syndrome and 22% were obese (BMI > 30 kg/m2). Of these subjects, 13% and 12%, respectively, were also alcohol risk users (≥210 g/week for men, ≥ 140 g/week for women). Of alcohol risk users, 49% had the full metabolic syndrome, and only 8% did not have at least one component of the metabolic syndrome.
Correlations of average weekly alcohol consumption to BMI, waist circumference, cholesterol and triglyceride levels, HOMA-IR, and glycated hemoglobin were negligible (Supporting Table S1). The age-adjusted correlation between waist circumference and BMI was high (rho = 0.91 for men and 0.89 for women; P < 0.001). Correlations of HOMA-IR to waist circumference (rho = 0.23-0.31; P < 0.001) and BMI (rho = 0.23-0.29; P < 0.001) were low for both sexes.
Total cholesterol, LDL cholesterol, apolipoprotein B, and non-HDL cholesterol exhibited strong positive correlations (rho ≥ 0.8) with each other (Supporting Table S2). Triglycerides correlated moderately and inversely with HDL cholesterol, and positively with non-HDL cholesterol, and apolipoprotein B (Supporting Table S2).
During follow-up, 84 subjects experienced a severe liver event (first hospitalization due to liver disease or liver disease-related death or a diagnosis of (primary) liver cancer), with the first liver event occurring a mean of 6.4 years (standard deviation, 3.7 years [range, 0-12 years]) after baseline. Of liver events, 55 (64%) occurred among men and 29 (34%) among women, without any significant differences in mean time to first event (11.4 and 11.4 years, respectively). The first recorded liver event was hospitalization in 60 cases, liver cancer in 9 cases, and liver disease-related death in 15 cases.
Table 2 shows the factors associated with incident severe liver events by unadjusted and adjusted Cox regression analyses. In the backward stepwise elimination Cox regression analysis, the final multivariate model included the following factors: age, sex, alcohol use, diabetes, LDL cholesterol, and HOMA-IR (Table 2). The same factors remained significant in a multivariate model including all factors significant on age- and sex-adjusted analysis without backward elimination (data not shown). Table 3 shows the factors included in the final backward elimination models in subgroups based on average alcohol intake.
| Baseline Factor | Unadjusted Covariates | Age- and Sex-Adjusted Covariates | Fully Adjusted Model (Backward Elimination) |
|---|---|---|---|
| Age, years | 1.02 (1.01-1.04) | 1.02 (1.004-1.04) | |
| Women | 0.46 (0.30-0.71) | 0.55 (0.34-0.91) | |
| Alcohol consumption, g/week | 1.002 (1.002-1.003) | 1.002 (1.002-1.003) | 1.002 (1.001-1.002) |
| Smoking status | |||
| Current | 1.73 (1.07-2.78) | 1.84 (1.10-3.08) | |
| Former | 1.29 (0.74-2.25) | 0.96 (0.54-1.71) | |
| Never | Reference | Reference | |
| BMI, kg/m2 | 1.03 (0.98-1.07) | 1.02 (0.97-1.06) | |
| Waist circumference, cm | 1.03 (1.02-1.05) | 1.02 (1.01-1.04) | |
| Elevated blood pressurea | 2.40 (1.43-4.02) | 1.80 (1.04-3.11) | |
| Diabetes | 4.64 (2.93-7.34) | 3.94 (2.43-6.37) | 2.73 (1.55-4.81) |
| Impaired fasting glucose or diabetes | 2.92 (1.91-4.48) | 2.33 (1.49-3.64) | |
| Total cholesterol, mmol/L | 0.99 (0.82-1.19) | 0.94 (0.78-1.14) | |
| LDL cholesterol, mmol/L | 0.79 (0.64-0.98) | 0.72 (0.58-0.90) | 0.74 (0.58-0.93) |
| HDL cholesterol, mmol/L | 0.99 (0.57-1.73) | 1.48 (0.84-2.60) | |
| Triglycerides, mmol/L | 1.29 (1.18-1.42) | 1.24 (1.12-1.38) | |
| Non-HDL cholesterol, mmol/Lb | 0.99 (0.83-1.19) | 0.90 (0.75-1.09) | |
| Apolipoprotein B, mmol/L | 0.98 (0.48-2.00) | 0.61 (0.29-1.30) | |
| Glycated hemoglobin, % | 1.44 (1.22-1.71) | 1.32 (1.09-1.61) | |
| C-reactive protein, mg/L | 1.02 (1.01-1.03) | 1.01 (1.00-1.03) | |
| HOMA-IR | 1.02 (1.01-1.02) | 1.02 (1.01-1.02) | 1.01 (1.004-1.02) |
- Data are presented as the HR (95% CI). The analysis initially considered all the covariates that were statistically significant on age- and sex-adjusted analysis. For continuous variables, HR was calculated for an increment of 1 unit.
- a Blood pressure ≥ 130/85 mm Hg or antihypertensive medication.
- b Total cholesterol - HDL cholesterol.
| Subjects | Liver Events | HR (95% CI) | |
|---|---|---|---|
| Alcohol use < 210 g/week for men or <140 g/week for women | 5224 | 47 | |
| Age | 1.04 (1.02-1.06) | ||
| Average alcohol use, g/week | 1.01 (1.000-1.01) | ||
| Smoking | |||
| Current | 2.23 (1.12-4.47) | ||
| Former | 0.79 (0.36-1.75) | ||
| Never | Reference | ||
| HOMA-IR | 1.04 (1.01-1.07) | ||
| Waist circumference, cm | 1.03 (1.003-1.05) | ||
| LDL cholesterol, mmol/L | 0.54 (0.40-0.74) | ||
| Alcohol use ≥ 210 g/week for men or ≥140 g/week for women | 710 | 28 | |
| Diabetes | 6.79 (3.18-14.5) |
- The model initially considered all baseline variables statistically significant on age- and sex-adjusted analysis. For continuous variables, HR was calculated for an increment of 1 unit.
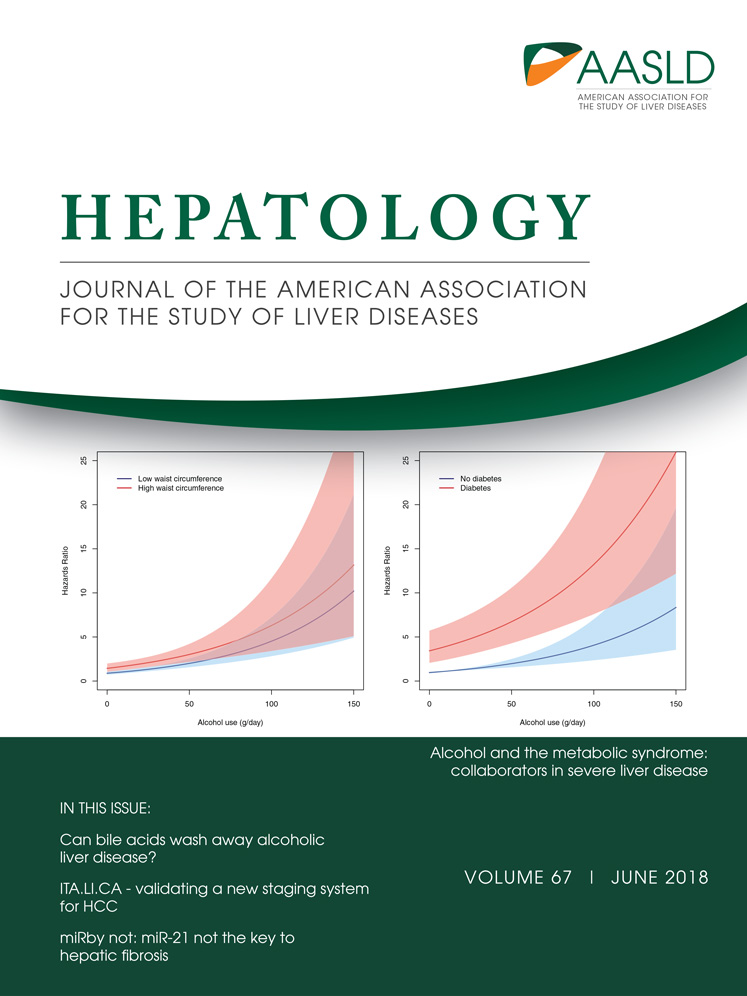
Among mild/moderate drinkers, the risk for incident liver disease increased with obesity (BMI > 30 kg/m2), central obesity (waist circumference > 102/88 cm), and diabetes (Fig. 1). Among alcohol risk drinkers, a synergistic risk increase was clearly seen for alcohol and diabetes and for alcohol and increased waist circumference, less so for alcohol and BMI (Fig. 1). Figure 2 shows the exponential relationship between average alcohol use and incident liver disease when stratified by BMI, waist circumference, and diabetes.

Interaction between average daily alcohol use and (A) BMI (kg/m2), (B) waist circumference, and (C) diabetes regarding the risk for incident severe liver disease (hospitalization, liver cancer, or death). Cox regression analysis was adjusted for age and sex. Waist circumference was stratified into low and high by <102 cm or ≥ 102 cm for men and <88 cm or ≥ 88 cm for women. *P < 0.01.

The relationship between average alcohol use and risk for severe liver disease stratified by (A) BMI (kg/m2), (B) waist circumference, and (C) diabetes. Cox regression analysis was adjusted for age and sex. The gray area represent 95% CIs to the relative risk (HR) estimate. Waist circumference is stratified into low and high by <102 cm or ≥ 102 cm for men and <88 cm or ≥ 88 cm for women.
LIPID ABNORMALITIES
Of the lipid values, only LDL cholesterol and triglycerides were significantly associated with liver events on age-adjusted and sex-adjusted Cox regression analysis (Table 1). Triglyceride level (HR, 1.16; 95% CI, 1.02-1.32) was a significant factor on Cox regression analysis when adjusted for age, sex, average alcohol intake, diabetes, and HOMA-IR. When LDL cholesterol was additionally included in the model, LDL cholesterol was significant (HR, 0.75; 95% CI, 0.60-0.95), whereas triglyceride level became nonsignificant (P = 0.15).
The total-to-LDL cholesterol ratio was highly significantly associated with incident liver events on age- and sex-adjusted analysis (HR, 2.60; 95% CI, 1.84-3.67; P < 0.001). Similar adjusted associations were observed for the non-HDL-to-LDL cholesterol ratio (HR, 2.54; 95% CI, 1.72-3.76; P < 0.001) and triglycerides-to-LDL cholesterol ratio (HR, 1.53; 95% CI, 1.25-1.86; P < 0.001). To test which of these three ratios showed the strongest association with incident liver events, the ratios were entered pairwise into separate Cox regression elimination models. Here, the total-to-LDL cholesterol ratio proved to be the stronger predictor both when compared with the non-HDL-to-LDL cholesterol ratio and to the triglycerides-to-LDL cholesterol ratio (data not shown). The non-HDL-to-LDL cholesterol ratio proved stronger in comparison with the triglycerides-to-LDL cholesterol ratio (data not shown).
The total-to-LDL cholesterol ratio remained highly significantly associated with incident liver events (HR, 2.70; 95% CI, 1.72-4.19; P < 0.001) on multivariate Cox regression analysis adjusted for age, sex, average alcohol intake, diabetes, and HOMA-IR. The non-HDL-to-LDL cholesterol ratio (HR, 2.62; 95% CI, 1.54-4.45; P < 0.001) and the triglycerides-to-LDL cholesterol ratio (HR, 1.42; 95% CI, 1.07-1.89; P = 0.02) likewise remained significant on separate analyses, both adjusted for the same independent factors above.
CENTRAL OBESITY
The waist circumference-to-BMI ratio was highly significantly associated with incident liver events on unadjusted analysis (HR, 5.51; 95% CI, 2.77-10.96; P < 0.001), age- and gender-adjusted analysis (HR, 3.73; 95% CI, 1.71-8.14; P = 0.001), and multivariate analysis (HR, 2.83; 95% CI, 1.23-6.52; P = 0.01) adjusted for age, average alcohol intake, diabetes, LDL cholesterol, and HOMA-IR. Moreover, the waist circumference to BMI ratio was significantly associated with liver events both among normal weight subjects (BMI < 25 kg/m2) (HR 7.50, 95% CI 2.42-23.3; P < 0.001), and those overweight (BMI 25-30 kg/m2) (HR 27.0, 95% CI 6.64-110; P < 0.001) or obese (BMI > 30 kg/m2) (HR, 6.75; 95% CI, 1.30-35.0; P = 0.02).
BACKWARD ELIMINATION MODEL WITH THE TOTAL-TO LDL CHOLESTEROL AND WAIST CIRCUMFERENCE-TO-BMI RATIOS
In a backward elimination Cox regression model with age, sex, alcohol use, smoking, hypertension, impaired fasting glucose, diabetes, triglycerides, glycated hemoglobin, HOMA-IR, and the total-to-LDL cholesterol ratio and waist circumference-to-BMI ratio as independent covariates, we found that both the total-to-LDL cholesterol ratio and waist circumference-to-BMI ratio remained significant factors in the final model (Table 4).
| HR | 95% CI | P | |
|---|---|---|---|
| Age, years | 1.02 | 1.00-1.04 | 0.04 |
| Alcohol consumption, g/wk | 1.002 | 1.001-1.002 | <0.001 |
| Diabetes | 2.75 | 1.56-4.84 | <0.001 |
| HOMA-IR | 1.01 | 1.01-1.02 | <0.001 |
| Total-to-LDL cholesterol ratio | 2.64 | 1.67-4.16 | <0.001 |
| Waist circumference-to-BMI ratio | 3.70 | 1.74-7.89 | 0.001 |
- The analysis initially included the following covariates: total-to-LDL cholesterol ratio, waist circumference-to-BMI ratio, age, sex, alcohol use, smoking, hypertension, impaired fasting glucose, diabetes, triglycerides, glycated hemoglobin, and HOMA-IR. For continuous variables, HR was calculated for an increment of 1 unit.
Both ratios were also significant when the backward elimination was repeated in the subgroup with alcohol consumption <210 g/week for men and <140 g/week for women (Supporting Table S3). Among alcohol risk users, the waist circumference to BMI ratio was significant, but not the total-to-LDL cholesterol ratio (Supporting Table S3).
Discussion
This longitudinal population-based cohort study found that the main metabolic parameters predictive of severe liver disease (admission, liver cancer, or liver disease-related death) in the general population are a low LDL cholesterol, diabetes, and insulin resistance, in addition to age, sex, and alcohol use. In the subgroup of alcohol risk users, the only metabolic factor to predict liver disease was diabetes. We identified the total-to-LDL cholesterol ratio and waist circumference-to-BMI ratio as predictors of severe liver disease. Among persons with alcohol use within the limits used to define NAFLD, average alcohol use was still a significant risk factor for incident liver disease. This implies that safe limits of alcohol use with regard to liver risk may not exist. Current smokers had a two-fold risk for liver disease compared with persons who had never smoked regularly.
Strengths of our study included the prospective design, nationally representative and well-characterized cohort, complete follow-up data, and high validity of liver diagnoses. The study outcome was clinically relevant liver disease (i.e., the first hospitalization due to liver disease or liver disease-related death or a diagnosis of liver cancer). We used a holistic approach in terms of liver outcomes by not distinguishing between alcoholic and nonalcoholic liver outcomes, which eventually depends on subjective and unreliable classification. With rising prevalence of the metabolic syndrome, it appears likely that there are mixed etiologies underlying chronic liver disease.4, 9, 11, 12, 21
At the population level, NAFLD is the main cause of cirrhosis in persons with no or mild alcohol consumption. Chronic viral hepatitis is very rare in Finland (0.3%).28 Although the metabolic factors associated with NAFLD are well known, only a few studies have had the opportunity to analyze which metabolic factors are most strongly associated with actual clinical complicated liver disease by multivariate modeling. We used backward stepwise elimination for variable selection, because this is currently considered one of the most reliable approaches for multivariate etiologic models.29 However, it must be acknowledged that any variable selection may fail to capture complex interrelations between different variables.
Obesity, as defined by an elevated BMI, is the metabolic factor that has most often been associated with liver disease, including liver cirrhosis16, 30 and hepatocellular carcinoma.21, 31 Obesity and alcohol risk use synergistically increase these risks.9, 11, 12, 17, 21 However, in many subjects, obesity is accompanied by other metabolic factors such as dyslipidemia, diabetes, and hypertension, which have not been adequately controlled in many studies. This makes it difficult to conclude whether it is obesity itself that drives the risk or the accompanying metabolic conditions. In our study, BMI did not predict severe liver disease, and waist circumference lost its significance in the fully adjusted predictive models. In contrast, a high waist circumference-to-BMI ratio was a strong driver of the risk for liver events. This finding is supported by previous studies reporting that increased waist circumference with normal BMI is a metabolically more unhealthy state than a normal waist circumference with a high BMI.27 A high waist circumference-to-BMI ratio likely reflects a central/visceral adiposity that is accompanied by low peripheral adiposity or sarcopenia, both of which are high-risk metabolic conditions. Based on our findings, BMI may not be the best parameter to define “lean NAFLD,” because subjects with a normal BMI may still exhibit central adiposity (high waist circumference). Waist circumference and the waist circumference-to-BMI ratio merits further study in the context of NAFLD. Nonetheless, our findings are supported by a large US study concluding that central obesity is associated with liver cirrhosis, whereas obesity with preferential peripheral fat distribution is not.30
Among alcohol risk users, the only metabolic factor to drive risk of liver events was diabetes. However, it should be noted that there was a limited number of alcohol risk drinkers in our cohort (n = 710). Raynard et al.19 likewise found blood glucose to be an independent risk factor for liver fibrosis in alcoholic liver disease. A large US study based on the Third National Health and Nutrition Examination Survey (NHANES III) survey32 found that among 235 persons with presumed alcoholic liver disease (excessive alcohol use for the past 5 years and elevated serum aminotransferases), independent predictors of liver-related mortality were age, male sex, obesity (elevated BMI and/or waist circumference), and the metabolic syndrome. The independent effect of diabetes was almost significant (HR, 3.6; 95% CI, 0.96-13.5).
To our knowledge, the finding that total-to-LDL cholesterol ratio is associated with incident severe liver disease risk has not been reported before. Although a low LDL cholesterol level could reflect liver synthetic dysfunction, and thus mark the existence of undiagnosed liver disease, one would expect that the apolipoprotein B level and the total cholesterol level would also be reduced in this situation. We found this association especially in the subgroup without alcohol risk use, who are likely to suffer from NAFLD.
NAFLD is associated with a lipid profile characterized by a high serum triglyceride level, low HDL cholesterol level, high triglyceride-rich very low-density lipoprotein (VLDL) level, and accumulation of small-dense LDL.33 VLDL is associated with NAFLD severity.34
It could be speculated that a high total-to-LDL cholesterol ratio reflects a state where a larger proportion than normal of plasma cholesterol is in the form of non-LDL lipoproteins such as VLDL (reflected by total cholesterol) and a reduced proportion in LDL. The total-to-LDL cholesterol ratio may thus emerge as a simple and readily available marker of the complex dyslipidemia characteristic of progressive NAFLD. However, this needs to be confirmed in appropriate studies with comprehensive lipid fraction measurements.
Limitations of the study include the fact that registry data were not a priori intended for the specific study purpose. However, the registries used for the study outcome data are considered of high international standard. The outcome measures do not capture compensated cirrhosis without hospitalizations, because baseline and follow-up imaging and liver fibrosis measures were unavailable. However, our specific intention was to detect serious liver events (decompensation, hepatocellular carcinoma, or death) that require hospital contact. The study did not include medication use, which might affect the risk of liver disease.
In conclusion, single metabolic parameters are insufficient in the evaluation of individual risk for severe liver disease. For a comprehensive liver-risk assessment, lipid abnormalities, abdominal obesity, insulin resistance, diabetes, and alcohol use should all be addressed at the same time. These are also factors to be considered in future risk scores for quantifying individual risk for liver disease. Among alcohol risk users, diabetes is a strong predictor of severe liver disease. On the other hand, among nonrisk drinkers, alcohol consumption may still be a relevant independent predictor for severe liver disease.
Acknowledgment
We thank all participants of and persons involved in the conduct of the Health 2000 study. We are grateful to biostatisticians Paula Bergman and Anna But at the University of Helsinki for help with the R program.