Pivotal role of glutamine synthetase in ammonia detoxification
Potential conflict of interest: Dr. Deutz received grants and speaker fees from Abbott Nutrition.
Supported by The Netherlands Organisation for Scientific Research (grant NWO SGC210009).
Abstract
Glutamine synthetase (GS) catalyzes condensation of ammonia with glutamate to glutamine. Glutamine serves, with alanine, as a major nontoxic interorgan ammonia carrier. Elimination of hepatic GS expression in mice causes only mild hyperammonemia and hypoglutaminemia but a pronounced decrease in the whole-body muscle-to-fat ratio with increased myostatin expression in muscle. Using GS-knockout/liver and control mice and stepwise increments of enterally infused ammonia, we show that ∼35% of this ammonia is detoxified by hepatic GS and ∼35% by urea-cycle enzymes, while ∼30% is not cleared by the liver, independent of portal ammonia concentrations ≤2 mmol/L. Using both genetic (GS-knockout/liver and GS-knockout/muscle) and pharmacological (methionine sulfoximine and dexamethasone) approaches to modulate GS activity, we further show that detoxification of stepwise increments of intravenously (jugular vein) infused ammonia is almost totally dependent on GS activity. Maximal ammonia-detoxifying capacity through either the enteral or the intravenous route is ∼160 μmol/hour in control mice. Using stable isotopes, we show that disposal of glutamine-bound ammonia to urea (through mitochondrial glutaminase and carbamoylphosphate synthetase) depends on the rate of glutamine synthesis and increases from ∼7% in methionine sulfoximine-treated mice to ∼500% in dexamethasone-treated mice (control mice, 100%), without difference in total urea synthesis. Conclusions: Hepatic GS contributes to both enteral and systemic ammonia detoxification. Glutamine synthesis in the periphery (including that in pericentral hepatocytes) and glutamine catabolism in (periportal) hepatocytes represents the high-affinity ammonia-detoxifying system of the body. The dependence of glutamine-bound ammonia disposal to urea on the rate of glutamine synthesis suggests that enhancing peripheral glutamine synthesis is a promising strategy to treat hyperammonemia. Because total urea synthesis does not depend on glutamine synthesis, we hypothesize that glutamate dehydrogenase complements mitochondrial ammonia production. (Hepatology 2017;65:281-293).
Abbreviations
-
- CPS1
-
- carbamoylphosphate synthetase-1
-
- GS (Glul)
-
- glutamine synthetase
-
- GS-KO/L
-
- Alfp-Cretg/−/Gsfl/fl mice
-
- GS-KO/M
-
- Mck-Cretg/−/Gsfl/fl mice
-
- GS-KO/LM
-
- Alfp-Cretg/−/Mck-Cretg/−/Gsfl/fl mice
-
- GS-KO/0.5
-
- Gsfl/LacZ mice
-
- K0.5
-
- substrate concentration at which process proceeds at 50% of maximum velocity
-
- KO
-
- knockout
-
- MSO
-
- methionine sulfoximine
Glutamine synthetase (GS) catalyzes condensation of ammonia with glutamate to glutamine. (Note: NH3 is protonated for ∼98% to NH4+ at physiological pH. We use the term “ammonia” to refer to the sum of NH3 and NH4+ unless specified as either “NH3” or “NH4+.”) Glutamine serves, with alanine, as a major nontoxic interorgan ammonia shuttle in the body1 and as an amino-moiety donor for the synthesis of nucleotides, amino acids, amino-sugars, and oxidized nicotinamide adenine dinucleotide. Its intracellular turnover rate exceeds that of all other amino acids. GS deficiency causes only moderate hyperammonemia, but affected humans and mice suffer from encephalopathy and die neonatally.2, 3
GS is predominantly expressed in the nervous system, kidney, and liver, that is, in established glutamine-consuming organs,4-6 whereas skeletal muscle, with a much lower expression but large mass, is considered the main net producer of glutamine.7 The nervous system synthesizes glutamine to scavenge the neurotransmitter glutamate and the kidneys to control the ammonia production needed to counteract metabolic acidosis, but the liver is considered the main ammonia-detoxifying organ: it metabolizes ammonia (or glutamine through glutaminase-2) to urea in the upstream, periportal region. Because urea synthesis is a low-affinity, ammonia-detoxifying mechanism, expression of GS in the downstream, pericentral hepatocytes is considered essential to ensure physiologically low ammonia concentrations in the hepatic vein. However, this hypothesis is based on ex vivo perfused livers that were pretreated with methionine sulfoximine (MSO) to inhibit GS activity8 or CCl4 to eliminate pericentral hepatocytes.9
To assess the ammonia-detoxifying function of GS in an in vivo setting, we generated mice with the protein-coding region of the GS gene (Glul) flanked by loxP sequences.2, 10 We used genetic (muscle-specific10 and liver-specific [this study] GS-knockout [KO] mice) or pharmacological methods to modulate GS activity and stepwise increments of enterally or intravenously administered NH4HCO3 to challenge ammonia detoxification (see Supporting Fig. S1). With these approaches, we establish that the urea cycle and GS contribute equally to hepatic ammonia detoxification and that GS is solely responsible for systemic ammonia detoxification. The disposal of glutamine-bound ammonia was assessed quantitatively with stable isotopes and shown to depend steeply on the whole-body rate of glutamine synthesis.
Materials and Methods
Glulfl/fl mice2, 10 were crossed with Alfp-Cre11 and/or Mck-Cre10 transgenic mice to eliminate the Glul allele in hepatocytes and striated myocytes, respectively. These are referred to as GS-KO/L, GS-KO/M, and GS-KO/LM mice. Hemizygous GS-deficient (Glulfl/LacZ) mice are referred to as GS-KO/0.5 mice. For details, see Supporting Information.
ANIMAL TREATMENTS
The studies were carried out in accordance with Dutch guidelines for the care and use of laboratory animals and approved by the Ethical Committees for Animal Research at the University of Amsterdam and Maastricht University (ALC11, DEC1000022, and DEC100710). Mice were challenged by addition of 280 mmol/L NH4HCO3 to drinking water containing 280 mmol/L sucrose. The ingested volume was recorded. GS enzyme activity was pharmacologically inhibited by intraperitoneal injection of 100 μg/g MSO (M5379; Sigma, St. Louis, MO) 4 hours prior to blood sampling. At 4 hours, the tissue concentration of MSO is maximal and enzyme activity is inhibited ∼90% in liver and kidney and ∼75% in brain.12 Some mice were treated overnight (∼16 hours) with 20 μg/g water-soluble dexamethasone (Centrafarm, Etten-Leur, The Netherlands). Unless stated otherwise, the animals were sacrificed in the fed condition.
AMMONIA CHALLENGE
Mice were challenged with stepwise increases in the rate of ammonia infusion into the jugular vein (40-120 μL/hour of 250 mmol/L NH4HCO310). Infusion into the duodenum (750 μL/hour) was increased by increasing the NH4HCO3 concentration (12-330 mmol/L). The duration of an experiment never exceeded 210 minutes. For details of mouse instrumentation, see Supporting Information.
GLUTAMINE METABOLISM AND UREA FORMATION
Mice were primed through the external jugular vein (100 μL/mouse) with 650 nmol/g 18O-,13C-urea (COLM-4861) and 58.4 nmol/g 515N-glutamine (NLM-557; Cambridge Isotope Laboratories, Tewksbury, MA) and subsequently infused hourly by the same route with 360 nmol/g 18O-,13C-urea, 240 nmol/g 515N-glutamine, and 2.4 μmol NaHCO3/g.
STATISTICAL ANALYSIS
Genotype and sex effects were analyzed by two-way analysis of variance. Because no effects of sex were observed, effects of genotype were determined with one-way analysis of variance in pooled data. Linear regression with comparison of slopes was used to determine whether a common line or separate lines per group best fitted the bivariate data. Nonlinear response curves were linearized by converting them to double-reciprocal plots. Data are expressed as mean ± standard error of the mean per group.
Results
BIOMETRY OF GS-KO/L MICE
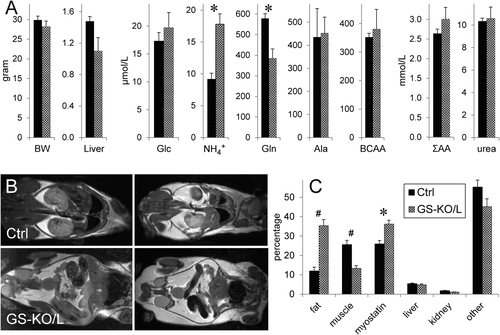
The livers of GS-KO/L mice were virtually devoid of GS-positive hepatocytes (Supporting Fig. S2) and contained only 6 ± 2% residual GS messenger RNA. Deletion of GS expression in GS-KO/L mice was confined to the liver. The arterial ammonia concentration was ∼1.9-fold higher and glutamine almost ∼1.5-fold lower in GS-KO/L than control mice, but body and liver weights and plasma glucose, alanine, branched-chain and summed amino acids, and urea were not different at 3 months of age (Fig. 1A). However, the proton-density fat fraction of GS-KO/L livers (11.0%) was >5-fold that of control mice (1.9%, P = 0.002). The increased lipid content was confirmed with oil red O staining (Supporting Fig. S3) and colocalized with ornithine aminotransferase in the pericentral region. In addition, the whole-body muscle-to-fat volume ratio had declined >5-fold in GS-KO/L compared to control mice because the muscle compartment decreased ∼2.1-fold, whereas fat depots increased ∼2.6-fold (Fig. 1B,C). The muscle-to-fat volume ratio also decreased in GS-KO/M mice but to a lesser extent (not shown). In agreement, expression of myostatin, which induces muscle loss,13 had increased ∼1.4-fold in GS-KO/L muscle (Fig. 1C). Male GS-KO/L mice became infertile at ∼4 months.
GLUTAMINE AND AMMONIA HANDLING IN FED AND POSTABSORPTIVE GS-KO/L MICE
In the fed condition, arterial, portal, and hepatovenous plasma glutamine concentrations in GS-KO/L mice were 60%-65% of that in control mice (Fig. 2A). Similarly, the hepatic glutamine concentration was 750 ± 60 μmol/kg in GS-KO/L mice and 1,300 ± 100 μmol/kg in control mice (∼60%, P = 0.001). The arterial ammonia concentration was ∼1.9-fold higher in fed GS-KO/L than control mice (Fig. 2B), but portal and hepatovenous ammonia concentrations were similar. Accordingly, the fluxes of glutamine (Fig. 2C) and ammonia (Fig. 2D) in the portal-drained viscera and the liver were similar in control and GS-KO/L mice.
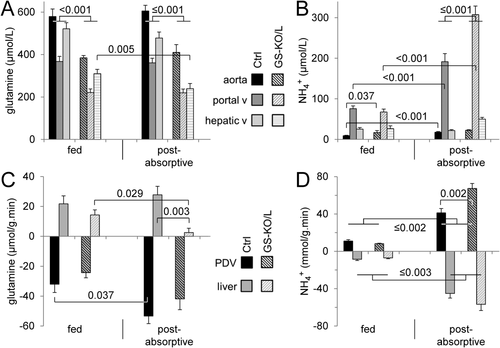
The postabsorptive state induces protein catabolism and, therefore, represents an ammonia challenge. Relative to fed mice, arterial and portal glutamine concentrations were unchanged in 4 hour–fasted control and GS-KO/L mice (Fig. 2A), but the hepatovenous glutamine concentration was lower in GS-KO/L mice. Arterial, portal, and hepatovenous ammonia concentrations were significantly higher in postabsorptive GS-KO/L than control mice (Fig. 2B); but relative to the fed condition, fasting only increased portal ammonia concentration (∼4.5-fold) in GS-KO/L mice. Relative to fed mice, postabsorptive glutamine consumption across the portal-drained viscera increased significantly in control mice only (Fig. 2C), whereas ammonia production increased 4-fold to 7-fold in both groups (Fig. 2D). Hepatic production of glutamine did not change in control mice but declined to a very low level in GS-KO/L mice (Fig. 2C), while ammonia uptake increased 4-fold (controls) to 8-fold (GS-KO/L) (Fig. 2D). In summary, the main effect of hepatic absence of GS expression in the postabsorptive condition was the virtual disappearance of hepatic glutamine production and only partial (∼50%) compensation by increased ammonia uptake.
AMMONIA-DETOXIFYING CAPACITY AND HEPATIC AMMONIA CLEARANCE UPON INTESTINAL ADMINISTRATION OF INCREMENTAL DOSES OF NH4HCO3
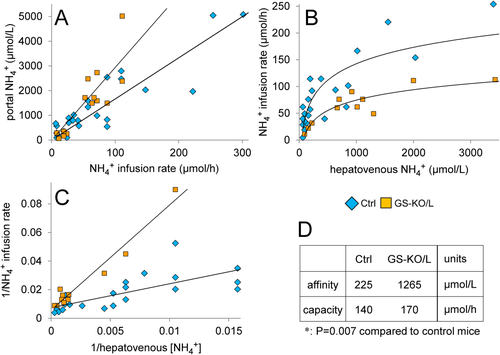
To further challenge ammonia-detoxifying capacity, the daily ammonia load was tripled by addition of NH4HCO3 to the drinking water (see Supporting Information). Unexpectedly, this intervention only had a limited effect on intestinal and hepatic glutamine and ammonia metabolism (Supporting Fig. S4), probably because its effect declined with the time since drinking. To determine the capacity of the liver to detoxify ammonia more directly, we infused incremental doses of NH4HCO3 into the duodenum. Ammonia concentrations in the portal vein reached steady-state levels within 60 minutes after starting the experiment (Supporting Fig. S5) and increased linearly with increasing NH4HCO3 load (Fig. 3A), implying that intestinal ammonia uptake was not limiting. However, at the same infusion rate, the portal ammonia concentration was ∼1.8-fold higher in GS-KO/L than control mice (P < 0.001). Initially, the corresponding hepatovenous ammonia concentrations increased linearly with increasing NH4HCO3 dose, but when the infusion rate exceeded ∼100 μmol NH4HCO3/hour in control mice and ∼50 μmol/hour in GS-KO/L mice, circulating ammonia levels rose more rapidly, indicating failing detoxification (Fig. 3B). The response curves were linearized by converting them to double-reciprocal plots (Fig. 3C). Extrapolation of the regression lines indicated that the ammonia-detoxifying capacity (at infinite ammonia concentrations) was similar in control and GS-KO/L mice, but the affinity for ammonia was 5-fold to 6-fold higher in control than GS-KO/L mice (Fig. 3D). Because the absence of GS in the pericentral hepatocytes is the only difference between control and GS KO/L mice, these data confirm that GS is responsible for high-affinity ammonia detoxification in the liver and show that hepatic GS accounts for ∼50% of hepatic ammonia detoxification.
Relative to portal ammonia concentrations, hepatovenous ammonia concentrations in GS-KO/L or GS-KO/LM mice were ∼2.3-fold higher than in those control mice (Fig. 4A; P < 0.001). Liver ammonia clearance increased linearly up to ∼2 mmol/L ammonia in the portal vein (Fig. 4B), irrespective of GS expression in the liver; but GS-KO/L mice needed an ∼2-fold higher portal ammonia concentration to attain the same clearance as control mice. Unless challenged enterally with NH4HCO3, portal ammonia concentrations in mice did not exceed ∼500 μmol/L (Supporting Fig. S6). A portal ammonia concentration of ∼2 mmol/L is reached when ∼120 and ∼60 μmol/hour NH4HCO3 are infused into the duodenum of control and GS-KO/L mice, respectively (Fig. 3A), which appears to represent the highest portal ammonia concentration that can be efficiently detoxified, because Fig. 3B shows that hepatovenous ammonia concentrations increased proportionally with enteral ammonia load up to, but not beyond, these infusion rates. Control mice cleared ∼70% of the total hepatic ammonia load, while GS-KO/L or GS-KO/LM mice cleared ∼35% (Fig. 4B; P < 0.001).

AMMONIA-DETOXIFYING CAPACITY UPON ADMINISTRATION OF INCREMENTAL DOSES OF NH4HCO3 INTO THE JUGULAR VEIN
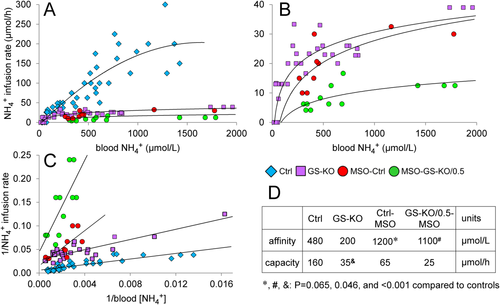
The kidney produces substantial amounts of ammonia during acidosis, ∼50% of which is secreted into the renal vein.14, 15 Portosystemic shunting of blood, as occurs in cirrhotic liver disease, also challenges systemic ammonia detoxification. We, therefore, also challenged mice systemically by infusing incremental doses of NH4HCO3 into the jugular vein. Because constitutive GS deficiency is lethal,2 some control mice were pretreated for 4 hours with the irreversible GS inhibitor MSO. Furthermore, some mice were pretreated with dexamethasone to induce glutamine turnover.16, 17 Blood ammonia concentrations in control mice increased linearly up to ∼150 μmol/hour NH4HCO3 intravenously and more rapidly at higher infusion rates, indicating failing ammonia detoxification (Fig. 5A). Ammonia detoxification in GS-KO/L, GS-KO/M, or GS-KO/LM mice already started to fail when the intravenous infusion rate exceeded ∼20 μmol/hour NH4HCO3 (Fig. 5A,B) and in MSO-treated mice at even lower intravenous ammonia loads (Fig. 5B). The response curves were converted to double-reciprocal plots (Fig. 5C) to estimate kinetic parameters (Fig. 5D). The responses of the subgroups included in the control (GS-KO/0.5 and dexamethasone-treated control) and GS-KO (GS-KO/L, GS-KO/M, GS-KO/LM) groups did not differ in their response to the increasing intravenous ammonia challenge (Supporting Fig. S7). The maximal ammonia-detoxifying capacity of the control group was ∼160 μmol/hour, i.e., similar to that obtained upon enteral infusion, whereas that of GS-KO/L or GS-KO/M mice was 4-fold to 5-fold lower. MSO treatment decreased GS activity mainly through a 2-fold to 3-fold decrease in apparent affinity (K0.5) for ammonia. The effects of genetic elimination and pharmacological inhibition of GS appeared additive because GS-KO/0.5 mice were particularly sensitive to MSO.
ARTERIOVENOUS DIFFERENCES IN GLUTAMINE AND AMMONIA CONCENTRATIONS
Figure 6A shows that portal glutamine concentration was, irrespective of genotype or treatment and across a wide range of glutamine concentrations, ∼30% lower than arterial glutamine concentration, in agreement with the well-established glutaminolytic activity of the intestine.18, 19 MSO treatment was responsible for a very pronounced decrease in plasma glutamine concentrations, but the overlap between control, GS-KO, and dexamethasone-treated mice was extensive. The concentration of glutamine in the inferior caval vein was ∼10% higher than the arterial concentration, again across a wide range of concentrations (Fig. 6B) and in agreement with its net production of glutamine.7 The plasma concentrations in the subgroups included in control mice (fed and postabsorptive control and GS-KO/0.5), in GS-KO mice (GS-KO/L, GS-KO/M, and GS-KO/LM), and in dexamethasone-treated mice (control and GS-KO/0.5) are shown separately in Supporting Fig. S8.
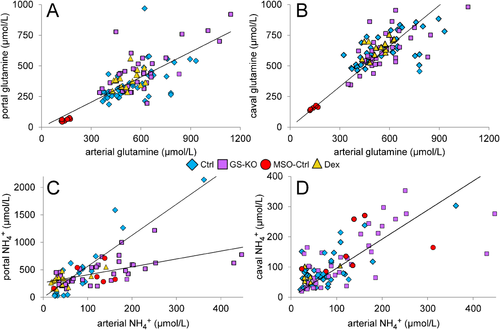
The concentration of ammonia in the inferior caval vein was similar to that in the arterial system in all groups investigated (Fig. 6D). Because of the high glutaminolytic activity in the intestine, the portal concentration of ammonia in control and dexamethasone-treated mice was 5-fold to 6-fold higher than the arterial concentration (Fig. 6C). However, relative to control mice, the intestines of GS-KO/L, GS-KO/M, and GS-KO/LM mice contributed ∼3-fold less ammonia to the portal vein (P < 0.001). The values of the separate subgroups can be found in Supporting Fig. S9.
WHOLE-BODY GLUTAMINE AND UREA SYNTHESIS IN GS-DEFICIENT MICE
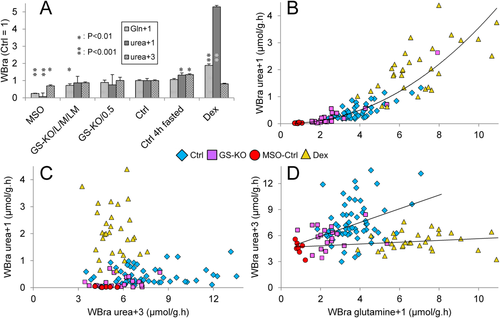
The relation between glutamine-bound ammonia disposal as urea and glutamine production was investigated with 5-15N-l-glutamine (“glutamine+1”) and 18O-,13C-urea (“urea+3”). Steady-state blood concentrations of glutamine+1 were attained after 30 minutes and those of urea+3 after 90 minutes. Accordingly, blood samples were taken at 90 minutes. Figure 7A shows that the MSO treatment decreased whole-body glutamine synthesis to ∼25% of controls, that GS-KO/L and GS-KO/M mice produced ∼70% of control mice, that 4 hour–fasted and fed GS-KO/0.5 mice had similar rates of glutamine synthesis as control mice, and that treatment for 16 hours with dexamethasone increased glutamine synthesis ∼2-fold. 15N-urea (“urea+1”) synthesis from glutamine+1 was only 7% of controls in MSO-treated mice, similar to controls in all GS-KO mice; ∼1.3-fold increased in postabsorptive mice; and >5-fold increased in dexamethasone-treated mice. The whole-body rate of appearance of glutamine+1 and urea+1 obeyed a power relation (Fig. 7B); that is, the fraction of newly synthesized glutamine (≈ detoxified ammonia) that was metabolized to urea (disposal) increased as more glutamine was produced. The relative activities of mice of the respective genotypes and experimental conditions are shown separately in Supporting Fig. S10. The contribution of urea+1 to urea+3 (total urea) synthesis was complex (Fig. 7C). Whole-body urea synthesis only increased in postabsorptive mice (1.3-fold). More striking, the dexamethasone-induced ∼5-fold increase in urea+1 synthesis from glutamine+1 was not accompanied by an increase in urea+3 synthesis (Fig. 7C). The data for the respective subgroups of mice are shown separately in Supporting Fig. S11. The synthesis of glutamine and total urea did not correlate (Fig. 7D; Supporting Fig. S12).
Discussion
Using genetic and pharmacological approaches to modulate GS activity in mice, we show that ∼35% of enteral ammonia is detoxified by hepatic GS and ∼35% by the urea-cycle enzymes and that the remaining ∼30% is not cleared by the liver, independent of portal ammonia concentrations. Maximal ammonia-detoxifying capacity in control mice is ∼160 μmol/hour. Systemic ammonia detoxification is almost entirely dependent on glutamine synthesis. Disposal of this glutamine-bound ammonia through glutaminase-dependent ammonia generation and carbamoylphosphate synthetase-1 (CPS1)–mediated detoxification in hepatic mitochondria depends steeply on the whole-body rate of glutamine synthesis and differs ∼70-fold between conditions with little (MSO treatment) and ample (dexamethasone treatment) glutamine synthesis. This finding demonstrates that glutamine is spared when its availability is low. Another novel finding is that chronic GS deficiency, in particular that in liver, decreases whole-body muscle-to-fat ratio and increases myostatin expression in muscle, as in cirrhosis of the liver and hyperammonemia.13 A recent study of similar liver-specific GS-deficient mice15 showed that mild but chronic hyperammonemia also causes cerebral oxidative stress and behavioral changes. Although both studies observed a similar ∼2-fold increase in blood ammonia concentration in mice with a hepatic GS deficiency, they differed in basal blood ammonia concentration, which was >5-fold higher in the C57Bl6 mice that Qvartskhava et al.15 used than in the FVB mice we used.
PHENOTYPE OF GS-KO/L MICE
Elimination of hepatic GS expression caused only mild hyperammonemia but was associated with marked pericentral macrovesicular steatosis and a pronounced decline in the muscle-to-fat volume ratio. The sarcopenia was associated with increased myostatin expression. Loss of hepatic GS expression, steatosis, and sarcopenia are characteristic features of cirrhosis.13, 20 Their co-occurrence in GS-KO/L mice suggests a causal role for pericentral GS and suggests that mice with a homozygous or hemizygous GS deficiency in the liver are a promising animal model to study these sequels of liver disease.
RESPONSE OF GS-DEFICIENT MICE TO AMMONIA CHALLENGES
Although muscle and liver are the main ammonia-detoxifying organs,4, 7, 21 GS-KO/M and GS-KO/L mice still tolerate an ammonia challenge of ∼20 μmol/hour if administered intravenously (Fig. 5) and even ∼50 μmol/hour if administered enterally (Fig. 3). The more severely reduced ammonia-detoxifying capacity of MSO-treated mice implies a contribution of GS activity outside the liver and muscles. The higher tolerance for enterally administered ammonia reflects the contribution of urea synthesis to hepatic ammonia detoxification. Relative to the fed state, the release of ammonia into the portal vein during the postabsorptive state increases with 30 (control) to 60 μmol/hour (GS-KO/L) (Fig. 2). The interposition of an uncompromised liver scavenges ∼70% of this ammonia (Fig. 4),21 but in GS-KO/L mice the postabsorptive ammonia challenge approaches the maximal enteral challenge the liver can cope with (Fig. 3). Humans and rats secrete ∼50% of the ammonia produced by the kidneys into the systemic circulation.5, 22 Under standard conditions, as in this study, ammonia secretion into the renal vein of mice amounts to ∼10 μmol/hour, but the 4-fold to 7-fold increased renal ammonia production and secretion during metabolic acidosis,14, 15 as develops during, e.g., septicemia,23 would most likely render GS-KO/L or GS-KO/M mice hyperammonemic.
GS ACTIVITY PROVIDES FOR SYSTEMIC HIGH-AFFINITY AMMONIA DETOXIFICATION
Pharmacological or genetic depletion of GS activity reduced both the capacity and the affinity of the ammonia-detoxifying mechanism of the body substantially (Figs. 3-5) but had only a minor effect on total urea synthesis (Fig. 7). The ∼5-fold lower affinity for ammonia in GS-deficient mice renders it similar to the affinity of the urea cycle (CPS1) for ammonia and indicates that urea synthesis is responsible for the remaining ammonia-detoxifying capacity. As expected, depletion of GS activity caused a decrease of the circulating concentration of glutamine to 65%-70% of controls (Figs. 1 and 2). However, ammonia release into the portal vein also decreased (Fig. 6C), which confirms the earlier finding that fractional extraction of glutamine by the gut is fixed and not dependent on the glutamine load.18, 19
PERICENTRAL HEPATOCYTES ARE ∼20-FOLD MORE EFFICIENT AT DETOXIFYING AMMONIA THAN PERIPORTAL HEPATOCYTES
Control mice cleared ∼70% of the hepatic ammonia load; that is, ∼30% passed the liver, irrespective of the afferent ammonia concentration. Although reported, this incomplete clearance of ammonia by the liver is usually not explicitly acknowledged.19, 24, 25 Hepatic ammonia clearance in GS-KO/L mice was ∼50% of that in control mice so that urea and glutamine synthesis each accounted for the removal of ∼35% of the ammonia that reached the liver. The two-layer-thick cuff of GS-positive hepatocytes around the central veins represents only ∼5% of all hepatocytes in mouse liver.26 Pericentral hepatocytes are, therefore, ∼20-fold more efficient per cell at removing ammonia than periportal hepatocytes. Accordingly, the downstream, pericentral hepatocytes are well equipped to remove residual ammonia from the hepatic circulation4, 27 because they express the ammonia transporters RhBG28 and APQ9,29 the glutamate transporter SLC1A2,30, 31 the glutamate-producing enzyme ornithine aminotransferase,32 the glutamine-producing enzyme GS,33, 34 and the glutamine transporter SLC38A3.35
PERIPORTAL UREA SYNTHESIS FROM AMMONIA FUNCTIONS AT ∼10% OF ITS CAPACITY
The K0.5 of ammonia for urea formation in perfused rat liver is 1-2.5 mmol/L36, 37 so that at 200-400 μmol/L ammonia in the portal vein detoxification of ammonia to urea proceeds at only ∼10% of its maximum rate under normal circumstances. This estimate is confirmed by measurements of the hepatic free ammonia concentration, the real substrate of CPS1: the liver of fed mice contains 200-500 μmol ammonia/kg,38, 39 or 2-5 μmol NH3/kg at cytoplasmic pH 7.0,40 while the K0.5 of NH3 for CPS1 in suspended mitochondria is 12-15 μmol/L.39 It is usually argued that the low-affinity, high-capacity detoxification of ammonia to urea allows for instantaneous and large increases in the rate of ammonia detoxification upon a challenge. It was, therefore, unexpected that the detoxification of an enteral ammonia challenge was equally dependent on urea and glutamine synthesis. If the ammonia challenge originated outside the portal-drained viscera, detoxification was entirely dependent on glutamine synthesis.
PERIPORTAL HEPATOCYTES CATABOLIZE GLUTAMINE
The whole-body rate of glutamine synthesis correlates tightly with the conversion rate of newly synthesized glutamine to urea (Fig. 7). The prominent role of periportal hepatocytes in glutamine catabolism is exemplified by mice in which the periportal enzymic phenotype is genetically suppressed by a hepatocyte-specific deletion of the adenomatous polyposis coli gene.41 In these mice, hepatic and plasma glutamine concentrations increase ∼12-fold and ∼25-fold, respectively, whereas suppression of the pericentral enzymic phenotype by hepatocyte-specific deletion of β-catenin has no such effect.42 Accordingly, periportal hepatocytes are well equipped to take up and metabolize glutamine4, 27 because they express the glutamine transporter SLC38A5,35 glutaminase-2 (EC 3.5.1.2),43, 44 and all enzymes of the urea cycle.45, 46 The trans-membranous Na+ gradient mediates the uptake of >70% of plasma glutamine and causes it to accumulate intracellularly to 3-5 mmol/kg.35, 47 A further pH-dependent 4-fold to 5-fold concentrative transport of glutamine occurs across the mitochondrial membrane47, 48 to accommodate the relatively high Michaelis constant of glutaminase-2 in situ (∼6 mmol/L).49 Mouse liver glutaminase, which misses the first exon, is not activated by ammonia.50 It is not known to what extent glutamate dehydrogenase contributes to intramitochondrial ammonia production, but the steep dependence of glutamine-dependent urea synthesis on prior glutamine synthesis without change in total urea synthesis (Fig. 7) suggests that glutaminase-2 and glutamate dehydrogenase have complementary roles with respect to mitochondrial ammonia production.
STIMULATION OF GLUTAMINE SYNTHESIS MAY ENHANCE DISPOSAL OF AMMONIA
The findings that glutamine-dependent ammonia disposal (through glutaminase) was negligible if little glutamine was synthesized (MSO treatment) and prominent if glutamine synthesis was stimulated (dexamethasone treatment) and that plasma ammonia concentrations were relatively low in dexamethasone-treated mice (Fig. 6) show that the combination of enhanced glutamine synthesis in the periphery and enhanced glutamine catabolism in (periportal) hepatocytes functions as the high-affinity ammonia-detoxifying system of the body. We, therefore, hypothesize that stimulation of glutamine synthesis by, e.g., glutamate supplementation is a promising strategy to treat hyperammonemia.
Acknowledgment
We thank Arno van Cruchten, Cindy Kunne, Wil Labruyere, and Rudi de Waart (Amsterdam); Gabrie ten Have and Chiel de Theije (Maastricht); and our students Florian Huiskes, Marcel Jansen, Harald Moolhuijzen, Dagmar Tolenaars, and Nicole Worms for their contributions to this study.


