Nitric oxide upregulates microglia phagocytosis and increases transient receptor potential vanilloid type 2 channel expression on the plasma membrane
Funding information: Canadian Institutes of Health Research, Grant/Award Number: MOP-133504
Abstract
Microglia phagocytosis is critical for central nervous system development, and dysregulation of phagocytosis may contribute to a variety of neurological disorders. During initial stages of phagocytosis, microglia display increased nitric oxide (NO) production via inducible nitric oxide synthase (iNOS) activity and amplified calcium entry through transient receptor potential vanilloid type 2 (TRPV2) channels. The present study investigated the regulatory role of iNOS/NO signaling in microglial phagocytosis and TRPV2 channel activation using phagocytosis assay, calcium imaging, patch clamp electrophysiology, immunocytochemistry, and immunoblot assays. Results showed that primary microglia from iNOS-knockout (iNOS−/−) mice exhibited substantial deficits in phagocytic capacity and TRPV2 channel activity relative to wild-type (WT) controls. Specifically, iNOS−/− microglia displayed a lower level of TRPV2 protein localized on the plasma membrane (PM) without any significant change in the mRNA levels of Fc-gamma receptors and TRPV2. In addition, iNOS−/− microglia, unlike their WT controls, failed to elicit a calcium influx in response to application of the TRPV2-agonist 2-aminoethoxydiphenyl borate (2APB). Importantly, the phagocytic capacity and the PM expression and activity of TRPV2 in iNOS−/− microglia were largely corrected by pretreatment with NO-donors. Accordingly, the 2APB-evoked calcium influx and the PM expression of TRPV2 in WT microglia were significantly decreased by selective inhibition of iNOS, protein kinase-G (PKG), or phosphoinositide-3-kinase (PI3K), respectively. Together, results from this study indicated that iNOS/NO signaling upregulates microglial phagocytosis and increases TRPV2 trafficking to the PM via PKG/PI3K dependent pathway(s).
1 INTRODUCTION
As the primary immune cells within the central nervous system (CNS), microglia actively engage in phagocytosis under physiological as well as pathological conditions (Shemer, Erny, Jung, & Prinz, 2015). During CNS development, microglia phagocytosis influences neurogenesis as well as synaptogenesis (Aarum, Sandberg, Haeberlein, & Persson, 2003; Harry & Kraft, 2012; Sierra et al., 2010). For example, microglia display phagocytic activity engulfing neuronal precursor cells to regulate the number of neurons within the CNS (Marı́n-Teva et al., 2004; Sierra et al., 2010). Likewise, in the adult CNS, the elaborate processes of microglia are intimately associated with dendritic spines and neuronal synapses, such that phagocytosis of these neuronal structures can occur in response to aberrant synaptic transmission (Casano & Peri, 2015; Schafer, Lehrman, & Stevens, 2013). Under pathological conditions within the CNS such as pathogen infiltration or traumatic brain injury, microglia increase phagocytosis to engulf pathogens or cellular debris from injured neurons (Fu, Shen, Xu, Luo, & Tang, 2014). Conversely, decreased phagocytosis has been observed in the progression of neurological disorders such as Parkinson's disease (Park, Paik, Jou, & Park, 2008), Alzheimer's disease (Chung, Brazil, Soe, & Maxfield, 1999), prion disease (Ciesielski-Treska et al., 2004), and Rett syndrome (Derecki et al., 2012). Therefore, microglial phagocytosis is critical for shaping the neuronal networks during CNS development and adulthood, while also protecting against the progress of neurological disorders.
Microglia phagocytosis occurs in response to changes in their microenvironment. Recent studies have correlated nitric oxide (NO) production to the initial increase in microglial phagocytosis (Kakita et al., 2013; Kraus, Wolff, Elstner, & Heilmann, 2010; Scheiblich & Bicker, 2016). For example, responding to an increase of TNFα and IL1β, microglia increase the expression of inducible nitric oxide synthase (iNOS) and catalyzes the production of NO (Kraus et al., 2010; Sheng et al., 2011). As a highly diffusible and transient signaling molecule (C. Bogdan, 2001; Pautz et al., 2010), NO regulates cellular functions primarily by activating soluble guanylyl cyclase (sGC) production of cyclic guanosine monophosphate (cGMP) and ultimately increasing protein kinase-G (PKG) activity (C. Bogdan, 2001; Christian Bogdan, 2015; Förstermann & Sessa, 2012). However, the molecular pathways by which NO signals phagocytosis in microglia remains unclear. Studies report that the transient receptor potential vanilloid type 2 (TRPV2) ion channel is critical for phagocytosis in macrophages (Lévêque et al., 2018; Link et al., 2010; Santoni & Amantini, 2013), and more recently this has also been shown in microglia (Hassan et al., 2014). As a member of the TRP channel family, TRPV2 is largely localized on the endoplasmic reticulum (ER) of phagocytes under resting conditions (Nagasawa & Kojima, 2012; Nagasawa, Nakagawa, Tanaka, & Kojima, 2007). In response to increased cytokines such as insulin-like growth factors, TRPV2 proteins on the ER membrane are translocated to the plasma membrane (PM) in a phosphoinoside-3-kinase (PI3K)-dependent manner (Nagasawa et al., 2007; Nagasawa & Kojima, 2012; Perálvarez-Marín, Doñate-Macian, & Gaudet, 2013). Tetrameric TRPV2 proteins on the PM of phagocytes form nonselective cation channels, mediating a large influx of calcium and facilitating phagocytosis (Hassan et al., 2014; Lévêque et al., 2018; Link et al., 2010; Santoni & Amantini, 2013).
Given the important roles of NO and TRPV2 in cell phagocytosis, the present study sought to determine whether NO signaling increases TRPV2 channel activity to enhance phagocytosis. Using primary wild type (WT) and iNOS-knockout (iNOS−/−) microglia as well as the mouse microglial cell line BV2, we characterized differences in phagocytic capacities between WT and iNOS−/− microglia and determined the molecular mechanism by which NO regulates TRPV2 channel activity.
2 MATERIALS AND METHODS
2.1 Primary microglia cultures
WT (n = 189) and iNOS−/− (n = 204) postnatal days 0–4 pups from 23 WT and 25 iNOS−/− litters were used for acquiring primary microglia. Briefly, pups were decapitated, and their brains were removed quickly and placed in ice cold Leibowitz L-15 media containing 100 mg/mL bovine serum albumin (BSA) and 1× penicillin/streptomycin (P/S) antibiotics (ThermoFischer Scientific, Waltham MA). Mouse cortices were dissected and then homogenized by pipetting through a 10 mL pipet, 1 mL pipet, and a 200 μL pipet sequentially. Homogenized cortices were filtered through a 70 μm nylon filter. The filtrate was centrifuged at 900g for 4 min at room temperature. The supernatant was aspirated, and the cells were resuspended in Dulbecco's modified eagle's medium (DMEM) containing 1× P/S, and 10% fetal bovine serum (FBS) (ThermoFischer Scientific). The cortical cells were grown in T-75 flasks with approximately three cortices per flask, under normal conditions of 5% CO2 at 36°C. Culture media was completely replaced in the T-75 flasks 5 days after plating, and then every 3 days until a confluent astrocyte monolayer formed with prominent microglia colonies on the surface. T-75 flasks containing the astrocyte-microglia co-culture were placed on a shaker at 36°C and 200 rpm for 2 hr. After shaking, the supernatant containing microglia cells was removed, centrifuged at 900g for 4 min, and resuspended in fresh culture media. Isolated microglia were plated at 5 × 10⁴ cells/mL in different dishes for experiments.
2.2 Drug treatments
To control for TRPV2 channel expression, culture media was replaced with serum-free DMEM containing 1× P/S 2 hr before running experiments (Hisanaga et al., 2009; Kanzaki et al., 1999; Nagasawa et al., 2007). Fast-release NO-donors were used for all experiments except for phagocytosis, where a slow-release NO-donor was used. The following fast-release NO-donor drugs were treated at the following concentrations: S-nitroso-N-acetyl-dl-penicillamine (SNAP) 250 μM, and sodium nitroprusside (SNP) 300 μM (Santa Cruz Biotechnology, Dallas TX); slow release NO-donor: diethylenetriamine NONOate (NOC18) 100 μM (Santa Cruz Biotechnology); TRPV agonist: 2-aminoethoxydiphenyl borate (2APB) 250 μM (Santa Cruz Biotechnology); TRPV1 agonist: capsaicin 2 μM (Tocris Bioscience, Oakville ON); TRP inhibitor: ruthenium red (RR) 3 μM (Enzo Life Sciences, Burlington, ON); TRPV2 inhibitor: Tranilast 75 μM (Tocris Bioscience); nitric oxide synthase (NOS) inhibitor: G-nitro-l-arginine-methyl ester (LNAME) 100 μM (Santa Cruz Biotechnology); iNOS inhibitor: 1400W 5 μM (Tocris Bioscience); kinase inhibitors: Arginyl-lysyl-arginyl-alanyl-arginyl-lysyl-glutamic acid (PKGi) 10 μM, (Santa Cruz Biotechnology), and LY294002 (PI3Ki) 10 μM (Cayman Chemical, Ann Arbor, MI). Concentrations of SNAP (Gu, Lynch, & Brecher, 2000; Kawasaki et al., 2003; Kopec & Carroll, 2000), 2APB (Hu et al., 2004; Juvin, Penna, Chemin, Lin, & Rassendren, 2007), and tranilast (Aoyagi, Ohara-Imaizumi, Nishiwaki, Nakamichi, & Nagamatsu, 2010; Hisanaga et al., 2009; Mihara et al., 2010) were adapted from previous literature and the optimal concentrations were determined by examining the dose–response on rhod4 fluorescence in BV2 microglia (Figure S2).
2.3 Phagocytosis assay
WT and iNOS−/− primary microglia were treated with NOC18, a slow NO-donor more suitable for the longer assay period, 20 min before addition of latex-rabbit immunoglobulin-G (IgG) fluorescein isothiocyanate (FITC) beads (Cayman Chemical), at 1:500 for 2 hr to permit phagocytosis. After 2 hr incubation at normal condition, phagocytosis assay buffer was used to wash away debris, culture media and unbound beads. Two minutes incubation of trypan blue solution was used to quench IgG-FITC-bead surface fluorescence to help distinguish between phagocytosed beads and non-phagocytosed beads. 4′,6-diamidino-2-phenylindole (DAPI) staining was then conducted. Microglia IgG-FITC-bead fluorescence as well as differential interference contrast (DIC) images were taken using the EVOS FL Auto 2 cell imaging system under ×40 magnification. Cell surfaces from DIC images were used as a membrane marker to localize and count engulfed IgG-FITC-beads within microglia. Experimental N-values represent the number of individual wells analyzed per treatment. Cell images were analyzed using the FIJI open source software (Schindelin et al., 2012) and graphed using Excel.
2.4 NO-imaging
For NO-imaging, primary microglia were cultured on 24-well plates, and DMEM medium was washed out using the same extracellular solution for electrophysiology. Microglia were treated with 4 μM DAX-J2 (AAT Bioquest, Sunnyvale, CA) for 45 min at room temperature, and then excess DAX-J2 was washed out using the extracellular solution. Latex-rabbit IgG-FITC-beads were pretreated at 1:500 for 20 min before live cell imaging. NO imaging was performed using the EVOS FL Auto 2 system under ×20 magnification. DAX-J2 fluorescence was recorded for 1.5 hr and the total fluorescence was quantified using the FIJI open source software (Schindelin et al., 2012) and graphed using Excel.
2.5 Reverse transcription quantitative polymerase chain reaction (RT-qPCR)
Total RNAs were obtained from BV2 cells or primary WT and iNOS−/− microglia using RNeasy Mini Kit (Qiagen, Toronto, ON) following manufacturer's instructions. Total RNAs isolated from the cortical tissues of three 7-week-old male WT or iNOS−/− mice were also used for examining endogenous Fc-gamma receptors (FcγRs) I and III expression. Reverse transcription of 1 μg extracted RNA to cDNA using qScript™ XLT cDNA SuperMix (Quantabio, Beverly, MA) was carried out as per manufacturer's instructions. Quantitative PCR was conducted using PerfeCTa® SYBR® Green FastMix® for iQ (Quantabio, Beverly, MA), 25 ng of cDNA template, and 500 nM of forward and reverse primers specific to the gene of interest. Murine forward and reverse primers for the following genes of interest were used; TRPV1 forward 5′GAGGCTGTTCCCTGTTCCTT3′, reverse 5′GATGATGTTGATCCCTGGGC3′, TRPV2 forward 5′GGTATGGGTGAGCTGGCTTTT3′, reverse 5′AGGACGTAGGTGAGGAGGAC3′, TRPV3 forward 5′ATGAATGCCCACTCCAAGGAGATGGTG3′, reverse 5′AAACGCATAGAGGGTGGTTTTGCTATTGC3′, Fc-γ receptor I (FcγRI) forward 5′TCTACTGGTGTGAGGTAGCC3′, reverse 5′GGGGGTTGGGAGAACACTT3′, FcγRIII forward 5′CCCCTCTACCCAAAAGGGAC3′, reverse 5′CACCGATTTCCCACCTCAGT3′. RT-qPCR reactions were run in triplicate with a no-template control on a BioRad MyiQ Single-colour Real-Time PCR detection system (Biorad, Mississauga, ON), in 25 μL reaction volumes with a 40-cycle protocol as per the manufacturer's instructions. The difference in cycle thresholds (ΔCt) between the reference gene β-actin forward 5′CTGTCCCTGTATGCCTCTG3′, reverse 5′ATGTCACGCACGATTTCC3′, and the genes of interest were graphed using Excel.
2.6 Calcium imaging
For calcium imaging in microglial cultures, DMEM culture media was washed out with the same bath solution used in electrophysiology. Rhod-4AM (AAT Bioquest, Sunnyvale, CA) was equilibrated to room temperature for 1 hr before incubation of microglia cultures. Cells were bathed in 3 μM rhod-4AM under normal conditions and excess rhod-4AM was washed out using bath solution 1 hr after incubation. Drug pretreatments were given 20 min before imaging. Calcium imaging of microglia grown on 35 mm glass bottom culture dishes was performed using Olympus FV1000 microscope under ×20 magnification imaged every 3 s, whereas calcium imaging of microglia grown in 24-well plates was performed using the EVOS FL Auto 2 system under ×20 magnification every 10 s. Baseline levels of calcium fluorescence were recorded before test drug application, and cellular calcium fluorescence responses were normalized to the average baseline level in every cell within the imaging field using the FIJI open source software (Schindelin et al., 2012). The averaged value of the normalized calcium fluorescence intensity of all test cells was plotted along with the time of imaging using Excel.
2.7 Voltage-clamp recordings
Primary microglia plated on 35 mm dishes were kept in bath solution containing (in mM): 130 NaCl, 5 KCl, 3 MgCl2, 2 CaCl2, 5 glucose, and 10 4-(2-hydroxyethyl)-1-piperazineethanesulfonic acid (HEPES). Potassium free solution contained (in mM): 135 NaCl, 3 MgCl2, 2 CaCl2, 10 HEPES, and 5 glucose. The pH of all solutions was adjusted to 7.4 using NaOH and the osmolarity was adjusted to ~300 mOsm with glucose. The intracellular solution contained (in mM): 140 K-gluconate, 8 NaCl, 1 MgCl2, 10 cesium-BAPTA, and 10 HEPES, the pH of 7.4 was adjusted using cesium hydroxide. Cesium was used in the intracellular solution to block delayed rectified potassium channels, which can mask the TRP conductance when recording. Patch pipettes were pulled from thin-wall glass filaments from World Precision Instruments, Inc. (Sarasota, FL) using a two-stage glass microelectrode puller (Tritech Research, Los Angeles, CA), with final input resistance between 3 and 5 MΩ. Whole-cell recordings were performed at room temperature using MultiClamp 700B Amplifier and Digidata 1440A Low-noise Data Acquisition System (Molecular Devices, Sunnyvale, CA). Whole-cell voltage-ramps from –100 mV to +100 mV were applied over 150 ms from a holding potential of 0 mV, every 10 s. Recordings were performed on microglial cultures bathed in potassium-free solution, to remove inward rectified potassium channel conductance which may mask a TRP conductance. Drug solutions were perfused toward the recording cell using a gravity perfusion system delivering solution at 2 mL/min. The average of five ramps were taken for each cell after the drug response stabilized. Capacitance was recorded for each cell and ramps were reported in current density (pA/pF). Experimental n-values represent number of cells recorded over different days.
2.8 Immunocytochemistry
Microglia were grown on poly-d-lysine coated coverglass placed in 24-well plates. Twenty minutes after specific treatments, cells were fixed with 4% paraformaldehyde (Sigma-Aldrich, Oakville, ON), and washed once with 0.1 M glycine, followed by two washes with phosphate-buffered saline (PBS) for 10 min each. Fixed cells were permeabilized by incubation with 0.1% triton in PBS for 5 min. Guinea pig TRPV2 antibody (Alomone Labs, Jerusalem Isreal, 1:100), and rat CD11b antibody (AbD Serotec, Hercules, CA, 1:200), were incubated overnight, followed by three washes with PBS for 10 min each. Alexa Fluor 488 anti-guinea pig and Cy3 anti-rat secondary antibodies (Jackson Immunoresearch, Burlington, ON), were incubated at 1:500 dilution for 45 min, respectively. After incubation with secondary antibodies, microglia were washed three times with PBS for 10 min each, and then incubated with DAPI (Sigma-Aldrich, Oakville, ON), for 15 min at room temperature.
Cells were washed twice with PBS for 10 min each wash. Finally, for cells plated on coverglass, Fluoromount-G (Electron Microscopy Sciences, Hatfield, PA), was applied to each coverglass before mounting cells on glass slides. For cells plated in 24-well plates, Fluoromount-G was applied to each well and covered with a coverslip. Microglia TRPV2, CD11b, and DAPI fluorescence images were taken using either the Olympus FV1000 or the EVOS FL Auto 2 cell imaging system under ×20 and ×40 magnification. Experimental N-values represent the number of cell samples analyzed per treatment. For examining the PM/cytosol ratio of TRPV2 fluorescence, image analyses were conducted using the FIJI open source software, and the image analysis procedure was described in Figure S1.
2.9 Biotinylation of surface proteins
After treatments, BV2 microglia were washed 3× with PBS before being homogenized into Eppendorf tubes using 1 mL of PBS. Microglia were centrifuged at 13,000g for 15 s and the supernatant was aspirated. Cells were incubated with EZ-Link™ Sulfo-NHS-SS-Biotin (ThermoFischer Scientific), at room temperature for 30 min with constant shaking. Biotin-bound microglia were washed with PBS and centrifuged at 13,000g to remove the supernatant. Microglia were incubated with NP-40 lysis buffer at 4°C with constant shaking for 30 min, followed by the addition of streptavidin (Sigma-Aldrich, Oakville, ON), in 4°C for 1 hr. Microglia were centrifuged at 13,000g for 5 min and the supernatant containing cytosolic proteins were removed and stored at –80°C. Biotinylated proteins in the PM bound to streptavidin were washed 4× with PBS removing the supernatant each time before incubating sample in radioimmunoprecipitation assay buffer for 1 hr at room temperature with constant shaking. Samples were centrifuged at 13,000g for 5 min and the remaining supernatant containing PM proteins were collected and stored at –80°C before running western blots.
2.10 Western blot
BV2 and/or WT cortical tissue proteins were measured using Bradford assay (Bio-Rad, Hercules, CA). Proteins were run through SDS-PAGE using an 8% polyacrylamide gel at 100 V before being transferred to a polyvinylidene difluoride membrane. Membranes were blocked using 5% BSA solution for 1 hr before being incubated with TRPV1 antibody at 1:200 dilution, or TRPV2 antibody at 1:2,000 dilution (Alomone Labs, Jerusalem, Israel). Secondary anti-rabbit IgG horseradish peroxidase (HRP) conjugate (1:5,000) or Guinea-pig IgG HRP (1:5,000) (Jackson Immunoresearch, Burlington, ON), was then incubated for 1.5 hr. Protein isolated from male, 7-week-old WT cortical tissue was used as a positive control for TRP channel expression. For biotinylated surface protein, the PM housekeeping protein Na+/K+ ATPase (1:10,000; Abcam Inc., Toronto, ON) was used to normalize PM TRPV2 expression. For total and cytosolic proteins, TRP channel expression was normalized to the housekeeping protein glyceraldehyde 3-phosphate dehydrogenase (GAPDH; 1:10,000; Abcam Inc.). Experimental N-values represent the number of individual wells in which lysates were collected from per treatment.
2.11 Statistics
Statistical analyses were done using Graphpad Prism 6. All statistic results were shown as mean ± SEM. One-way or two-way ANOVAs were conducted using Tukey's or Bonferroni post hoc comparison, respectively. Unpaired two-tailed t test was used when only comparing two groups. All statistical significance was determined from at least N = 3 and a p value of less than .05 (*p < .05, **p < .01, ***p < .001, ****p < .0001).
3 RESULTS
3.1 NO upregulates phagocytic activity of WT and iNOS−/− microglia
To examine the importance of NO for microglial phagocytosis, we incubated WT and iNOS−/− microglia with FITC-IgG-latex beads in the absence (control) or presence of NOC18, a slow-release NO-donor (Figure 1A). Fluorescence analyses indicated that under control conditions, iNOS−/− microglia displayed significantly less FITC-bead occupancy and fluorescence intensity compared to WT controls (Figure 1B,C). NOC18 treatment significantly increased FITC-bead occupancy and fluorescence intensity in both WT and iNOS−/− microglia; however, iNOS−/− microglia displayed less FITC-bead occupancy and fluorescence intensity relative to WT cells (Figure 1B, C). Nevertheless, NOC18 restored the phagocytic capacity of iNOS−/− microglia to the control level of WT microglia (Figure 1B, C). These results indicate that NO signaling fundamentally regulates microglia phagocytosis.
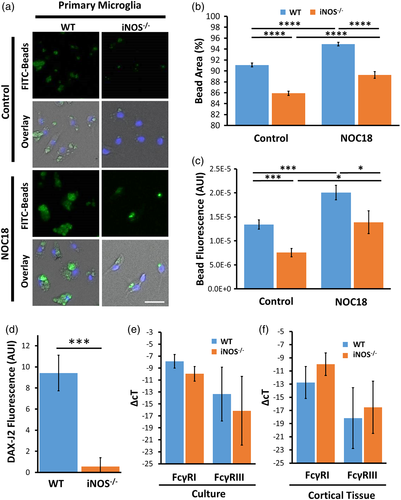
To examine the impact of latex-IgG-beads on NO production in WT and iNOS−/− microglia, we measured NO levels by means of DAX-J2 fluorescence imaging 1.5 hr after IgG-beads incubation of the cells. Analyses revealed significantly higher NO production in WT microglia compared to iNOS−/− microglia (Figure 1D). On the other hand, RT-qPCR analyses demonstrated similar mRNA levels of the phagocytic receptors FcγRI and FcγRIII within isolated WT and iNOS−/− microglia, as well as in 7-week-old male WT and iNOS−/− mouse cortices (Figure 1E,F). Together, these data indicated that the defective phagocytosis of iNOS−/− microglia was not due to decreased expression of phagocytic receptors but because of insufficient NO production.
3.2 NO-donor restores a 2APB-evoked calcium influx in iNOS−/− microglia
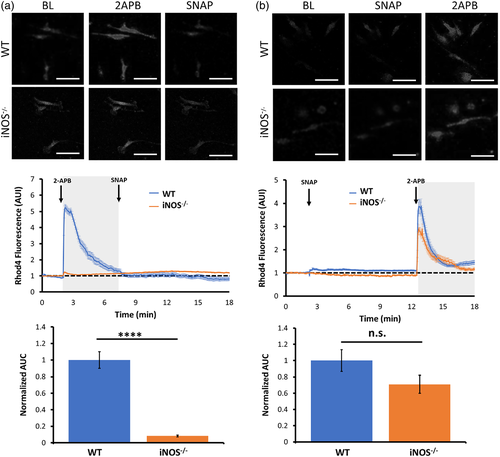
It was reported that TRPV1 and TRPV2, but not TRPV3 channels, are expressed in mouse microglia (Cao & Ramsey, 2016). Considering that the TRPV2 channel-mediated calcium entry is essential for phagocytosis (Hassan et al., 2014; Lévêque et al., 2018; Link et al., 2010; Santoni & Amantini, 2013) we carried out calcium imaging to examine the effect of 2APB, a TRPV1-3 agonist, on intracellular calcium levels in WT and iNOS−/− microglia. Calcium imaging analyses showed that 2APB induced a large but transient calcium influx in WT microglia, but not in iNOS−/− microglia (Figure 2A). In the presence of 2APB, application of SNAP had no significant effect on calcium influx in WT microglia or iNOS−/− microglia (Figure 2A). Interestingly, 5–10 min after administration of the rapid-release NO-donor SNAP, application of 2APB to iNOS−/− microglia induced a large calcium influx with an amplitude comparable to that in WT microglia (Figure 2B). These results indicated that the 2APB-induced calcium influx in mouse microglia depends on the presence of NO signaling.
3.3 NO-donor induces a TRP channel conductance in iNOS−/− microglia
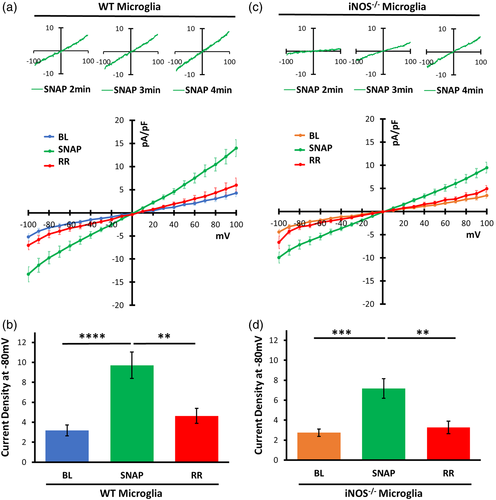
TRPV2 channels mediate a nonselective cation conductance with a high calcium permeability. To further examine if the 2APB-elicited calcium influx in mouse microglia is mediated by TRPV channels, we performed whole-cell voltage-clamp recordings in both WT and iNOS−/− microglia. Under our experimental conditions, applying a voltage-ramp to the naïve WT and iNOS−/− microglia revealed a low-amplitude basal transmembrane current (Figure 3A, B, blue and orange traces, respectively). The amplitude of transmembrane current in WT microglia increased significantly 1–2 min after perfusion of SNAP, whereas in iNOS−/− microglia, the current amplitude started to increase 3–4 min after SNAP perfusion (Figure 3A, B, green traces). This SNAP-induced current displayed a linear voltage–current relationship and reversed at 0 mV, signifying a nonselective cation conductance. Importantly, the SNAP-induced conductance in both WT and iNOS−/− microglia was significantly inhibited by ruthenium red (RR), a nonselective TRPV channel inhibitor (Figure 3A, B, red traces). These results confirmed that NO signaling induces a TRPV channel mediated nonselective cation current in primary mouse microglia.
3.4 2APB induces calcium influx into microglia primarily through TRPV2 channels in an NO-signaling dependent manor
A previous study reported that 2APB selectively activates TRPV2, but not TRPV1/3 channels, in mouse microglia (Cao & Ramsey, 2016). To verify whether 2APB-induced calcium entry is specifically through TRPV2 channels, we performed calcium imaging in mouse microglia in the presence or absence of the selective TRPV2 antagonist tranilast. Results showed that application of 2APB induced a rapid and large calcium influx, which was sustained for more than 10 min in BV2 microglia, but transient in WT primary microglia. Importantly, the 2APB-induced calcium influx in both BV2 and WT microglia was completely abolished by tranilast (Figure 4A,B). Notably, application of the TRPV1 agonist capsaicin to WT microglia did not elicit a significant calcium influx either in the absence (control) or in the presence of SNAP (Figure 4C). Unlike their WT controls, iNOS−/− microglia failed to generate a calcium influx following application of either capsaicin or 2APB (Figure 4D). In the presence of 2APB, SNAP induced a small and delayed calcium influx in iNOS−/− microglia (Figure 4D). In contrast, in the presence of SNAP, application of 2APB induced a large calcium influx in iNOS−/− cells with an amplitude comparable to that in WT microglia, although capsaicin still failed to induce detectable calcium influx (Figure 4E).
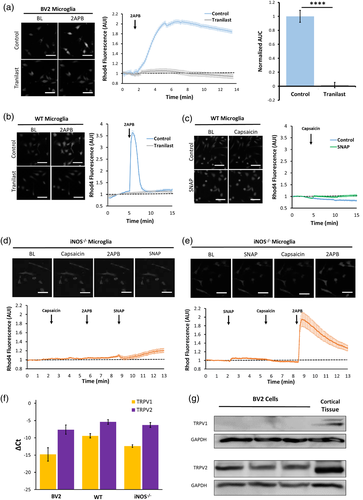
The expression levels of TRPV1-3 in microglia were further examined by gene transcription and expression analyses. Specifically, our RT-qPCR assays revealed a higher ΔCt value of TRPV2 mRNA than that of TRPV1 mRNA in BV2, WT and iNOS−/− microglia (Figure 4F), whereas TRPV3 mRNA was not detected in these cells (not shown). Moreover, immunoblot assays detected relatively high levels of TRPV2 protein in BV2 cells as well as cortical tissue, while TRPV1 protein was found in cortical tissue but not in BV2 microglia (Figure 4G). These results implied that 2APB induces calcium influx into microglia primarily through TRPV2 channels (and not TRPV1 or 3) in an NO-signaling dependent manor.
3.5 TRPV2-mediated calcium influx in microglia is attenuated by inhibiting iNOS, PKG, or PI3K
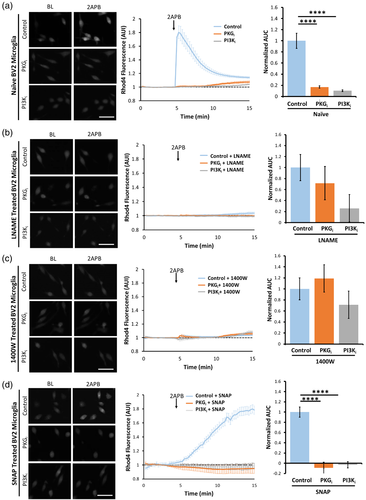
Next, we examined whether NO regulates the TRPV2-mediated calcium entry in BV2 microglia via PKG- and/or PI3K- dependent signaling. Application of 2APB to naïve BV2 cells induced a large calcium influx, and the 2APB effect was largely blocked by pretreating the naïve cells with PKGi- or PI3Ki (Figure 5A), Notably, pretreating BV2 cells with the nonspecific NOS inhibitor LNAME (Figure 5B) or with the selective iNOS inhibitor 1400W (Garvey et al., 1997) (Figure 5C) completely abolished the 2APB-induced calcium influx and occluded the effects of PKGi and PI3Ki (Figure 5B,C). Interestingly, 2APB caused a slow-onset but long lasting and high-amplitude calcium influx in SNAP-pretreated BV2 microglia, which was also completely blocked with PKGi or PI3Ki (Figure 5D) treatment. These combined results strongly suggest that either iNOS-related endogenous NO or exogenous NO can effectively upregulate TRPV2 channel activity in mouse microglia through PKG- and PI3K-dependent signaling pathway(s).
3.6 NO signaling increases TRPV2 expression on the PM in BV2 microglia
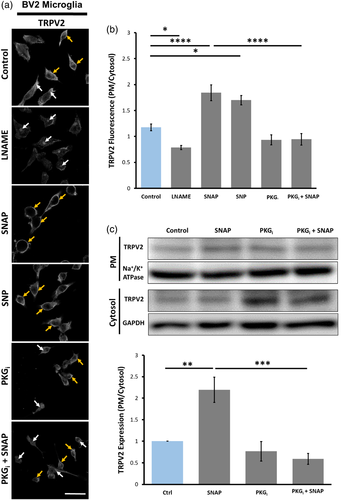
Tetrameric TRPV2 complexes on the ER membrane and Golgi apparatus can translocate to the PM where they act as nonselective cation channels (Nagasawa et al., 2007; Nagasawa & Kojima, 2012; Perálvarez-Marín et al., 2013). Immunocytochemistry and confocal image analyses revealed that under control conditions the immunofluorescence of TRPV2 was distributed on the PM and in the cytosol of BV2 cells displaying a higher ratio of PM versus cytosol intensity (Figure 6A). Inhibiting endogenous NOS activity using LNAME resulted in significantly higher intensity of TRPV2 fluorescence within the cytosol of cells (Figure 6A,B). In contrast, application of SNAP significantly increased the TRPV2 fluorescence intensity on the PM when compared to control conditions (Figure 6A,B). An alternative fast-release NO-donor, SNP, also increased TRPV2 fluorescence on the PM (Figure 6A,B). Moreover, immunoblotting assays of the biotin-labeled surface TRPV2 and the cytosolic TRPV2 demonstrated a significant increase in the PM/cytosol ratio of TRPV2 proteins in SNAP-treated BV2 microglia (Figure 6C). Moreover, treating the cells with PKGi or with PKGi + SNAP significantly decreased the PM localization of TRPV2 proteins to the same degree relative to control (Figure 6A–C). These results further imply that NO signaling increases TRPV2 channel expression on the PM of BV2 microglia in a PKG-dependent manner.
3.7 NO regulates TRPV2 subcellular localization in primary microglia through PKG and PI3K
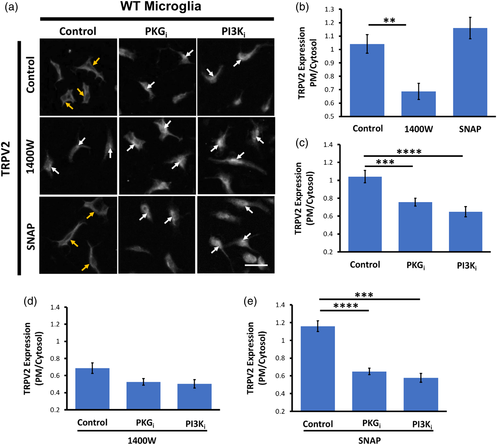
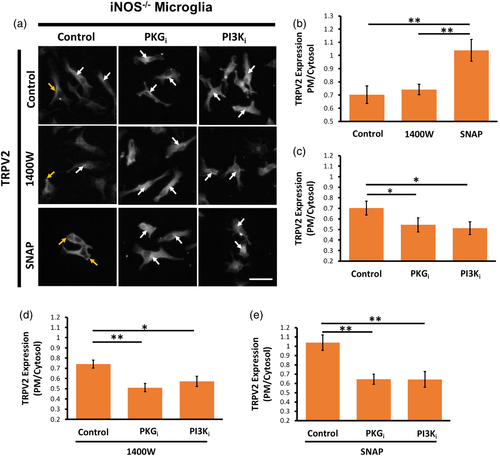
Next, we investigated whether NO influences subcellular localization of TRPV2 in primary microglia through a PKG- or PI3K-dependent manner. To this end, we performed immunocytochemistry to examine the ratio of TRPV2 immunofluorescence on the PM and in the cytosol of primary microglia. Analyses revealed notable TRPV2 fluorescence in the PM and cytosol of control WT microglia. Treating WT microglia with 1400W significantly decreased the PM/cytosol ratio of TRPV2 fluorescence, although SNAP could not increase the TRPV2 fluorescence on the PM of WT microglia (Figure 7A,B). Remarkably, treating WT microglia with PKGi or PI3Ki significantly increased cytosolic TRPV2 fluorescence in comparison to control WT cells (Figure 7C). In the presence of 1400W, however, PKGi or PI3Ki did not change the cytosolic TRPV2 fluorescence further (Figure 7D). In contrast, in SNAP-treated WT microglia, PKGi or PI3Ki largely reduced the PM/cytosol ratio of TRPV2 (Figure 7E).
As expected, control iNOS−/− microglia displayed significantly less TRPV2 fluorescence on their PM when compared to control WT microglia (data not shown). While 1400W treatment had no effect on subcellular localization of TRPV2 fluorescence, SNAP treatment displayed significantly higher TRPV2 fluorescence on the PM when compared to control iNOS−/− microglia or 1400W-treated iNOS−/− microglia (Figure 8A,B). Unexpectedly, in control iNOS−/− microglia (Figure 8C), and in iNOS−/− microglia pretreated with 1400W (Figure 8D) or with SNAP (Figure 8E), application of PKGi or PI3Ki caused a relatively small but significant decrease in the PM localization of TRPV2 fluorescence. Altogether, these results demonstrated the importance of iNOS/NO signaling as well as PKG and PI3K in regulating subcellular localization of TRPV2 in primary mouse microglia.
4 DISCUSSION
4.1 NO signaling upregulates phagocytic activity of mouse microglia
Numerous early studies show that an initial increase in NO production (Kakita et al., 2013; Scheiblich & Bicker, 2016) leads to enhanced microglial phagocytosis. Microglia possess a wide range of phagocytic receptors allowing them to recognize various substrates under different microenvironments. For example, microglia express receptors that recognize externalized phosphatidylserine on the surface of apoptotic neurons (Brown & Neher, 2014). Microglia also express various types of FcγRs that recognize and bind IgG. Activation of FcγR induces NAPDH oxidase activity to produce reactive oxygen species (ROS) (Haslund-Vinding, McBean, Jaquet, & Vilhardt, 2017; Lanone et al., 2005), and activates the transcription factor nuclear factor kappa-light-chain-enhancer of activated B-cells (NFκB) to upregulate iNOS/NO production in microglia (Le et al., 2001; Sánchez-Mejorada & Rosales, 1998). In this study, the use of IgG-FITC-beads to stimulate FcγRs in WT and iNOS−/− microglia allowed us to examine the influence of endogenous NO production on FcγR-mediated phagocytosis. Our analyses showed that iNOS−/− microglia displayed a significant decrease in phagocytic capacity, while expressing similar FcγRI and FcγRIII mRNA levels to that of WT microglia in vitro and in vivo. These results indicated that the phagocytic deficit in iNOS−/− microglia is not due to alterations in FcγR expression, but likely a result of reduced calcium influx through TRPV2 channels. It is interesting to note that iNOS−/− microglia are capable of phagocytosis, albeit with a reduced capacity. We speculate that the presence of FcγRs and the low level of PM TRPV2 expression on iNOS−/− microglia are sufficient for the cells to induce low-level phagocytosis. In addition, impaired phagocytosis in iNOS−/− microglia is unlikely a result of distorted ROS signaling, as a previous paper noted ROS production in iNOS−/− mice is not impaired (Lindgren, Stenmark, Chen, Tarnvik, & Sjostedt, 2004). On the other hand, our assays showed that WT microglia produce significant amounts of NO in response to IgG-FITC-bead stimulation, suggesting an association of NO production with the enhanced phagocytic activity. This notion was supported by the result that supplement of iNOS−/− microglia with a slow-release NO-donor restored their phagocytic capacity.
4.2 NO enhances TRPV2 channel-mediated calcium entry in microglia via a PKG-dependent pathway
TRPV2 channel-mediated calcium influx has been proved to be crucial for phagocytosis in macrophages, and more recently, in microglia (Hassan et al., 2014; Lévêque et al., 2018; Link et al., 2010; Santoni & Amantini, 2013). In this regard, previous studies reported the expression of functional TRPV2 but not TRPV1/3 channels in murine microglia (Cao & Ramsey, 2016; Miyake, Shirakawa, Nakagawa, & Kaneko, 2015). Consistent with these early reports, our assays revealed high levels of TRPV2 mRNA and protein in WT and iNOS−/− microglia. Although a lower level of TRPV1 mRNA was found in these cells, no TRPV3 mRNA was detected. Indeed, WT and BV2 microglia displayed a large calcium influx when stimulated with the TRPV1-3 agonist 2APB. Notably, the 2APB-mediated calcium influx in these mouse microglia were completely abolished by the selective TRPV2 antagonist tranilast. In contrast, the selective TRPV1 agonist capsaicin failed to induce a calcium response in WT and iNOS−/− microglia in the absence or presence of NO. The TRPV1 sensitivity to capsaicin is influenced by phosphorylation (Bhave et al., 2002), N-glycosylation (Veldhuis et al., 2012), pH (Samways, Khakh, & Egan, 2008), binding of phosphatidylinositol 4,5-biphosphate (PIP2; Klein, Ufret-Vincenty, Hua, & Gordon, 2008; Liu, Zhang, & Qin, 2005) and binding of calmodulin (Lishko, Procko, Jin, Phelps, & Gaudet, 2007; Rosenbaum, Gordon-Shaag, Munari, & Gordon, 2004). However, the insensitivity of mouse microglia to capsaicin was unlikely due to alterations in TRPV1 protein sensitivity because TRPV1 protein was not detected in mouse microglia, while being highly expressed in mouse cortical tissues. On the basis of these results, we reasoned that the 2APB-induced calcium influx in mouse microglia is mediated mainly by TRPV2 channels.
Naïve iNOS−/− microglia, however, did not respond to 2APB. It was impressive that minutes after application of the NO-donor SNAP, 2APB induced a rapid calcium rise in iNOS−/− microglia to a level comparable to that in WT cells. These results indicated that the existence of NO signaling is a decisive criterion for normal TRPV2 function in mouse microglia. To authenticate this notion, we performed whole-cell voltage-clamp recordings in primary microglia. Intriguingly, recordings revealed a basal transmembrane conductance in both WT and iNOS−/− microglia with a similar amplitude. We reasoned that the similar amplitude of basal conductance in WT and iNOS−/− microglia was a result of dilution of endogenous iNOS and NO within WT cells by the intracellular solution after whole-cell configuration. Notably, a prominent nonselective cation conductance in WT microglia appeared 1–2 min after SNAP application, whereas such a conductance in iNOS−/− microglia was enlarged 3–4 min after SNAP treatment. Furthermore, the SNAP-evoked transmembrane conductance in both WT and iNOS−/− microglia was significantly blocked by RR, a broad TRPV channel blocker, confirming that NO indeed enhances a TRPV channel-mediated nonselective conductance in mouse microglia.
NO modulates cellular functions via the classical NO-sGC-cGMP-PKG pathway (Denninger & Marletta, 1999) or by direct S-nitrosylation (Okamoto & Lipton, 2015). No study has yet suggested S-nitrosylation of TRPV2 influences channel activity; therefore, we examined the classical pathway to observe if NO induced TRPV2 calcium influx through a PKG-dependent mechanism. To this end, naïve BV2 microglia were treated with PKGi or PI3Ki. Here, PI3Ki was used as a control considering its importance in TRPV2 PM trafficking (Nagasawa et al., 2007; Nagasawa & Kojima, 2012; Perálvarez-Marín et al., 2013). Notably, TRPV2-mediated calcium influx in BV2 microglia was significantly abolished by PKGi and PI3Ki under naïve conditions, or in the presence of SNAP. Importantly, in the presence of a NOS inhibitor, TRPV2-mediated calcium influx in BV2 microglia was also abolished. All of these data indicate that NO regulates TRPV2 channel function via the classical PKG pathway in mouse microglia.
It was intriguing that in the presence of SNAP, the TRPV2 channel-mediated calcium influx in BV2 microglia was prolonged and with a higher amplitude when compared to that in naïve conditions. In relation to this issue, early studies showed that NO-cGMP-PKG signaling inhibits the hydrolysis of phosphatidylinositol 4,5-biphosphate (PIP2) (Clementi et al., 1995), a membrane lipid that is required for TRPV2 channel activation (Mercado, Gordon-shaag, Zagotta, & Gordon, 2010), possibly by preventing TRPV2 desensitization (Mercado et al., 2010). These early studies may explain the sustained calcium influx seen within BV2 cells treated with SNAP.
4.3 NO increases TRPV2 expression on the surface of mouse microglia
TRPV2 channels can traffic from ER and/or Golgi stores to the PM (Nagasawa et al., 2007; Nagasawa & Kojima, 2012; Perálvarez-Marín et al., 2013). In this present study, we found that minutes after pretreating iNOS−/− microglia with SNAP, application of 2APB could generate calcium influx. The short interval between the SNAP treatment and the 2APB-induced response suggests that NO-cGMP-PKG signaling may cause TRPV2 trafficking from the intracellular organelles to the PM. To test this idea, we pretreated BV2 microglia with NOS inhibitors or NO-donors with or without PKGi, and examined subcellular localization of TRPV2 in the cells by means of immunocytochemistry and immunoblot of biotinylated cell surface proteins. Our assays showed that SNAP intensified the immunofluorescence of TRPV2 on the PM and increased the amount of biotinylated TRPV2 protein on the cell surface. The SNAP-induced increase in the PM localization of TRPV2 was abolished by PKGi. In contrast, treating BV2 microglia with LNAME to inhibit endogenous NO-production significantly attenuated the immunofluorescence of TRPV2 on the PM.
Consistent with the observations in BV2 microglia, treating primary WT microglia with the selective iNOS inhibitor 1400W significantly decreased the immunofluorescence of TRPV2 on the PM. Notably, treating naïve WT microglia or the SNAP-pretreated WT microglia with PKGi or with PI3Ki also significantly decreased the immunofluorescence of TRPV2 on the PM. However, in the presence of 1400W, PKGi or PI3Ki had no further effect, signifying the importance of basal NO-cGMP-PKG signaling for TRPV2 to localize in the PM. On the other hand, treating primary iNOS−/− microglia with SNAP significantly increased the PM fluorescence of TRPV2. The effect of SNAP on TRPV2 fluorescence in the PM of iNOS−/− microglia was abolished with PKGi or PI3Ki treatment. Altogether, these results indicate that NO increases the translocation of TRPV2 from the cytosol to the PM of mouse microglia via the classical PKG signaling cascade.
Curiously, application of PKGi or PI3Ki to iNOS−/− microglia further decreased the PM localization of TRPV2. These results indicate that basal PKG activity in iNOS−/− microglia is also regulated by an NO-independent mechanism. In this regard, Moriyama et al. reported that rat microglia express natriuretic peptide receptors (NPRs) and may produce natriuretic peptides (Moriyama, Taniguchi, Miyano, Miyoshi, & Watanabe, 2006). Moreover, stimulation of NPRs produces cGMP (Moriyama et al., 2006). Whether NPR-mediated cGMP production within iNOS−/− microglia contributes to the basal PKG activity as a compensation mechanism for the lack of NO production remains to be investigated in future studies.
Our results also signify an important role of PI3K in the NO regulation of the surface expression of TRPV2 channels in microglia. However, it remains unclear whether PI3K activation occurs downstream of PKG activity. Kawasaki et al. reported that PI3K-Akt activity in endothelial cells is regulated by NO signaling via an unknown mechanism independent of S-nitrosylation (Kawasaki et al., 2003). Additionally, Lee et al. showed that endothelial NOS/NO signaling can activate PI3K-Akt in astrocytes (Lee et al., 2010). Future studies should explore whether PKG activity directly or indirectly induces PI3K activation in microglia.
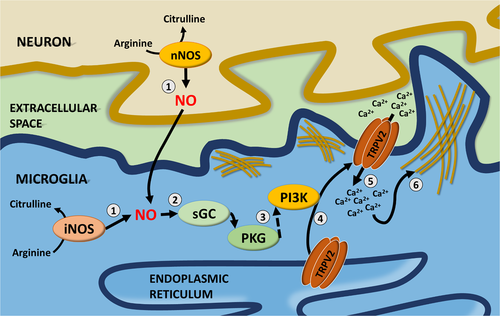
In summary, the present study for the first time demonstrated that iNOS/NO signaling in mouse microglia upregulates the phagocytic capacity of the cells by increasing TRPV2 trafficking to the PM via PKG/PI3K dependent pathway(s). These novel findings add new insights of how microglia execute phagocytosis in response to changes in their surrounding environment. As illustrated in Figure 9, we propose that in response to a signal that triggers FcγR phagocytosis, microglia increase the expression or activity of iNOS and produces higher levels of NO. The NO/sGC/cGMP/PKG-PI3K signaling induces TRPV2 trafficking to the PM and sequential calcium entry thus consequently initiating phagocytosis through further FcγR-clustering (Link et al., 2010) and actin cytoskeleton reorganization. The NO-TRPV2 regulation of microglia phagocytosis may possess therapeutic benefits for treating neurological disorders in which microglia become deficient in phagocytosis (Iadecola, Zhang, Casey, Nagayama, & Ross, 1997; Nagayama, Aber, Nagayama, Ross, & Iadecola, 1999; Pérez-Asensio et al., 2005; Sierra, Abiega, Shahraz, & Neumann, 2013).
ACKNOWLEDGMENTS
The authors thank Ms. Michelle Everest for her considerate assistance in the course of RT-qPCR analyses. MJEM and VT are recipients of 2018–2019 Ontario Graduate Scholarship. This work was supported by the Canadian Institutes of Health Research (MOP-133504) awarded to W-Y L.
CONFLICT OF INTEREST
The authors declare no competing financial and non-financial interest.


