Cognitive deficits in mice lacking Nsun5, a cytosine-5 RNA methyltransferase, with impairment of oligodendrocyte precursor cells
Abstract
Williams-Beuren syndrome (WBS) is a microdeletion disorder with cognitive phenotype. NSUN5 gene, which encodes a cytosine-5 RNA methyltransferase, is located in WBS deletion locus. To investigate the influence of NSUN5 deletion on cognitive behaviors, we produced single-gene Nsun5 knockout (Nsun5-KO) mice. Here, we report that adult Nsun5-KO mice showed spatial cognitive deficits. Size of the brain and hippocampal structures and the number of CA1 or CA3 pyramidal cells in Nsun5-KO mice did not differ from WT mice. Basal properties of Schaffer collateral-CA1 synaptic transmission in Nsun5-KO mice were unchanged, but NMDA receptor (NMDAr)-dependent long-term potentiation (LTP) was not induced. The NMDA-evoked current in CA1 pyramidal cells was reduced in Nsun5-KO mice without the changes in expression and phosphorylation of NMDAr subunits NR2A and NR2B. Although the protein level of AMPA receptor subunit GluR2 was attenuated in Nsun5-KO mice, the AMPA-evoked current was not altered. Hippocampal immuno-staining showed the selective expression of Nsun5 in NG2 or PDGFRα labeled oligodendrocyte precursor cells (OPCs), but not in pyramidal cells or astrocytes. Analysis of RT-PCR determined the Nsun5 expression in purified populations of OPCs rather than neurons or astrocytes. The Nsun5 deficiency led to decreases in the number and neurite outgrowth of OPCs in the hippocampal CA1 and DG, with the decline in NG2 expression and OPCs proliferation. These findings indicate that the Nsun5 deletion suppresses NMDAr activity in neuronal cells probably through the disrupted development and function of OPCs, leading to deficits in NMDAr-dependent LTP and spatial cognitive abilities.
1 INTRODUCTION
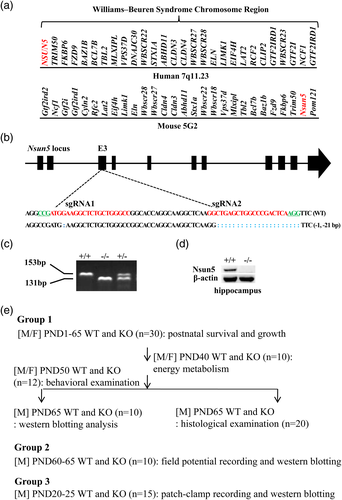
The main features of Williams–Beuren syndrome (WBS) are deficits in cognitive, visuo-spatial and numerical abilities, hypersensitivity to certain sounds, mild to moderate mental retardation (Li et al., 2009). WBS is caused by spontaneous deletions of 1.5–1.8 million base pairs and comprising 26–28 genes on human chromosome 7q11.23 (Figure 1a; Pober, 2010). Exactly how gene loss leads to the characteristic phenotype of WBS is unknown, although them hypoexpression of gene products is likely to be involved.
Although complete knockout of the WBS deletion locus might be closely related to the human phenotype, the structural genomic microdeletion can provide direct insights into the relationship between genes and behavior. A typical WBS deletion contains 25 genes encoding transcriptional regulators (GTF2I, GTF2IRD1, BAZ1B, and MLXIPL), signaling molecules (FZD9, TBL2, and LIMK1), and other molecules that function in various cellular processes (such as STX1A, CYLN2, FKBP6, EIF4H, CLDN3, CLDN4, VPS39D and RFC2; Francke, 1999). The NSUN5 gene, a member of the NOL1/Nop2/sun protein family, which encodes a cytosine-5 RNA methyltransferase, is included in the WBS deletion locus (Schubert, 2009; Sharma, Yang, Watzinger, Kotter, & Entian, 2013). A recent study has reported that NSUN5 is deleted in about 95% of patients with WBS (Pober, 2010). However, the role of NSUN5 deletion in the characteristic phenotype of WBS remains unknown.
Most of the genes affected by the WBS deletion are expressed in the brain. The microdeletion disorder WBS is widely studied because of its unique cognitive/neuropsychiatric profile and distinct dysmorphic phenotype (Kaplan, Wang, & Francke, 2001). Heterozygous deletion from Gtf2i to Fkbp6 in mice causes deficits in spatial working memory and hippocampal synaptic function (Borralleras et al., 2016; Segura-Puimedon et al., 2014). Single-gene knockout mice for WBS deletion loci have been reported, including mice with a heterozygous Cyln2 deletion, which exhibits mild growth retardation, mild brain abnormality, attenuated synaptic plasticity, and motor function (Hoogenraad et al., 2002), and mice lacking Limk1 to Fkbp6, which show cognitive defects (Li et al., 2009). Human NSUN5 has been reported to co-precipitate with ribosomes (Ramani et al., 2008). Sharma et al. (2013) and Gigova, Duggimpudi, Pollex, Schaefer, and Kos (2014) reported that Rcm1, the yeast homolog of NSUN5, directly methylates cytosine 2278 (C2278) of 25S rRNA. In yeast cells, the lack of this methylation step decreases translational fidelity and increases the recruitment of stress-specific mRNAs to translating ribosomes (Schosserer et al., 2015), indicating that the NSUN5-dependent methylation of rRNA is important for a regulation of ribosomal function. A loss-of-function mutation in human NSUN2, which encodes a tRNA methyltransferase, causes growth retardation and neuro-developmental defects including microcephaly (Khan et al., 2012; Martinez et al., 2012). In a Drosophila model without an NSUN2, a severe impairment of short-term memory was observed (Abbasi-Moheb et al., 2012).
The clinical evidence of hippocampal dysfunction, structural, and functional abnormalities has been reported in WBS (Meyer-Lindenberg et al., 2005). Processing of spatial navigational information and verbal long-term memory, domains highly dependent on hippocampal function, are also severely affected in WBS (Nichols et al., 2004; Vicari, Bellucci, & Carlesimo, 2003). To test whether the NSUN5 deletion causes the characteristic phenotype of WBS, we produced single-gene Nsun5 knockout (Nsun5-KO) mice and investigated mainly the influence of Nsun5 deficiency on spatial cognitive behaviors, hippocampal structure, and synaptic functions. We observed that Nsun5 was selectively expressed in adult hippocampal NG2-positive (NG2+) oligodendrocyte precursor cells (OPCs). Our results indicate that the lack of Nsun5 affects the development and function of NG2+ OPCs, which causes dysfunction of the NMDA receptor (NMDAr) in hippocampal pyramidal cells leading to deficits in NMDAr-dependent LTP and spatial cognitive abilities.
2 MATERIALS AND METHODS
2.1 Generation of Nsun5 null mice and experimental design
The procedures involving animals and their care were conducted in conformity with the ARRIVE guidelines of Laboratory Animal Care (Kilkenny, Browne, Cuthill, Emerson, & Altman, 2012). All animal experiments were approved by the Institutional Animal Care and Ethical Committee of the Nanjing Medical University (No. 2014-153) and were performed in accordance with the guidelines of the Laboratory Animal Research Institute for Experimental Animals of Nanjing Medical University. All efforts were made to minimize animal suffering and to reduce the number of animals used. The mice were maintained under constant environmental conditions (temperature of 23 ± 2°C, humidity of 55 ± 5%, and a 12:12 hr light/dark cycle) in the Animal Research Center of Nanjing Medical University with free access to food and water.
The Nsun5 knockout (Nsun5-KO) mouse was generated by CRISPR/Cas9 genome editing. Two sgRNAs were designed to target Exon 3 of the Nsun5 gene (Figure 1b). The oligos for the generation of sgRNA expression plasmids were annealed and cloned into the BsaI sites of pUC57-sgRNA (Addgene 51,132; Shen et al., 2014). Oligo sequences are as follows: sgRNA1-sense: TAGGCCCAGCAGAGCCTTCCAT; sgRNA1-antisense: AAACATGGAAGGCTCTGCTGGG; sgRNA2-sense: TAGGCTGAGCTGGCCCGACTCA; sgRNA2-antisense: AAACTGAGTCGGGCCAGCTCAG. in vitro transcription and microinjection of CRISPR/Cas9 were performed as described previously (Shen et al., 2014). Founder mice were backcrossed to the C57BL/6J background. The homozygous Nsun5-KO mice (−/−) used for experiments were obtained by mating between heterozygous Nsun5 mice (+/−). Mouse genotyping was performed by PCR amplification of genomic DNA obtained from tail biopsies. The genotyping primers were: 5′-CTGTCCAGGTGCTAGTGTATG-3′ and 5′-GGTCCTCATTTCGGCTCAC-3′. The size of the Nsun5 deletion was determined by amplification of a 153 bp and/or 131 bp fragment (Figure 1c). The lack of Nsun5 in hippocampus was determined in Nsun5-KO mice (Figure 1d).
Male (♂) WT mice (n = 55), female (♀) WT mice (n = 30), male Nsun5-KO mice (n = 55), and female Nsun5-KO mice (n = 30) were used in the present study. All mice were randomly divided into three experimental groups (Figure 1e). The first group was used to examine postnatal survival and growth from postnatal day (PND) 1 to PND65. The examination of energy metabolism was carried out from PND40 to PND48. Subsequently, spontaneous movement and spatial cognitive abilities were examined from PND50 to PND64. The hippocampus was harvested on PND65 for western blotting analysis and histological examination. In the second group, PND60–65 male WT mice and Nsun5-KO mice were used to measure hippocampal synaptic properties and plasticity, and the underlying signaling pathways. In the third group, PND20–25 male WT mice and Nsun5-KO mice were used to examine the function and expression of NMDA receptor (NMDAr) and AMPA receptor (AMPAr).
2.2 Measurements of food intake and energy expenditure
Mice were subjected to calorimetry using the TSE Phenomaster (TSE systems company, Germany). Mice were adapted to single housing and feeding/drinking tubes for 3 days prior to the measurement. Data of oxygen consumption ( ), carbon dioxide production (
 ), respiratory exchange ratio (RER, equivalent to
  /
/ ), and feeding were sampled every 40 min and collected for 4 days, excluding adaptation.
2.3 Behavioral examination
Three different behavioral tests were carried out under following sequence: open-field test → Y-maze → Morris water maze. These behavioral tests were spaced by at least 48 hr. These performances were captured by a video monitor (Winfast PVR; Leadtek Research Inc., Fremont, CA) and analyzed using TopScan Lite 2.0 (Clever Sys, Reston, VA).
2.3.1 Open-field test
Each mouse was placed in a clear, open-top, square Plexiglas box (30 cm × 30 cm × 40 cm) with 15 lx lighting and allowed to freely explore for 5 min. Traveled distance was measured within 5 min.
2.3.2 Y-maze task
Each mouse was placed at the end of one arm and allowed to move freely through the maze during an 8 min session (Zhou et al., 2016). The series of arm entries was recorded visually and arm entry was considered to be completed when the hind paws of the mouse were completely placed in the arm. Alternation was defined as successive entries into the three arms on overlapping triplet sets. The percentage alternation was calculated as the ratio of actual to possible alternations (defined as the total number of arm entries minus two).
2.3.3 Morris water maze task
A circular pool (diameter = 120 cm) made of black-colored plastic was prepared. On day 1–2 of training, a cylindrical black-colored platform (diameter = 7 cm) was placed 0.5 cm above the surface of the water. The mouse was randomly released from four different quadrants respectively, and allowed to swim for 90 s. Latency to reach the visible-platform was measured. On day 3–7 of training, the platform was moved to the opposite quadrant of visible-platform and was submerged 1 cm below the water surface. Four trials were conducted each day with intertrial interval of 30 min. Average swimming speed (m/s) and latency (s) to reach the platform were scored on all trials. If the mouse could not reach the platform within 90 s, the experimenter gently assisted it onto the platform and allowed it to remain there for 15 s. Each mouse started in one of four quadrants in a random manner. On day 8 of training, the probe trial was performed by removing the platform. The mouse was released from opposite quadrant in which the platform was located, and allowed to swim for 90 s. The percentage of swim time spent in four quadrants was calculated.
2.4 Electrophysiological analysis
2.4.1 Slice preparations
The mice were anesthetized with isofluorane. After removing the skulls, the brains were collected quickly and placed in ice-cold artificial cerebrospinal fluid (ACSF-1) (in mM: NaCl 126, CaCl2 1, KCl 2.5, MgCl2 1, NaHCO3 26, KH2PO4 1.25, d-glucose 20, pH 7.4) oxygenated using a gaseous mixture of 95% O2/5% CO2. Coronal slices (400 μm) were cut using a vibrating microtome (Microslicer DTK 1500, Dousaka EM Co., Kyoto, Japan) in ice-cold cutting solution (in mM: sucrose 94, NaCl 30, KCl 4.5, MgCl2 1.0, NaHCO3 26, NaH2PO4 1.2, and D-glucose 10, pH 7.4). After 1 hr of recovery at 31–34°C using an in-line heating device (Warner Instruments, Hamden, CT), the slices were transferred to a recording chamber and perfused continually with oxygenated ACSF at the temperature of 30 ± 1°C.
2.4.2 Field potential recording
A bipolar tungsten stimulating electrode was placed in str. Radiatum to stimulate Schaffer collateral-commissural fibers using a stimulator (SEN-3301, Nihon Kohden, Japan). Stimulus pulses were delivered every 15 s. Excitatory postsynaptic potential (EPSP) was recorded from str, radiatum with a 4–5 MΩ resistance glass microelectrode that was filled with 2 M NaCl. Signals were obtained using an Axoclamp 2B amplifier (Axon Instruments, Foster City, CA), sampled at 20 kHz and filtered at 10 kHz, and the output was digitized with a Digidata 1,200 converter (Axon Instruments). The stability of baseline recordings was established by delivering single pulses (4/min, 0.1 ms pulse width) for 15 min prior to the collection of data. (a) Input/output (I/O) curve: EPSPs were evoked by test stimuli (0.1–1.1 mA). (b) Paired-pulse facilitation (PPF) was induced by double stimulation with an inter-pulse interval (IPI) of 50–100 ms at 50% of the maximal stimulus strengths. Paired-pulse ratio (PPR) is expressed as the second EPSP slope relative to the first EPSP slope. (c) Long-term potentiation (LTP) was induced by one-train high-frequency stimulation (HFS, 100 or 200 Hz) with 100 pulses or theta burst stimulation (TBS, four pulses at 100 Hz, three bursts with inter-pulse interval of 200 ms; Lopez et al., 2016). After delivering HFS and TBS, the EPSPs were recorded for an additional of 60 min. If the EPSP slopes at 55–60 min after delivering HFS and TBS were 20% larger than baseline, the LTP was determined.
2.4.3 Whole-cell patch-clamp recording
The slices were perfused continually with ACSF-2 (in mM: NaCl 74, CaCl2 2.5, KCl 2.5, NaHCO3 26, KH2PO4 1.25, d-glucose 20, and d-mannitol 80). The patch-clamp recording was performed in CA1 pyramidal cells. Holding potential was −60 mV. Access resistance was monitored continuously during the experiment, and the obtained data were discarded if the access resistance fluctuated more than 20%. A glass pipette (4–5 MΩ resistance) was filled with an internal solution (in mM: CsCl 140, Tris-ATP 2, HEPES 10, and EGTA 10) at pH 7.2. The application of NMDA (1–1,000 μM) and AMPA (1–300 μM) were carried out by a picospritzer (a rapid drug delivery system), which was placed as close as possible to the recording electrode (Zhou et al., 2016). NMDA-evoked current (INMDA) and AMPA-evoked current (IAMPA) were recorded using an EPC-10 amplifier (HEKA Elektronik, Lambrecht/Pfalz, Germany). INMDA was recorded in the presence of NBQX (10 μM), bicuculine (10 μM), and tetrodotoxin (TTX, 0.1 μM). IAMPA was recorded with perfusion of D-AP5 (10 μM), strychnine (1 μM), bicuculine (10 μM), and TTX (0.1 μM). To construct the dose–response curve of INMDA, the amplitude of INMDA was normalized to maximal INMDA induced by 1,000 μM NMDA in the same neuron. In the dose–response curve of IAMPA, the amplitude of IAMPA was normalized to maximal IAMPA induced by 300 μM AMPA. The data were fitted to Logistic equation in which I = Imax/[1 + (EC50/C)n], with n being Hill coefficient and median effective concentration (EC50) being the concentration producing 50% maximal response.
2.5 Chemicals
NMDAr agonist NMDA, NMDAr antagonist D-AP5, AMPAr agonist AMPA, AMPAr antagonist NBQX, GABAA receptor antagonist bicuculline, voltage-gated sodium channel blocker TTX, and glycine receptor inhibitor strychnine were purchased from Sigma-Aldrich (St. Louis, MO). D-AP5, NBQX, and TTX were dissolved in distilled water and others were dissolved in dimethyl sulfoxide (DMSO) and diluted to the ACSF at a final concentration of 0.05% DMSO. The perfusion of 0.05% DMSO did not affect the basal EPSP slopes.
2.6 Western blotting analysis
The samples were homogenized in 200 μl Tris buffer (10% sucrose and protease inhibitors, pH 7.4, Complete; Roche Diagnostics) and sonicated. The proteins were separated on 8–10% acrylamide denaturing gels (SDS-PAGE) and transferred to PVDF membranes. The membranes were incubated with the primary antibodies of against Nsun5 (1:200, Proteintech Group Inc.), NG2 (1:1000, Millipore, MA), GluR1 (1:10000, Abcam, Cambridge, UK), GluR2 (1:1000, Abcam), phosphorylated NR2B, phosphorylated NR2A, phosphorylated CaMKII, phosphorylated ERK1/2 (1:1000, Cell Signaling Technology Inc., Boston, MA) at 4°C for 24 hr. Appropriate HRP-conjugated secondary antibodies were incubated for 1 hr at room temperature and signals were visualized using an enhanced chemiluminescence detection kit (ECL, Millipore). Following visualization, the blots were stripped by stripping buffer (Restore; Pierce) for 15 min; and then incubated with antibodies of against NR2B, NR2A, CaMKII, ERK1/2, or β-actin (1:1000, Cell Signaling Technology) at 4°C for 24 hr. Western blot bands were scanned and analyzed using the ImageJ analysis software package (NIH, Bethesda, MD).
2.7 Histological examination
The mice were anesthetized with isoflurane and perfused with cold PBS followed by 4% paraformaldehyde (PFA). To examine the cell proliferation, the mice were intraperitoneally (i.p.) injected once with BrdU (200 mg/kg body weight) and perfused 2 hr later. The brains were rapidly dissected and continuously post-fixed in 4% PFA for 24 hr. For frozen sections, the brains were transferred into 10–30% sucrose. After the brains completely sank to the bottom in 30% sucrose, the coronal sections (10 or 30 μm) were cut using a cryostat (Leica, Heidelberg, Germany). For paraffin sections, the brains were dehydrated using a graded series of alcohol, cleared in xylene and embedded in paraffin wax. The coronal sections (5 μm) were cut.
2.7.1 Nissl staining
After deparaffinization and rehydration, the sections were stained with Nissl solution. Images were acquired on a conventional light microscope (Olympus DP70, Tokyo, Japan). The density of pyramidal cells was expressed as the number of cells per mm length measured along the cell layer (Cai et al., 2008).
2.7.2 Immunohistochemical staining
The sections were incubated with 3% hydrogen peroxide for 10 min to eliminate endogenous peroxidase activity at 37°C. After antigen retrieval with citrate buffer, the sections were blocked in 1% bovine serum albumin (BSA) for 1 h at room temperature and then incubated with primary antibodies of against NG2 (1:200, Millipore) and Nsun5 (1:100, Proteintech) at 4°C overnight. Staining was revealed by the ABC method (Vector Laboratories) with 3,30-diaminobenzidine as the peroxidase substrate. Images of stained sections were observed using a conventional light microscope (Olympus DP70).
2.7.3 Immunofluorescence staining
The sections were blocked in 1% BSA and incubated with the primary antibody directed against NG2 (1:200, Millipore) at 4°C overnight, which was detected using an Alexa Fluor 488 conjugated secondary antibody (1:200, Jackson ImmunoResearch Laboratories, West Grove, PA).
2.7.4 Double immunofluorescence staining
The sections were simultaneously incubated with two primary antibodies that were developed in different species and diluted in 1% BSA, as follows: Nsun5 and NG2 (1:1000, R&D systems), or PDGFRα (1:500, Abcam), GFAP (1:1000, Millipore), NeuN (1:500), PDGFRα and Olig2 (1:100, Millipore) or BrdU (1:1000) overnight at 4°C. Primary antibodies were detected with secondary goat anti-rabbit CY3-labeled (1:200, Millipore) or Alexa Fluor 488-conjugated (1:200, Life Technologies), donkey anti-mouse FITC-labeled (1:50, Millipore), goat anti-rat CY3-labeled (1:200, Millipore) antibodies, respectively. Images of stained sections were observed using a fluorescence microscope (Olympus DP70). The cells with a distinct cell body or nucleus were counted (n = 10 sections per brain) using the manual tag function of Image Pro-Plus 6 (Media Cybernetics). The density of cells was expressed as cell number per square millimeter (Dawson, Polito, Levine, & Reynolds, 2003).
2.8 Primary cultures of cortical OPCs
Primary cultures of cortical OPCs were prepared as described by Chen et al. (2007). The cerebral cortices from PND1 mice were mechanically dissociated and placed in a new petri dish containing Hanks' balanced salt solution (HBSS). After repeated pipetting, the samples were placed in a 50 ml tube and then passed through a 70 μm nylon cell strainer into a fresh tube. Cells were collected by centrifugation and further dissociated by re-suspension in 0.05%, trypsin–EDTA for 5 min at 37°C. The dissociated cells were maintained in DMEM with 15% FBS (D15) for 10–14 days in 75 cm2 flasks at 37°C and 5% CO2 with a medium change every 3 days. Then, OPCs were purified from the mixed glial culture by the differential shaking and adhesion and allowed to grow in DMEM/F12 supplemented with 25 mg/ml insulin, 100 mg/ml Apo-transferrin, 20 nM progesterone, 60 mM putrescine and 30 nM sodium selenite. Purified OPCs were thoroughly plated onto poly-d-lysine-coated flasks and cultured for 7 days in basal chemically defined medium containing 20 ng/ml PDGF-AA and 20 ng/ml bFGF.
2.9 Reverse transcription-polymerase chain reaction
Total RNA was extracted from the harvested cells and hippocampal tissues using the Trizol reagent (Life Technologies, Invitrogen, Camarillo, CA) according to the manufacturer's protocol. Then, the RNA was reverse-transcribed into cDNAs using a Prime Script RT reagent kit (Takara, Japan) for quantitative PCR (ABI Step One Plus, Foster City, CA) in the presence of a fluorescent dye (SYBR Green I; Takara). All primers were ordered from Invitrogen and the sequences of the primers are as follows: NG2: forward 5′-GTTGGGATGCTTGCTGGTAT-3′, reverse 5′-TGAAAGCTGCAGAAGCAGAA-3′; Nsun5: forward 5′-GAGGGAAGGGTGGATAAGG-3′, reverse 5′-GGCACGATGCGGATGTAG-3′; GAPDH: forward 5′-TGGGTGTGAACCACGAG-3′, reverse 5′-ACCACAGTCCATGCCATCAC-3′ (Lin, Xiang, Cui, Stallcup, & Reeves, 2006). The relative expression of genes was determined using the 2−ΔΔCT method with normalization to GAPDH expression.
2.10 Statistical analysis
Data were retrieved and processed with the software pCLAMP 10.0 (Molecular Devices, Eugene, OR), Origin 9.1 (Origin Lab Corp., Northampton, MA) and Sigmaplot 10.0 (Systat Software, Inc., San Jose, CA). Group data are expressed as the mean ± standard error (SE). All statistical analyses were performed using SPSS software, version 18.0 (SPSS Inc., Chicago, IL). Differences among means were analyzed using Student's t test or analysis of variance (ANOVA) with or without repeated measures, followed by the Bonferroni post hoc tests where appropriate. Differences were considered statistically significant at p < .05.
3 RESULTS
3.1 Influence of Nsun5 deficiency on postnatal growth and energy metabolism
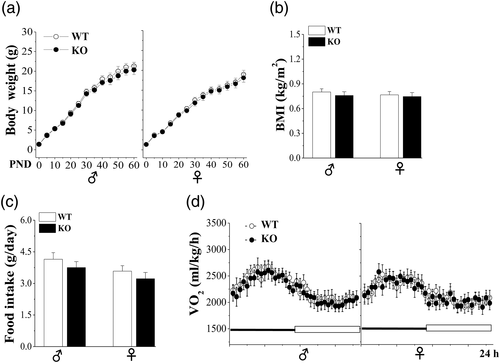
Male (♂) and female (♀) Nsun5-KO newborn pups were survived and their body weights did not differ from those of WT mice (p > .05, n = 30; Figure 2a). The growth curves from birth to postnatal day (PND) 60 in male and female Nsun5-KO mice showed the same weight gain in comparison with age-matched WT mice (♂ F1,58 = 2.787, p = .100; ♀ F1,58 = 1.384, p = .244). The body length (BL) from the tip of the nose in Nsun5-KO mice on PND65 did not differ significantly from WT mice, thus the body mass index (BMI; BW/BL2) exhibited no difference between both male or female WT mice and Nsun5-KO mice (p > .05, n = 30; Figure 2b). In addition, the amount of food intake (p > .05, n = 10; Figure 2c), and the oxygen consumption (♂ F1,18 = 2.661, p = .12; ♀ F1,18 = 0.211, p = .651, Figure 2d) in Nsun5-KO mice were unchanged compared to WT mice.
3.2 Influence of Nsun5 deficiency on spatial cognitive behaviors
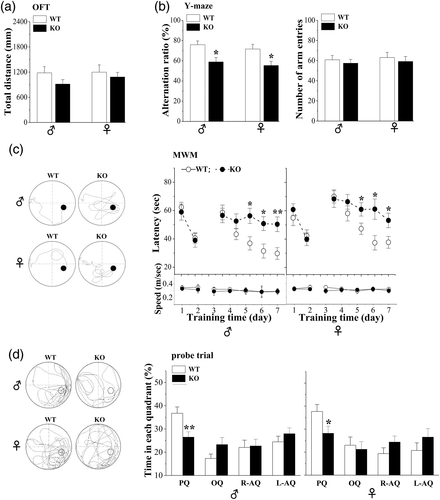
Spontaneous movement was initially examined using an open-field test (OFT). Male Nsun5-KO mice on PND50 had a tendency to perform less in traveling, but, the group, when compared with WT mice failed to reach the significance (p > .05, n = 12; Figure 3a). In contrast, the distance traveled in female Nsun5-KO mice had no difference from that in female WT mice (p > .05, n = 12). Spatial working memory was examined by the Y-maze test. In comparison with WT mice, the alternation rate in the Y-maze test was evidently reduced in male and female Nsun5-KO mice (p < .05, n = 12; Figure 3b), which was not associated with the changes in a number of arm entries (p > .05, n = 12). Subsequently, long-term spatial memory was evaluated using place learning in the Morris water maze task. On day 1–2 of training, there was no difference in the latency to reach the visible platform in male (F1,22 = 0.339, p = .567; Figure 3c) and female (F1,22 = 0.12, p = .733) Nsun5-KO mice compared to WT mice. On days 3–7 of training, the latency to reach the hidden platform differed significantly between male (F1,22 = 15,949, p = .001) and female (F1,22 = 10.956, p = .003) Nsun5-KO mice and WT mice. On training days 5–7, Nsun5-KO mice needed a more time to find the hidden platform compared to WT mice (day 5: ♂ p < .05, ♀ p < .05; day 6: ♂ p < .05, ♀ p < .05; day 7: ♂ p < .01, ♀ p < .05). However, the swim speed of Nsun5-KO mice in the pool did not differ from that of WT mice (♂ F1,12 = 0.151, p = .701; ♀ F1,22 = 0.161, p = .692). At 24 hr after the hidden platform test, we carried out a probe trial test to evaluate the strength of the memory trace. The percentage of the swimming time spent in four quadrants (platform, opposite, and adjacent quadrants) was analyzed. During a 90-s probe trial test, male or female WT mice spent a prolonged period in the platform quadrant compared to the other quadrants (♂ F1,47 = 17.51, p < .001; ♀ F1,47 = 21.569, p < .001; Figure 3d). In contrast, Nsun5-KO mice displayed no significant differences in swim time between the platform quadrant and other quadrants (♂ F1,47 = 0.346, p = .559; ♀ F1,47 = 1.268, p = .266). In comparison with WT mice, the swimming time in the platform quadrant was lower in Nsun5-KO mice (♂ p < .01; ♀ p < .05). These results indicate that Nsun5 deletion in mice significantly impairs spatial learning and memory, although it does not affect postnatal growth and energy metabolism, spontaneous movement, and vision function.
3.3 Influence of Nsun5 deficiency on hippocampal neuron and function
As shown in Figure 4a, the overall brain size in male Nsun5-KO mice did not differ roughly from WT mice on PND65 (n = 8 mice). The hippocampal size and morphological structure in CA1, CA3, and the dentate gyrus of Nsun5-KO mice were not obviously different from the age-matched WT mice (n = 8; Figure 4b). In the CA1 and CA3 regions of Nsun5-KO mice, no obvious changes in the density of pyramidal cells were detected (p > .05, n = 8; Figure 4c).
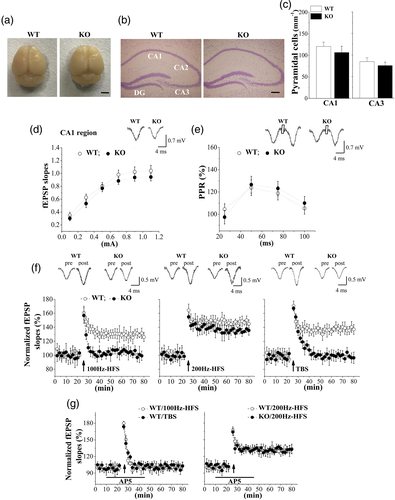
The basal properties of Schaffer collateral-CA1 synaptic transmission were analyzed by plotting field EPSP (fEPSP) slopes against stimulation intensities (0.1–1.1 mA). The input–output curve revealed that the fEPSP slopes were not altered in male Nsun5-KO mice (F1,14 = 1.167, p = .298, n = 8 slices/6 mice; Figure 4d). The fEPSP slopes evoked by high stimulation intensities (1.0–1.1 mA) tended to reduction in Nsun5-KO mice, but the differences from WT mice failed to reach significance (p > .05). The PPF with an IPI ranging from 25 to 100 ms was measured to analyze the capacity for presynaptic glutamate release. The PPRs values in Nsun5-KO mice did not differ from WT mice (F1,14 = 0.171, p = .685, n = 8 slices/4 mice; Figure 4e).
Synaptic LTP was induced by high-frequency stimulation at 100 Hz or 200 Hz (100 Hz-HFS and 200 Hz-HFS), and theta burst stimulation (TBS; n = 8 slices/6 mice per experimental group). The delivering of 100 Hz-HFS or 200 Hz-HFS in WT mice induced approximately 40 and 45% increases in the fEPSP slopes, respectively, that lasted over 60 min; this effect is indicated by “LTP” (Figure 4f). The same protocol of 100 Hz-HFS failed to induce a similar increase in fEPSP slopes in Nsun5-KO mice. The fEPSP slopes could be increased by the 200 Hz-HFS protocol, although the amplitude of LTP was lower than that observed in WT mice (at 55–60 after delivering 200 Hz-HFS, F1,14 = 5.465, p = .035). In addition, the TBS protocol induced increased fEPSP slopes for over 60 min in WT mice, but not in Nsun5-KO mice. The NMDAr-dependency of LTP induction was confirmed by the bath application of the NMDAr antagonist D-AP5 in WT mice. As shown in Figure 4g, the induction of LTP by 100 Hz-HFS and TBS depended on the Ca2+ influx of NMDAr, but the induction of LTP by 200 Hz-HFS did not. These results indicate that Nsun5 deficiency impairs hippocampal NMDAr-dependent LTP induction.
3.4 Influence of Nsun5 deficiency on NMDAr and AMPAr activities and expression
Next experiments were designed to examine the functional activity, phosphorylation, and expression of hippocampal NMDAr and AMPAr. Using a whole-cell patch-clamp recording, we examined the amplitude of INMDA and IAMPA in pyramidal cells (n = 8 cells/4 mice per experimental group). As shown in Figure 5a, the amplitude of INMDA in Nsun5-KO mice was significantly reduced compared to that of WT mice (F1,14 = 30.422, p < .001). By constructed NMDA dose–response curves by applying different concentrations of NMDA, we observed that the agonist sensitivity of the NMDAr in Nsun5-KO mice (EC50 = 104.6 ± 6.27 μM; Hill slope = 1.22) was decreased in comparison with WT mice (EC50 = 76.09 ± 7.85 μM, Hillslope = 1.28, p < .05). In addition, the amplitude of IAMPA had no significant difference between Nsun5-KO mice and WT mice (F1,14 = 1.469, p = .246; Figure 5b). The agonist potency of AMPAr in Nsun5-KO mice (EC50 = 62.71 ± 2.01 μM; Hill slope = 1.01) was unchanged when compared with WT mice (EC50 = 58.55 ± 1.67 μM; Hill slope = 1.02).
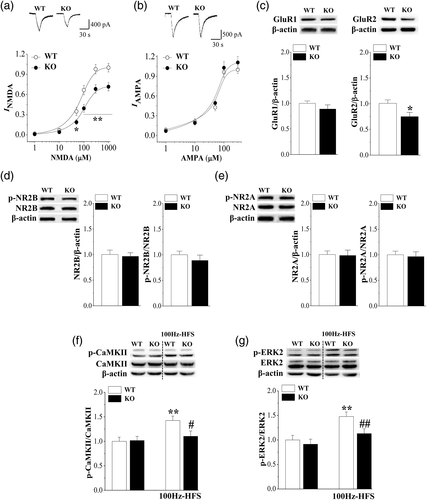
The level of hippocampal GluR2 protein (p < .05, n = 8 mice; Figure 5c) rather than GluR1 (p > .05, n = 8) in Nsun5-KO mice was reduced by approximately 15% in comparison with WT mice. The levels of the NR2B and NR2A proteins (p > .05, n = 8, Figure 5d,e) did not differ significantly from those of WT mice. The levels of NR2B phosphorylation and NR2A phosphorylation (p > .05, n = 8) exhibited no significant difference between Nsun5-KO mice and WT mice.
The basal levels of CaMKII phosphorylation and ERK2 phosphorylation (p > .05, n = 8; Figure 5f,g) exhibited no significant difference between the two groups. After 5 min of delivering 100 Hz-HFS, the levels of phospho-CaMKII and phospho-ERK2 (p < .01, n = 8) were significantly elevated in WT mice. In contrast, the amplitudes of HFS-increased phospho-CaMKII (p < .05, n = 8) and phospho-ERK2 (p < .01, n = 8) in Nsun5-KO mice were lower than those in WT mice. These results indicate that Nsun5 deficiency reduces hippocampal NMDAr activity and the HFS-induced CaMKII and ERK2 signaling pathways. Although the level of hippocampal AMPAr protein is slightly reduced, the basal synaptic efficiency and AMPAr activity in CA1 pyramidal neurons is unchanged.
3.5 Nsun5 expression in hippocampal neurons and glia
To explore the mechanisms underlying the down-regulation of NMDAr in Nsun5-KO mice, we examined the expression pattern of Nsun5 in hippocampal neurons and glia. Using immunostaining with a polyclonal Nsun5 antibody, we observed that the Nsun5-immunopositive (Nsun5+) cells were distributed in the hippocampal CA1 radiatum and oriens layers of WT mice on PND65 (Figure 6a). Higher-magnification imaging revealed that the Nsun5+ cells had darkly stained, irregularly shaped cell bodies from which multiple fine processes radiated in all directions. Numerous beads and swellings were observed at tips and branch points and along the length of processes. The specificity of the anti-Nsun5 antibody was confirmed by the lack of immunoreactive signal in Nsun5-KO mice.
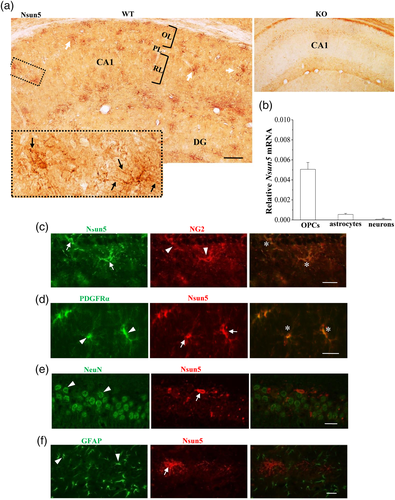
We examined the expression level of Nsun5 in the purified populations of neurons, astrocytes, and oligodendrocyte precursor cells (OPCs) using the method of RT-PCR (n = 3 samples per experimental group). As shown in Figure 6b, a high level of the Nsun5 mRNA was shown in the OPCs rather than the neurons or the astrocytes.
The two earliest markers of OPCs are the chondroitin sulfate proteoglycan nerve-glia antigen 2 (NG2) and the platelet-derived growth factor receptor A (PDGFRa). Subsequently, using a monoclonal antibody against the transmembrane NG2, we found that the immunoreactions of Nsun5 overlapped with the bodies and processes of NG2 positive (NG2+) cells (Figure 6c). Similarly, the immunostaining for PDGFRα confirmed the expression of the Nsun5 protein in OPCs (Figure 6d). However, the Nsun5+ cells did not express NeuN, a mature neuronal marker (Figure 6e), or GFAP, a mature astrocyte marker (Figure 6f). These results indicate that Nsun5 is specifically expressed in NG2+ OPCs of the adult hippocampus.
3.6 Influence of Nsun5 deficiency on OPC development
To test whether Nsun5 deficiency affects the development and function of OPCs, the number and morphology of OPCs in the hippocampal CA1 region and dentate gyrus (DG) were examined in Nsun5-KO mice and WT mice on PND65. First, the distribution of NG2+ OPCs in the CA1 region of Nsun5-KO mice was evidently reduced compared to WT mice (Figure 7a). The density of NG2+ OPCs in the CA1 radiatum layer was lower in Nsun5-KO mice than that in WT mice (p < .05, n = 8; Figure 7b). Consistently, the numbers of Olig2+ cells (p < .05, n = 8; Figure 7c,e) and PDGFRα+/Olig2+ cells (p < .05, n = 8; Figure 7d,f) were attenuated in Nsun5-KO mice. As shown in Figure 7g, the processes and branching of NG2+ OPCs in Nsun5-KO mice were shortened and reduced, respectively, in comparison with WT mice. Although the level of NG2 mRNA was unchanged in the hippocampus of Nsun5-KO mice (p > .05, n = 8; Figure 7h), the level of NG2 protein showed a significant decline compared to WT mice (p < .01, n = 8; Figure 7i).
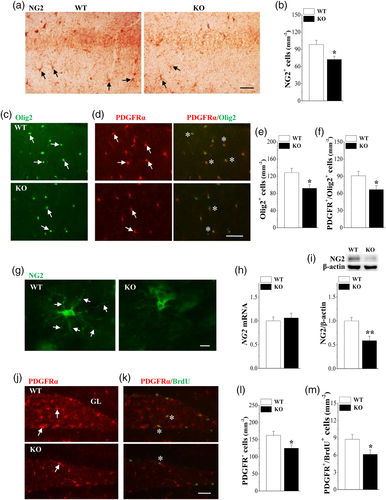
Consistent within the CA1 region, the number of PDGFRα+ cells in the DG was lower in Nsun5-KO mice than that in WT mice (p < .05, n = 8; Figure 7j,l). NG2+ OPCs are cells with a highly proliferative capacity (Dimou & Gallo, 2015). To examine whether Nsun5 deficiency affects proliferation of OPCs, hippocampal sections at 2 hr after a single injection of BrdU were double labeled with antibodies to BrdU and PDGFRα (Bu, Banki, Wu, & Nishiyama, 2004). As shown in Figure 7k, the number of PDGFRα+/BrdU+ cells in the DG of Nsun5-KO mice was reduced by approximately 30% (p < .05, n = 8; Figure 7m). These results indicate that Nsun5 deficiency reduces the proliferation of OPCs and the expression of NG2, and disrupts the neurite outgrowth of NG2+ OPCs in the hippocampus of adult mice.
4 DISCUSSION
The whole-brain volume in patients with WBS has been reported to be reduced by 13% (Thompson et al., 2005). Heterozygous deletion from Gtf2i to Fkbp6 in mice caused a reduction in brain weight (Segura-Puimedon et al., 2014). In mice lacking Limk1 to Fkbp6, the brains are smaller than the brains of WT mice (Li et al., 2009). In contrast, the Nsun5 deficiency in mice did not cause changes in the overall brain size and the morphological structure of the hippocampus. The present study provided the first in vivo evidence that Nsun5 deficiency in mice causes deficits in spatial learning and memory, although it has no impact on postnatal growth and energy metabolism. In addition, a good correlation to the impaired cognitive behavior in Nsun5-KO mice is the lack of hippocampal NMDAr-dependent LTP. Hippocampal LTP impairment has been described in mice with the single-gene Limk1, Clip2 and Stx1a knockout (Fujiwara et al., 2006; Hoogenraad et al., 2002; Todorovski et al., 2015). Similar to our results obtained in Nsun5-KO mice, the 1.3 Mb heterozygous mice with deletion from Gtf2i to Fkbp6 did not show the changes in basal synaptic properties (Borralleras et al., 2016). Therefore, the single-gene Nsun5 knockout helped to elucidate the contribution of Nsun5 gene deletion to the complex phenotype associated with WBS.
In the adult hippocampus, NG2+ and PDGFRα+ OPCs specifically expressed Nsun5. The Nsun5 deficiency resulted in a notable decrease in the number and neurite outgrowth of OPCs, with a reduction of NG2 expression. BrdU incorporation experiments showed that NG2+ OPCs are the major dividing cell population in the adult rat brain (Dawson et al., 2003; Dimou & Gallo, 2015). We observed that the numbers of BrdU+/PDGFRα+ cells in the hippocampal DG of Nsun5-KO mice was reduced by approximately 30%, reflecting a deficit in the proliferation of OPCs. NG2+ OPCs express highly functional AMPAr (Bergles, Roberts, Somogyi, & Jahr, 2000) and can receive AMPAr-mediated excitatory synaptic input from neurons, which regulates cellular activity (Jabs et al., 2005). The NG2+ OPCs are known to contain the AMPAr subunit GluA2, which is a key determinant for Ca2+ permeability of AMPAr (Bergles et al., 2000; Kukley, Nishiyama, & Dietrich, 2010). One interesting observation in this study is that the level of GluA2 was lower in Nsun5-KO mice. Because the amplitude of IAMPA in CA1 pyramidal cells of Nsun5-KO mice was not reduced, thus it is proposed that Nsun5 deficiency selectively suppresses the AMPAr expression in NG2+ OPCs. The activation of Ca2+-permeable AMPAr has been demonstrated to be important for the proliferation of NG2+ OPCs (Zonouzi, Renzi, Farrant, & Cull-Candy, 2011). However, the blockade of AMPAr was found to enhance proliferation of OPCs within intact cerebellar slice cultures (Fannon, Tarmier, & Fulton, 2015). These contradictory effects of AMPAr function on the proliferation of OPCs are thought to be due to differences in the experimental models used. The Nsun5 transcript is enriched in the developing mouse brain (Chi & Delgado-Olguin, 2013). During embryonic development, the OPCs migrate out from the germinal zones and become evenly distributed throughout all areas of white and gray matter areas (Kelenis, Hart, Edwards-Fligner, Johnson, & Vue, 2018). NG2+ OPCs in the developing somatosensory cortex form a transient and structured synaptic network with interneurons that follows its own rules of connectivity (Orduz et al., 2015). The NG2+ OPCs can differentiate into oligodendrocytes (Kelenis et al., 2018). The neocortex develops over an extended time period after all other brain development has completed. The newly formed axonal collaterals require myelin, thus the OPCs should persist long enough to produce additional oligodendrocytes. Therefore, the study underlying the influence of Nsun5 deficiency-reduced OPCs on the development of cerebral cortex should be an interesting subject for future work.
The level of hippocampal NG2 protein in Nsun5-KO mice was reduced, but the level of NG2 mRNA was not altered compared to WT mice. Many mRNAs have short upstream open reading frames within their 5′-UTRs, which are known to modulate gene expression at the translational level (Gerashchenko, Lobanov, & Gladyshev, 2012; Lawless et al., 2009). The studies by Sharma et al. (2013) and Gigova et al. (2014) have demonstrated that NSUN5 can directly methylate the cytosine 2278 (C2278) of 25S rRNA. The lack of this methylation causes the changes in the structural conformation of the ribosome, as well as translational fidelity (Schosserer et al., 2015). Thus, a possible explanation is that the Nsun5 deficiency affects the NG2 expression at the translational level. On the other hand, Ca2+ influx through AMPAr potentiates the expression of the immediate early genes NGFI-A and c-fos, which are important markers of elevated protein expression (Lin & Bergles, 2004). Both neuronal activity and AMPAr activation promote the elongation and branching of OPC processes (Fannon et al., 2015). Certainly, the decreases in the number and neurite outgrowth of OPCs in Nsun5-KO mice can lead to the reduction of NG2 protein. Furthermore, NG2 is a transmembrane proteoglycan comprising a short cytoplasmic domain (Stallcup & Huang, 2008). NG2 stimulates RhoA activity via the MUPP1/Syx1 signaling pathway promoting process outgrowth (Biname, Sakry, Dimou, Jolivel, & Trotter, 2013). In Nsun2-deficient mice, the loss of cytosine-5 RNA methylation has been reported to increase the angiogenin-mediated endonucleolytic cleavage of tRNA leading to an accumulation of tRNA-derived small RNA fragments that trigger cellular stress responses (Blanco et al., 2014, 2016). The findings would help explain the possible mechanisms underlying the Nsun5 deficiency-impaired development of NG2+ OPCs and the expression of NG2. However, further studies are needed to elucidate this problem.
OPCs in the adult brain are functionally integrated into the neuronal network and not only respond to neuronal activity but also modulate neuronal activity. The processes of NG2+ OPCs can interdigitate between pre- and postsynaptic terminals (Bergles et al., 2000) to perform bidirectional communication between neurons and NG2+ OPCs. Neuronal activity regulates the cleavage of a glial membrane protein and the release of an extracellular domain in turn modulates synaptic transmission between neurons (Sakry et al., 2014). A large population of synapse-bearing OPCs has been demonstrated to play important functional roles in regulating information processing at neuronal synapses. The absence of NG2 in OPCs (NG2-knockout mice) or pharmacological inhibition of NG2 ectodomain shedding results in a striking reduction of NMDAr current (Sakry et al., 2014), indicating that the released NG2 ectodomain can directly regulate NMDAr activity. The NG2 deletion does not alter NMDAr subunit composition, because the kinetic properties and the current–voltage relation of NMDAr currents remain unchanged. An important finding in this study is that the Nsun5 deficiency in OPCs resulted in the reduction of NMDAr current in CA1 pyramidal cells with an increase in the median effective concentration (EC50). Despite the drop in the amplitude of NMDAr currents, the expression and phosphorylation of NMDAr subunits were not altered in Nsun5-KO mice. A possible explanation is that the impairment of OPCs or reduction of NG2 in Nsun5-KO mice affects the agonist sensitivity of the NMDAr. Interestingly, in the heterozygous mice with deletion from Gtf2i to Fkbp6, which does not contain Nsun5 gene, the synaptic NMDAr currents in CA1 pyramidal neurons did not differ from those of WT mice (Borralleras et al., 2016). The results further demonstrated that the deletion of Nsun5 gene in WBS is responsible for the dysfunction of NMDAr. To determine whether the reduced NMDAr currents measured in the pyramidal cells is secondary to down-regulation of AMPAr activity, we examined the AMPAr currents in the same neurons. However, our results showed that the amplitude of AMPAr currents in Nsun5-KO mice did not differ significantly from WT mice.
The postsynaptic Ca2+ concentration is crucial for the induction of frequency-dependent LTP. The major source of Ca2+ responsible for LTP induction is known to be Ca2+ influx via NMDAr (Collingridge, Kehl, Loo, & McLennan, 1983) or L-VGCC (Morgan & Teyler, 1999). In Nsun5-KO mice, the NMDAr-dependent LTP was impaired, but NMDAr-independent LTP could be induced. The NMDAr-dependent LTP was not induced in NG2-knockout mice (Sakry et al., 2014), indicating that the ectodomain shedding of NG2 is a major contributing factor for NMDAr-dependent LTP. During LTP induction, the influx of Ca2+ via NMDAr induces the activation of CaMKII, a well-known upstream initiator of ERK2 activation (Sweatt, 2004). The ERK-CREB signaling pathway is required for LTP induction and long-term memory (Kelleher III, Govindarajan, Jung, Kang, & Tonegawa, 2004). The levels of CaMKII and ERK-CREB phosphorylation during LTP induction were reduced in Nsun5-KO mice, although their basal levels did not differ significantly from those of WT mice. The absence of LIMK1 resulted in reduced plasticity-dependent CREB activation, and the LTP and memory deficits in Limk1 knock-out mice could be rescued by increasing the activity of CREB (Todorovski et al., 2015). Thus, a possible mechanism underlying the spatial cognitive deficits in Nsun5-KO mice is summarized as follows: Nsun5 deficiency impairs the development of NG2+ OPCs and decreases the NG2 expression, which probably through the dysfunction of NMDAr prevents the induction of NMDAr-dependent LTP, leading to spatial cognitive deficits.
5 CONCLUSION
The present study provided evidence that Nsun5 deficiency causes spatial cognitive deficits and a lack of hippocampal NMDAr-dependent LTP. The cytosine-5 methylation is one of the best-characterized epigenetic modifications found in DNA (Suzuki & Bird, 2008), but the same modification in RNA remain unclear. Therefore, it will be extremely important to further explore the mechanisms underlying the impaired development of OPCs by Nsun5 deficiency, because these molecular targets open new potential therapeutic approaches for the cognitive deficits of WBS.
ACKNOWLEDGMENTS
The authors greatly appreciate the valuable comments and advise of Prof. Ming Xiao (Nanjing Medical University) in the experiment of oligodendrocyte precursor cells. The authors acknowledge Prof. Xiulan Sun and Prof. Jun Wang (Nanjing Medical University) for giving us the purified primary neurons and astrocytes. The authors thank Nanjing KeyGen Biotech. Co., Ltd. (China) for technical support in cultured and purified OPCs. This study was supported by the National Natural Science Foundation of China (81671253, 81471157), the National 973 Basic Research Program of China (2014CB943303), Natural Science Foundation of Jiangsu Province (BE2016765, BK20160045).
CONFLICT OF INTEREST
The authors declare no conflict of interest.


