Inhibition of hematopoietic cell kinase dysregulates microglial function and accelerates early stage Alzheimer's disease-like neuropathology
Abstract
Emerging evidence have posited that dysregulated microglia impair clearance and containment of amyloid-β (Aβ) species in the brain, resulting in aberrant buildup of Aβ and onset of Alzheimer's disease (AD). Hematopoietic cell kinase (Hck) is one of the key regulators of phagocytosis among the Src family tyrosine kinases (SFKs) in myeloid cells, and its expression is found to be significantly altered in AD brains. However, the role of Hck signaling in AD pathogenesis is unknown. We employed pharmacological inhibition and genetic ablation of Hck in BV2 microglial cells and J20 mouse model of AD, respectively, to evaluate the impact of Hck deficiency on Aβ-stimulated microglial phagocytosis, Aβ clearance, and resultant AD-like neuropathology. Our in vitro data reveal that pharmacological inhibition of SFKs/Hck in BV2 cells and genetic ablation of their downstream kinase, spleen tyrosine kinase (Syk), in primary microglia significantly attenuate Aβ oligomers-stimulated microglial phagocytosis. Whereas in Hck-deficient J20 mice, we observed exacerbated Aβ plaque burden, reduced microglial coverage, containment, and phagocytosis of Aβ plaques, and induced iNOS expression in plaque-associated microglial clusters. These multifactorial changes in microglial activities led to attenuated PSD95 levels in hippocampal DG and CA3 regions, but did not alter the postsynaptic dendritic spine morphology at the CA1 region nor cognitive function of the mice. Hck inhibition thus accelerates early stage AD-like neuropathology by dysregulating microglial function and inducing neuroinflammation. Our data implicate that Hck pathway plays a prominent role in regulating microglial neuroprotective function during the early stage of AD development.
Abbreviations
-
- AD
-
- Alzheimer's disease
-
- Aβ
-
- amyloid-β
-
- Hck
-
- hematopoietic cell kinase
-
- Syk
-
- spleen tyrosine kinase
-
- SFKs
-
- Src family tyrosine kinases
-
- J20/Hck-KO mice
-
- Hck-deficient J20 mice
-
- Hck-KO
-
- Hck-knocked out
-
- WT
-
- wild-type
-
- CHO cells
-
- Chinese hamster ovary cells
-
- 7PA2 cells
-
- transfected CHO cells that express V717F AD mutation in amyloid-β precursor protein 751
-
- CM
-
- conditioned medium
-
- DMEM
-
- Dulbecco's Modified Eagle's medium
-
- FBS
-
- fetal bovine serum
-
- SFM
-
- serum-free medium
-
- 4-OHT
-
- 4-hydroxytamoxifen
-
- mOZ
-
- mouse complement-opsonized zymosan
-
- LPS
-
- lipopolysaccharide
-
- PBS
-
- phosphate-buffered saline
-
- PFA
-
- paraformaldehyde
-
- TBST
-
- tris-buffered saline with 0.1% tween 20
-
- SDS
-
- sodium dodecyl sulfate
-
- ELISA
-
- enzyme-linked immunosorbent assay
-
- PCR
-
- polymerase chain reaction
-
- NOR
-
- novel object recognition
-
- RI
-
- recognition index
-
- OIP
-
- object in place
-
- MWM
-
- Morris water maze
-
- AβO
-
- amyloid-β oligomers
-
- APP
-
- amyloid precursor protein
-
- CTFs
-
- C-terminal fragments
-
- BACE1
-
- beta-site amyloid precursor protein cleaving enzyme 1
-
- iNOS
-
- inducible nitric oxide synthase
-
- pSyk
-
- phosphorylated spleen tyrosine kinase
-
- SR
-
- stratum radiatum
-
- TREM2
-
- triggering receptor expressed on myeloid cells 2
-
- DAP12
-
- DNAX-binding protein of 12 kDa
-
- NO
-
- nitric oxide
1 INTRODUCTION
Recent studies strongly support that accelerated buildup of amyloid-beta (Aβ) in the brain is primarily mediated by an impairment of Aβ clearance, rather than the overproduction of Aβ in Alzheimer's disease (AD) (Mawuenyega et al., 2010; Querfurth & LaFerla, 2010; Tarasoff-Conway et al., 2015; Wildsmith, Holley, Savage, Skerrett, & Landreth, 2013). Microglia, the resident immune cells in the brain, are believed to play a key role in removing Aβ species and regulating neuroinflammation (Cunningham, 2013; Eikelenboom et al., 2002; Malm, Jay, & Landreth, 2015). Our previous studies have shown that inhibiting microglial phagocytosis and activating proinflammatory responses exacerbate AD neuropathology (Kitazawa et al., 2011) while stimulating microglial phagocytosis clears Aβ and rescues cognition (Dunn et al., 2015; Medeiros et al., 2013). It is thus evident that functional inactivation of microglia significantly impair its ability to clear Aβ, leading to a pathological buildup of Aβ and the onset of AD (Lim, Rodriguez-Ortiz, & Kitazawa, 2015). In support of this notion, a recent longitudinal human study reveals an early protective peak and a late proinflammatory peak of microglial activation in the pathogenesis of AD (Fan, Brooks, Okello, & Edison, 2017). Hence, identifying molecules or signaling pathways that mediate microglial dysregulation in the pathogenesis of AD is a key to retard or halt the progression of the disease (Wes, Sayed, Bard, & Gan, 2016).
A plethora of evidence have shown that in vitro and in vivo Aβ stimulation of microglia augments tyrosine phosphorylation (Dhawan & Combs, 2012; Dhawan, Floden, & Combs, 2012), which correlates with elevated levels of microglial phospho-tyrosine and phospho-Src in AD brains (Dhawan, Floden, & Combs, 2012; Wood & Zinsmeister, 1991). Hematopoietic cell kinase (Hck) is a member of the Src family tyrosine kinases (SFKs) which mediate immunoreceptor-induced phagocytic activation in microglia (Choucair et al., 2006; Linnartz & Neumann, 2013), while spleen tyrosine kinase (Syk) is a nonreceptor tyrosine kinase acting downstream of SFKs (Lowell, 2011). Integrative network-based approach analyzing 1,647 postmortem brain tissues of AD patients and nondemented subjects identified eight common causal regulators for all immune networks, and Hck was ranked third after TYROBP (DAP12) and DOCK2, based on combined ranking score of regulatory strength and differential expression in AD brains (Zhang et al., 2013).
SFKs mediate Aβ-stimulated microglial phagocytosis (Koenigsknecht & Landreth, 2004), and Hck is the key regulator of phagocytosis in myeloid cells among the SFKs (Guiet et al., 2008; Lowell, Soriano, & Varmus, 1994). However, there is no direct study on the effect of Hck regulation on Aβ-stimulated microglial phagocytosis to date. We hypothesize that inactivation of Hck and Syk impairs microglial phagocytosis and Aβ clearance, leading to the development of AD neuropathology and cognitive decline. To test our hypothesis, we conducted in vitro inhibition of SFKs/Hck in BV2 microglial cells, genetic ablation of Syk in primary microglia, and in vivo ablation of Hck in J20 mouse model of AD to evaluate the impact of Hck deficiency on Aβ-stimulated microglial phagocytosis, Aβ clearance, and resultant AD-like neuropathology. This study will be the first that evaluates the deficiency of Hck in AD-like pathology, thereby providing knowledge for therapeutic interventions for treating AD.
2 MATERIALS AND METHODS
2.1 7PA2, CHO, and primary microglial cell culture
7PA2 cells are transfected Chinese hamster ovary (CHO) cells that express V717F AD mutation in amyloid-β precursor protein 751 (AβPP751) (Walsh et al., 2002). Upon cell confluent, 7PA2 cells secrete Aβ monomers and oligomers naturally in the conditioned medium (CM). Both 7PA2 and control CHO cells were kindly contributed by Dr Edward Koo (University of California, San Diego, CA), and were grown in Dulbecco's Modified Eagle's medium (DMEM) supplemented with 10% fetal bovine serum (FBS), 50 units penicillin, and 50 μg streptomycin (Thermo Fisher Scientific, Inc.). When cells were near confluent, they were washed once with serum-free medium (SFM) and replaced with fresh stock of the same medium. Cells were then incubated for ~16 hr, and the CM was collected and centrifuged at 1000g for 10 min at 4°C to remove cell debris. CM were then stored at −80°C until Aβ40 and Aβ42 quantification using enzyme-linked immunosorbent assay (ELISA) as described in Section 2.8. 7PA2-CM with substantiate expression of Aβ40 (352–570 pM) and Aβ42 (320–480 pM), but negligible levels of the same proteins in CHO-CM were applied to BV2 cells and primary microglia for phagocytosis assay and to BV2 cells for biochemical analysis.
Primary microglia were isolated from Syk/Cre double homozygous mice on postnatal day 0–3. Syk/Cre mice were generated by crossing Syk-floxed (#017309 from the Jackson Laboratory) and Rosa Cre-ERT2 mice (#008463 from the Jackson Laboratory) to allow in vitro 4-hydroxytamoxifen (4-OHT, Sigma-Aldrich Corporation)-inducible deletion of Syk (Ozaki et al., 2012). Extraction of primary microglia was done as described (Tanaka, Murakami, Bando, & Yoshida, 2015) with some modifications. Briefly, mouse brains were collected in culture medium as described above and microdissected to remove olfactory bulb, cerebellum, and meninges. Thereafter, the brain tissues were triturated with micropipette tips, digested in 0.05% Trypsin–EDTA for 15 min at 37°C and filtered through 70 μm nylon cell strainer (BD Falcon). Cell suspension from six to nine pups were combined and cultured in one T-75 flask, and after an overnight incubation, cells were replenished with fresh medium and allowed to grow for 7–10 days without changing medium. Microglial cells growing on top of the astrocytes monolayers were isolated by shaking the culture flask.
2.2 In vitro phagocytosis assay and biochemical analysis
BV2 cells are immortalized murine microglial/macrophage cells that elicit robust phagocytic activity upon stimulation (Kopec & Carroll, 1998). The BV2 cells used in this assay were kindly provided by Dr Gary Landreth (Case Western Reserve University). Cells were cultured in DMEM supplemented with 5% FBS, 50 units penicillin, and 50 μg streptomycin. in vitro phagocytosis assay was conducted as established by several groups (Koenigsknecht & Landreth, 2004; Koenigsknecht-Talboo & Landreth, 2005; Pan et al., 2011; Song, Zhou, & Chen, 2012) with some modifications. BV2 cells were seeded at 5 × 10⁴ cells/well on poly-d-lysine coated cover slips placed in 24-well plate. When the cells reached ~60% confluence, they were washed once with SFM and incubated with fresh SFM for another 3 hr. Cells were then treated with either SFM, 10 μM pan-Src inhibitor (PP2; Sigma-Aldrich Corporation) or 1 μM Syk-specific inhibitor (BAY 61-3606; Sigma-Aldrich Corporation) for 30 min. Thereafter, 1 mg/ml mouse complement-opsonized zymosan (mOZ, prepared as described in Koenigsknecht & Landreth, 2004), 1 μg/ml lipopolysaccharide (LPS; Sigma-Aldrich Corporation), 7PA2- or CHO-CM were added to the cells, in the presence of either SFM or inhibitors, and incubated for another 1 hr. At the last 30 min of incubation, 2 × 10⁷ Nile Red FluoSpheres Carboxylate-Modified Microspheres (Invitrogen) were added to each well as marker of phagocytosis. Cells were finally rinsed three times with phosphate-buffered saline (PBS), fixed with 4% paraformaldehyde (PFA), and immunostained with Alexa Fluor 488 Phalloidin (Life Technologies Corporation) and DAPI (Invitrogen) to label cellular cytoskeleton and nuclei, respectively. Three representative fluorescent images from each well were taken with EVOS FL Cell Imaging System (Thermo Fisher Scientific Inc.) using a 20× objective. Number of microspheres phagocytosed by each cell were counted manually using the Cell Counter plugins on ImageJ software (National Institute of Health) and expressed as phagocytic efficiency (%) and % phagocytic cells as described (Koenigsknecht & Landreth, 2004). To determine phagocytic efficiency (%), points were assigned according to the number of microspheres per cell wherein one point was given for a cell phagocytosing one microsphere, two points for two microspheres, and so on, up to a maximum of six points for more than five microspheres phagocytosing per cell. Number of cells containing x microspheres in the image was next multiplied by the point value. Each of these values were then added together and divided by the total number of cells counted. To express in terms of % phagocytic cells, number of cells phagocytosing one or more microspheres were taken relative to the total number of cells counted in the image. Averaged value from the three images per well thus represented one data value and was compared with that of other treatments in replicates.
To assess the signaling pathways mediating ligand-stimulated BV2 cells phagocytosis, cells were plated at 5 × 10⁵ cells/well on 6-well plate to achieve 80% confluency by the following day. Cells were rinsed once with SFM before incubated in fresh SFM for another 3 hr. Cells were then treated with either SFM or 10 μM PP2 for 30 min. Thereafter, cells were replenished with either SFM (control), mOZ (1 mg/ml), 7PA2- or CHO-CM, and incubated for 60 min. For wells that were previously treated with PP2, they were replenished with mOZ or 7PA2-CM spiked with PP2. At the end of the incubation, cells were washed twice with PBS and lysed in 70 μl of M-PER Mammalian Protein Extraction Reagent (Thermo Fisher Scientific Inc.) complemented with Halt protease and phosphatase inhibitors (Thermo Fisher Scientific Inc.). The cell lysates were then centrifuged at 14,000 rpm for 20 min at 4°C to collect protein lysate devoid of cellular debris.
To conduct biochemical analysis of the signaling proteins, protein concentration from BV2 cellular protein lysates were measured using the Bradford protein assay (Bio-Rad Laboratories), and standardized protein mass was analyzed as described under Section 2.7. Primary antibodies used in this experiment were phospho-Syk (Tyr525/526) (pSyk; Cell Signaling), Syk (N-19) (Santa Cruz Biotechnology, Inc.), YM1 (STEMCELL Technologies), inducible nitric oxide synthase (iNOS) (BD Transduction Laboratories), and tubulin (Sigma-Aldrich Corporation).
Primary microglial phagocytosis assay was conducted as described for BV2 cells with some modifications. Primary microglia were seeded at 60 × 103 cells/well on CC2™ Chamber Slide System (Thermo Fisher Scientific Inc.) and incubated for 30 min in culture medium before washing twice with PBS to remove oligodendrocytes precursor cells. Primary microglia were then cultured overnight in mixed glia-CM before treating some of the cells with 0.6 μM 4-OHT for 4 days, followed by culture medium for 1 day, to knockdown Syk. On day 6, cells were prepared for in vitro phagocytosis assay as described above, using mOZ (1 mg/ml), 7PA2-, or CHO-CM as stimuli.
2.3 Animals
Hck-knocked out (Hck-KO) mice were generously provided by Dr Clifford Lowell (University of California, San Francisco, CA). Hemizygous PDGF-hAPPSw,Ind J20 mice and wild-type (WT) mice were purchased from Jackson Laboratory. Hck-deficient J20 (J20/Hck-KO) mice was generated by crossing J20 mice with Hck-KO mice. All mice were of C57BL/6 background and both genders were used in this study. Mice were analyzed at 5–8 months old when they are at an early stage of pathological development. All animal studies performed were approved by the University of California Institutional Animal Care and Use Committee and were in accordance with Federal guidelines.
2.4 Tissue collection
Littermates of J20 and WT mice, as well as Hck-KO and J20/Hck-KO mice were euthanized at 6–8 months old after behavioral studies at 5–6 months of age. Mice were perfused with ice-cold PBS and the brains were collected in one of the three ways as followed: (a) for immunostaining, the hemibrain was fixed with 4% PFA; (b) for dendritic spine analysis, the hemibrain was immersed in Golgi solution; (c) for biochemical analyses, the hemibrain was microdissected into hippocampus and cortex, and frozen at −80°C until further processing.
2.5 Immunohistochemical analysis
Hemibrains designated for immunostaining were cryopreserved in −80°C after fixing in 4% PFA and cryoprotected in 30% sucrose for 2–3 days each. Thereafter, hemibrains were sectioned coronally at 20 μm using a freezing microtome (SM2010R; Leica Biosystems) and sections were stored in PBS with 0.05% sodium azide at 4°C. Sections from different mice at bregma position −2.54 mm (according to the mouse brain atlas of Franklin and Paxinos, Third Edition, 2007) were then mounted on microscopic slides and processed under the same conditions. Negative control slides were prepared by omitting primary antibodies to check for nonspecific labeling.
To assess for Aβ plaque burden, two additional sections (±10 sections from bregma −2.54 mm) per mouse were pretreated with 90% formic acid for 5 min as modified from previously reported protocols (Kitazawa et al., 2011; Medeiros et al., 2011), before incubated in Aβ plaque antibodies: 6E10 or 4G8 (Covance Inc.). To reduce nonspecific staining of 6E10 antibody, sections were pretreated with Mouse on Mouse (M.O.M™) Detection Kit (Vector Laboratories) according to the kit's instructions. Aβ plaques were then visualized using either colorimetric method or immunofluorescence method which allows double or triple-labeling of other proteins on the same section. For colorimetric method, ABC Peroxidase Standard Staining Kit (Thermo Fisher Scientific Inc.) and DAB Peroxidase Substrate Kit (Vector Laboratories) were applied on the sections and labeled plaques were imaged on EVOS XL Core Imaging System (Thermo Fisher Scientific Inc.). For immunofluorescent labeling of primary antibodies, Alexa Fluor 488, 555, or 633 conjugated secondary antibodies (Life Technologies Corporation) raised in corresponding species were applied to the sections. All sections were also stained with DAPI for nuclear labeling. Fluorescent images were taken with either BZ-9000 All-in-one Fluorescence Microscope (KEYENCE Corp. of America) or confocal laser microscope (DM2500; Leica Microsystems) when volumetric analysis was required. For Aβ plaque burden analysis, plaques were imaged in hippocampus, cortex near CA1 and CA3 regions, entorhinal cortex, and amygdala. Plaque areas were quantified using ImageJ software, and plaque burden was calculated by taking percentage of plaque areas over the entire area of the image field.
To label Thioflavin-S plaques, sections were stained for 10 min in 0.5% Thioflavin-S (Sigma-Aldrich Corporation) in 50% ethanol (in the dark) without formic acid treatment. Thioflavin-S plaques of ≥30 μm were captured with confocal microscope using a 40× objective with 2× zoom in 1 μm z-separation step. To assess for microglial activities around the plaques, Iba-1 (Wako Laboratory Chemicals), and CD45 and CD11b (AbD Serotec) primary antibodies were used, and were quantified at within 20 μm from the edge of the plaque of diameter ≥30 μm, including the area of the plaque itself (Ulrich et al., 2014). CD68 (AbD Serotec) primary antibody was applied to assess the activation of phagolysosomes in microglial cells after Aβ phagocytosis. pSyk (Tyr525/526) and iNOS antibodies were also used to assess activation of Syk and proinflammatory state of microglia clustering around plaques, respectively. Area covered by respective proteins was measured using ImageJ, while volumetric image measurements, and microglial number and morphology assessment were made using Imaris software (Bitplane Inc.) as previously described (Marsh et al., 2016). Plaque sphericity was quantified using the Imaris software to assess the diffusivity of plaques. To determine Aβ internalization ratio, volume of Aβ found within CD68+ phagolysosomes in Iba1+ microglia was normalized to microglial number on the plaque and Aβ plaque volume within the field (Marsh et al., 2016).
To label synaptic proteins, synaptophysin (Abcam) and PSD95 (NeuroMab) antibodies were applied, and protein intensities in the DG, CA1, and CA3 regions of the hippocampus were quantified. Using a 20× objective on the EVOS FL Cell Imaging System as previously described (Zumkehr et al., 2015), three different areas in the DG, and two of each in the CA1 and CA3 regions were imaged. In each image, five 50 × 50 pixel area were selected from the four corners and the middle of the image that best represent the protein intensity of the region and were quantified using ImageJ. An average of all areas from each region was calculated and represented the synaptic protein intensities in the DG, CA1, and CA3 regions of the hippocampus. Data are expressed as % synaptic protein intensities per genotype relative to that of Hck-KO mice as the tissues were sectioned in two batches that they labeled with the antibodies differently. Both batches of tissues consisted of Hck-KO mice as a normalizing control.
2.6 Dendritic spine analysis
Hemibrains designated for dendritic spine analysis were treated with Hito Golgi-Cox OptimStain Kit (Hitobiotec Inc.), embedded in tissue freezing medium (O.C.T, Fisher Scientific) and sectioned at 80 μm with cryostat (Leica Biosystems). Golgi-stained sections were mounted on gelatin-coated microscopic slides, and dendritic spines were assessed using Neurolucida software (MBF Bioscience). To represent the entire anteroposterior extent of the hippocampus, every four sections between bregma −1.46 mm anterior and − 3.40 mm posterior were chosen for analysis. In each of the selected sections, five dendritic segments were traced on five different pyramidal neurons at the stratum radiatum (SR) of hippocampal CA1 region as previously described (Beauquis et al., 2014; Pujadas et al., 2014). Following these criteria, dendritic spines from 25 to 35 pyramidal neurons were analyzed for each mouse. The length of dendrites traced and the types of spines identified on the traced dendrites were determined by the software for statistical analysis.
2.7 Protein extraction and western blot analysis
Protein was extracted from hippocampus by homogenizing in T-PER Tissue Protein Extraction Reagent (Thermo Fisher Scientific Inc.) complemented with protease and phosphatase inhibitors (Sigma-Aldrich Corporation), followed by centrifugation at 100,000g for 1 hr at 4°C to get detergent-soluble fraction and -insoluble pellet. Pellet was further homogenized in 70% formic acid and centrifuged as before to collect detergent-insoluble fraction. All protein fractions were stored at −80°C until further analysis.
Protein concentration from hippocampus in detergent-soluble fractions was measured using the Bradford protein assay. Standardized protein mass were separated by SDS-PAGE and transferred to Immobilon-FL PVDF membrane (EMD Millipore). Membranes were blocked in Odyssey Blocking Buffer (LI-COR Biosciences) for 1 hr at room temperature, before immunoblotted overnight with shaking at 4°C with the following antibodies diluted in Odyssey Blocking Buffer with 0.2% Tween 20 (Thermo Fisher Scientific Inc.): 6E10 (Covance Inc.), CT20, and beta-site amyloid precursor protein cleaving enzyme 1 (BACE1) (Calbiochem), YM1, arginase-1 (Arg1; Santa Cruz Biotechnology, Inc.), or tubulin. Membranes were then washed in tris-buffered saline with 0.1% tween 20 (TBST), before incubated with corresponding IRDye secondary antibodies (LI-COR Biosciences) diluted in TBST/sodium dodecyl sulfate (SDS) and 5% fat-free milk for 1 hr at room temperature. Membranes were washed in TBST thereafter and scanned using Odyssey Imaging System (LI-COR Biosciences). Band intensities were quantified with Image Studio software (version 5.2, LI-COR Biosciences) and normalized to that of tubulin which serves as protein loading control.
2.8 Quantitative analysis of Aβ by ELISA
Aβ40 and Aβ42 were quantified in both detergent-soluble and -insoluble fractions, and in 7PA2- and CHO-CM by ELISA as described previously (Zumkehr et al., 2015).
2.9 RNA isolation and real-time polymerase chain reaction
Total RNA was isolated separately from the hippocampus and cortex of the mice using Direct-zol RNA MiniPrep (ZYMO Research). RNA purity and concentration were assessed using NanoDrop spectrophotometer, and 1 μg of total RNA was reversed-transcribed to cDNA using iScript cDNA Synthesis kit (Bio-Rad Laboratories). One microliter of the synthesized cDNA was then amplified via real-time polymerase chain reaction (PCR) using iTaq Universal SYBR Green Supermix (Bio-Rad Laboratories) on the CFX Connect Real-time system (Bio-Rad Laboratories). Sequences of the mouse primers used were as followed: Gapdh-F (forward) 5′-GAAGCCCATCACCATCTTCCA-3′, Gapdh-R (reverse) 5′-TTGGCTCCACCCTTCAAGTG-3′, Arg1-F 5′-CAGTGGCTTTAACCTTGGCT-3′, Arg1-R 5′-GTCAGTCCCTGGCTTATGGT-3′, Fizz1-F 5′-CTGCTACTGGGTGTGCTTGT-3′, Fizz1-R 5′-GGCAGTTGCAAGTATCTCCA-3′, Ym1-F 5′-TCTATGCCTTTGCTGGAATG-3′, Ym1-R 5′-CAGGTCCAAACTTCCATCCT-3′. Parameters of the real-time PCR cycles were 95°C for 10 min for initial denaturing, 95°C for 30 s for denaturing, 60°C for 1 min for annealing, and 72°C for 1 min for extension. The last three parameters were repeated for 35 times before the melt curves were generated. Quantification cycle (Cq) values and melt curves were determined by Bio-Rad Laboratories CFX Manager 3.1. Relative mRNA levels were calculated by the 2−ΔΔCt method (Livak & Schmittgen, 2001) using Gapdh as the reference gene and genes expressed by WT mice as the calibrators.
2.10 Novel object recognition
Novel object recognition (NOR) was conducted as previously described (Rodriguez-Ortiz et al., 2013) with some modifications. Mice were first habituated to the trainer by handling them for 2 min each in three consecutive days. The mice handling was then extended to another 5 min of habituation to a Plexiglas arena without objects. After five consecutive days of habituation (day nine of the training), mice were habituated to the training room for 15 min before task training and 2 hr after (for memory retention). Mice were trained by exposing them to two identical objects placed side-by-side in the arena for 10 min. At 2 hr later, mice were allowed to explore one familiar object (i.e., object exposed before) and one novel (new) object in the arena for 5 min. Mice activities in the arena were recorded using video camera, which was later replayed to determine their exploration behaviors and quantified as recognition index. Recognition index (RI) indicates the relative time mouse spent in exploring the novel object, and significance from RI of 0.5 (chance level) using one-sample t test denotes NOR. Exploration was considered when mouse pointed its head toward an object at a distance of <2.5 cm with its neck extended and vibrissae moving. Simple proximity, chewing, and sitting on objects were not considered as exploratory behaviors. Mice that did not explore both objects during training were not used for behavioral analysis. Objects used in this task were carefully selected to prevent preference or phobic behaviors. To eliminate olfactory cues, the objects and arena were thoroughly cleaned with 70% ethanol and the beddings were removed of droppings and stirred between mice.
2.11 Object in place
Object in place (OIP) training was conducted on the day after NOR test, with similar procedures except for the set of objects used and the object placement. During task training, a new set of identical objects were placed side-by-side in the arena for mice to explore for 10 min. Two hours later, mice were exposed to the same set of identical objects, with one of the objects moved to either the left or right side of the arena. RI for OIP indicates the relative time mouse spent in exploring the object at the novel place.
2.12 Morris water maze
Morris water maze (MWM) was conducted as described previously (Rodriguez-Ortiz et al., 2013) with some modifications. Mice were trained to locate a circular and transparent Plexiglas platform submerged at 1 cm beneath the surface of the water, which was invisible to them when they were swimming in the 1-m-diameter water tank. The platform was placed in an equidistant position in a quadrant of the circular tank, and visual cues were placed on three sides of the wall for spatial reference. Mice were subjected to six training trials per day for three consecutive days whereby WT mice of 5–6 months old reached the training criterion of 25 s in escape latency by the third day of training. On the first 2 days of training, mice were placed on the platform for 30 s, and allowed to rest for 30 s in a dry cage. Trials involved placing the mice into the tank at one of the four designated starting points in a pseudorandom order. Mice were given up to 60 s to swim to the platform. If they failed to do so, they were manually guided to the platform. Once on the platform, they were left there for another 30 s, before being transferred to a dry cage to rest for 30 s. On Day 3 of the training, mice were placed directly into the tank without prior placement on the platform. At 72 hr after the last training, the platform was removed and mice were tested by placing in the tank at the quadrant opposite of where the platform was supposed to be. At 60 s, mice were removed from the tank and allowed to rest for 30 s. Mice were next returned to the tank at the same location, but with the platform in the place this round. At 1 week after the last training, mice were again tested with platform removed from the tank. All MWM trainings and tests were recorded by video camera and analyzed using VideoTrack system (ViewPoint Behavior Technology). Behavioral performance was quantified in terms of escape latency (time taken to reach area occupied by platform during training), number of platform crosses (number of times mouse crosses the platform area during the 60 s), and % time spent in the target (with platform) and opposite (from platform) quadrants.
2.13 Statistical analysis
All data are presented as mean ± SEM, and statistical analyses were done using GraphPad Prism 6. Values that were not within the predetermined criterion of two SDs from the mean were considered statistical outliers and were excluded from the analysis. Unpaired t test with Welch's correction (two-tailed) was used for comparison of means of two groups. For comparisons between three or more groups, one-way ANOVA or two-way ANOVA (for two factors) with Fisher's LSD post hoc test was used to evaluate statistical significance, unless otherwise stated. Data with p < .05 were considered statistically significant. To determine the number of mice needed to reach statistical difference, power analysis was conducted, and sufficient number of mice was used in this study.
3 RESULTS
3.1 SFKs/Hck and Syk mediated Aβ oligomers (AβO)-stimulated activation of phagocytic activity in BV2 and primary microglial cells
To determine whether Hck and its downstream kinase, Syk, regulated the AβO-stimulated phagocytosis, we first stimulated BV2 cells with naturally secreted AβO from 7PA2 cells as collected in 7PA2-CM, along with well-established stimuli, mOZ and LPS, then quantified the phagocytic capacities of the cells. Like mOZ and LPS, AβO-stimulated BV2 cells elevated phagocytic efficiency (%) by threefold (Figure 1a,b) and % phagocytic cells by nearly twofold (Figure 1a,c) as compared to nonstimulated control or cells treated with basal CHO-CM. Pharmacological inhibition of SFKs/Hck by pan-Src inhibitor, PP2, or Syk by its specific inhibitor, BAY 61-3606, significantly attenuated AβO-induced phagocytic capacity of BV2 cells to the basal level, which were significantly lower (p = .000011–.000192) than that of stimulus only treatment (Figure 1b,c). These data signify that the activation of BV2 cells phagocytosis by AβO stimulation was mediated in part by the SFKs/Hck and Syk pathways, and inactivation of either kinase significantly inhibited the phagocytic capacity of BV2 cells.
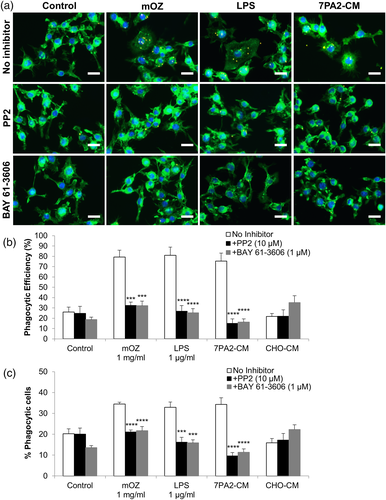
Hck and other SFKs are believed to regulate Syk activation through phosphorylation (Zhang, Billingsley, Kincaid, & Siraganian, 2000). Thus, we examined the phosphorylation status of Syk following co-treatment of pan-Src inhibitor with mOZ or 7PA2-CM in BV2 cells. We observed significant augmentation of Syk activation as indicated by the elevated levels of phosphorylated Syk at Tyr525/526 residues (pSyk) relative to total Syk by mOZ (p = .0041) and a trend toward increased pSyk by 7PA2-CM (p = .0989, Supporting Information Figure S1). Treatment with pan-Src inhibitor, PP2, significantly attenuated the levels of pSyk (mOZ: p < .0001; 7PA2-CM: p = .0093; Supporting Information Figure S1), confirming that Hck/SFKs mediated mOZ and AβO-stimulated BV2 phagocytic activities via Syk signaling pathway. We also assessed the protein levels of microglial proinflammatory marker, iNOS, and phagocytic marker, YM1, from the treated cells, but did not detect any modulation from the treatment condition (data not shown).
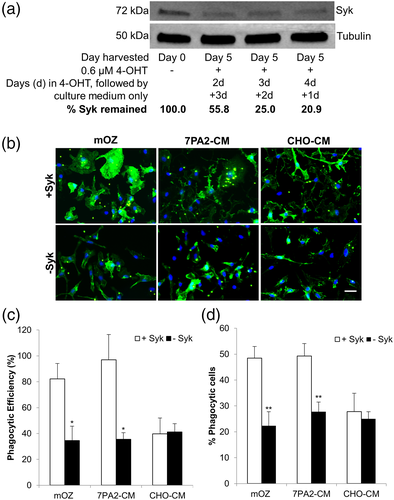
To further validate that AβO-stimulated microglial phagocytic activity was mediated via the Hck-Syk signaling pathway, we conducted in vitro phagocytosis assay in primary microglial cells after genetically knockdown Syk (Figure 2). Treating primary microglia derived from Syk/Cre mice with 4-OHT for 2–4 days, followed by culture medium at up to 5 days, resulted in a gradual reduction of Syk protein level down to ~21% relative to the untreated cells, implicating successful knockdown of majority of Syk in the primary microglial cells (Figure 2a). Substantial attenuation of primary microglial phagocytic activities were observed when the 4-OHT treatment condition was applied to the primary microglial cells prior to mOZ or 7PA2-CM stimulation (Figure 2b–d). Syk knockdown by 4-OHT treatment reduced the % phagocytic efficiency of AβO-stimulated primary microglia by 63% (p = .0324, Figure 2c) and % phagocytic cells by 44% (p = .0083, Figure 2d) relative to Syk intact cells. These data substantiate that Syk activity critically mediated AβO-stimulated primary microglial phagocytosis.
3.2 Genetic ablation of Hck significantly augmented Aβ plaque burden in J20 mouse model of AD
We next examined whether the genetic ablation of Hck exacerbated AD-like neuropathology at early plaque stage in the mouse model. Areas of Aβ plaques were measured in the hippocampus, cortex, and amygdala, and taken relative to the entire area of the image as Aβ plaque burden. There were a five- (p = .0048) and fourfold (p = .0594) increase in 6E10-positive plaque burden in the hippocampus and cortex regions, respectively, of 6- to 8-months-old J20/Hck-KO mice when compared to age-matched J20 mice (Figure 3a,b). Similar plaque burden accumulation was also observed in 4G8-positive plaques with nearly six- (p = .0054) and fourfold (p = .0256) increment found in the hippocampus and cortex regions of J20/Hck-KO mice, respectively (Figure 3a,c).
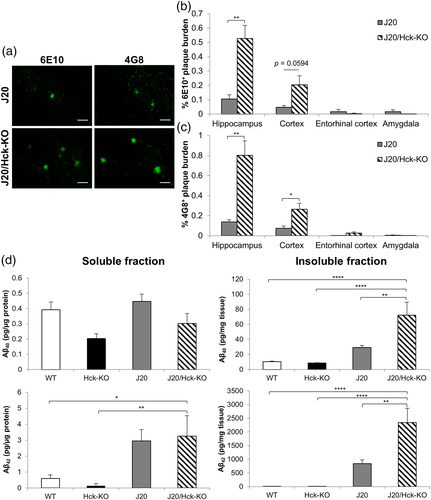
Given that the hippocampus is one of the earliest brain regions to be affected in AD (Braak, Braak, & Bohl, 1993) and in J20 mice (Mucke et al., 2000), we next quantified the level of Aβ40 and Aβ42 in detergent-soluble and -insoluble fractions of mouse hippocampal lysates using ELISA analysis. Knocking out Hck in J20 mice did not alter soluble Aβ40 and Aβ42 levels significantly from J20 mice (Figure 3d). However, it induced a nearly threefold increase in either Aβ40 (p = .003) or Aβ42 (p = .001) levels in the insoluble fraction as compared to J20 mice (Figure 3d). Insoluble Aβ40 and Aβ42 levels in J20/Hck-KO mice were also significantly higher than that of the WT and Hck-KO mice (p < .0001).
To examine whether the increased insoluble Aβ species were mediated by increase generation of Aβ in J20/Hck-KO mice, we quantified full-length amyloid precursor protein (APP) and its C-terminal fragments (CTFs: C83 and C99) in the hippocampal lysates. While Hck ablation in J20 mice did not modulate the expression of full length APP from J20 mice, it significantly elevated the steady-state level of C83 fragment (p = .0004), but reduced that of C99 fragment (p = .0395) when compared to J20 mice (Supporting Information Figure S2a,b). In corroboration, we found lower levels of mature BACE1, a prerequisite enzyme for C99 fragment and Aβ formation (Cole & Vassar, 2007), in J20/Hck-KO mice relative to J20 mice (p = .0354, Supporting Information Figure S2c,d). Taken together, our results suggest that the exacerbated Aβ plaque deposition or insoluble Aβ accumulation in J20/Hck-KO mice was not likely to be mediated by increased APP production nor enhanced amyloidogenic pathway.
3.3 Hck deficiency modulated morphological phenotypes and activities in Aβ plaque-associated microglia
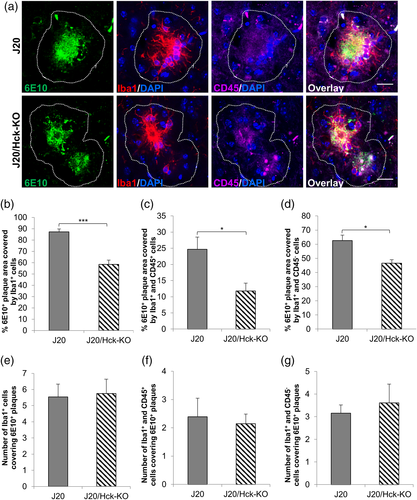
Given that clusters of activated microglia are commonly observed around Aβ plaques in postmortem human AD brains (Itagaki, McGeer, Akiyama, Zhu, & Selkoe, 1989; Mackenzie & Hao, 1995; Wegiel & Wisniewski, 1990) and in AD mouse models, including J20 mice (Fu, Rusznák, Kwok, Kim, & Paxinos, 2014; Kim et al., 2013), we examined whether Hck deficiency perturbed such microglial phenotypes. We quantitatively measured the percent plaque area covered by Iba1+ microglia and/or CD45+ activated microglia at within 20 μm from the edge of the plaque, as described previously (Ulrich et al., 2014). Experimental bias was eliminated by comparing the distribution of plaque diameter between J20 and J20/Hck-KO mice and selecting the range of plaque size that was not significantly different for analysis. We assessed microglia phenotypes around 6E10-labeled Aβ plaques and found a significant reduction in the plaque area covered by either Iba1+ (p = .0002), Iba1+ and CD45+ (p = .0206), or Iba1+ and CD45− (p = .0253) microglia in J20/Hck-KO mice (Figure 4a–d). Interestingly, there was no difference in the number of each type of microglia clustering the plaques (Figure 4e–g). Neither were differences observed in the total processes length per Iba1+ microglia (Supporting Information Figure S3a) nor the number of Iba1+ microglia branches (Supporting Information Figure S3b) around plaques between the genotypes. It appeared that the same number of microglia with similar morphologies was recruited to plaques, but covered the plaque area significantly lesser in J20/Hck-KO mice.
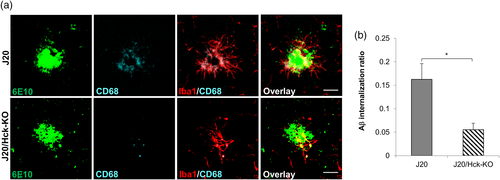
Having observed significant reduction in microglial phagocytosis after pharmacological inhibition of SFKs/Hck in BV2 cells, we examined whether genetic ablation of Hck in J20 mice recapitulated the same effect in vivo. Using confocal microscopy and Imaris volumetric and colocalization analysis, we quantified the volume of 6E10-positive plaques internalized in Iba1+/CD68+ microglial phagolysosomes as previously described (Marsh et al., 2016). Quantitative analysis of the Aβ internalization ratio revealed a significant 66% reduction in microglial phagocytic activity in J20/Hck-KO mice as compared to J20 mice (p = .0159, Figure 5).
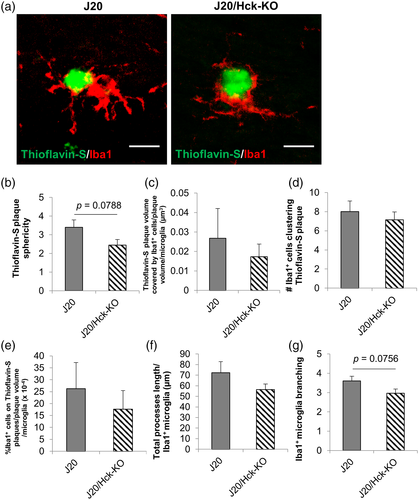
Recent reports have shown that microglia play neuroprotective role by containing Thioflavin-S plaques with extended processes, thereby making them more compact and less diffuse (Condello, Yuan, Schain, & Grutzendler, 2015; Yuan et al., 2016). We examined these parameters using confocal microscopy and Imaris volumetric and automated analysis. While Hck deficiency did not modulate the Thioflavin-S plaque volume or the plaque intensity (Figure 6a and Supporting Information Figure S4a,b), there was a trend toward increasing number of Thioflavin-S plaques, specifically at all volumes (p = .0866) or at 500–1000 μm3 (p = .0714; Supporting Information Figure S4c). In addition, the sphericity of Thioflavin-S plaques showed a tendency to be reduced (p = .0788) in J20/Hck-KO mice (Figure 6b), indicating that Hck deficiency partially resulted in more diffuse and less compact mature Aβ plaques. Analysis of Thioflavin-S plaque-associated microglia using Iba1-immunostaining showed that there was no change in the Thioflavin-S plaque volume covered by microglia per plaque volume per microglia between J20 and J20/Hck-KO mice (Figure 6c). Similarly, no difference was found in the number of microglia clustering around the plaques (Figure 6d) or in the volume of microglia clustering on Thioflavin-S plaques per plaque volume per microglia (Figure 6e). Further analysis of the microglial morphology showed no change in the total processes length of the microglia in each microglia (Figure 6f) but revealed a trend toward decreasing branching of the microglia (p = .0756) in J20/Hck-KO mice (Figure 6g). These data imply that the loss of Hck in J20 mice led to slightly more diffuse and less contained plaques surrounded by microglia with fewer branched processes.
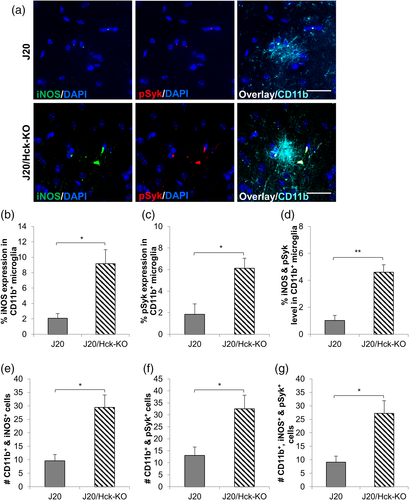
As our in vivo data indicated some functional alterations of microglia around plaques, we next explored for changes in cellular signaling and inflammatory responses in J20/Hck-KO mice. Microglia were co-stained with CD11b, iNOS, and pSyk antibodies. To correlate with the plaque-associated microglia analyzed in Figure 4, we examined only microglia that formed clusters and determined the expression levels of iNOS and/or pSyk in CD11b+ microglial clusters and the number of cells expressing these markers (Figure 7). Interestingly, we observed a fourfold increase in the iNOS expression at p = .0147 (Figure 7b), a threefold increase in the pSyk level at p = .016 (Figure 7c), and a fourfold increase in the dual expression of iNOS and pSyk at p = .0012 (Figure 7d) in CD11b+ microglia of J20/Hck-KO mice relative to age-matched J20 mice. While we did not find any difference in the number of CD11b+ microglia forming clusters in the two mouse genotypes (p = .3267, Supporting Information Figure S5), a threefold increase in the number of CD11b+ microglia expressing iNOS (p = .0142, Figure 7e) or iNOS and pSyk (p = .0206, Figure 7g), and a twofold increase in those expressing pSyk (p = .0309, Figure 7f) were observed in J20/Hck-KO mice. These findings implicate that the loss of Hck elevated Syk and microglial proinflammatory activation in microglial clusters around plaques.
3.4 Hck deletion moderately reduced steady-state and mRNA levels of Ym1 in J20 mice
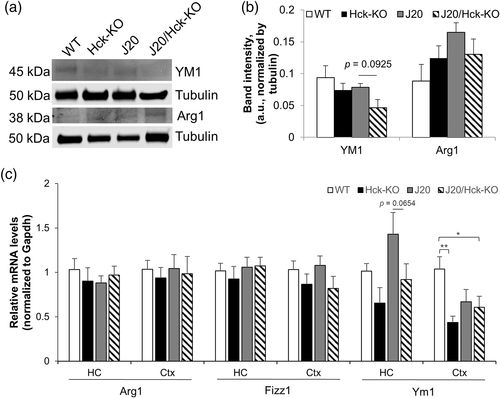
We next examined whether Hck deficiency in J20 mice altered the protein levels of phagocytic markers, YM1 and Arg1, in the hippocampal tissues. Using Western blot analysis, we found a strong trend toward a reduction of YM1 in J20/Hck-KO mice when compared with J20 mice (p = .0925, Fisher's LSD post hoc test; Figure 8a,b). On the other hand, the protein level of Arg1 was much less different between the genotypes (p = .1618, one-way ANOVA, Figure 8a,b). The same trend was observed by real-time PCR analyses, showing that the Ym1 mRNA level was elevated in the hippocampi of J20 mice (p = .0915, one-way ANOVA with p = .1444 vs WT, p = .0199 vs Hck-KO, Fisher's LSD post hoc test; Figure 8c), but the elevation was reduced almost significantly in J20/Hck-KO mice (p = .0654 vs J20, Fisher's LSD post hoc test; Figure 8c). Interestingly, Ym1 mRNA was significantly reduced in the cortices of Hck-KO (p = .0046, Fisher's LSD post hoc test) and J20/Hck-KO mice (p = .0252, Fisher's LSD post hoc test) when compared to WT mice (Figure 8c). mRNA levels of Arg1 and Fizz1 were, however, unaltered in the hippocampi and cortices of all mice analyzed. Genetic ablation of Hck in J20 mice thus revealed trend of reduced hippocampal Ym1 protein and mRNA levels in J20/Hck-KO mice.
3.5 Changes in synaptic proteins and spine morphology in J20/Hck-KO mice
As one of the pathological features of AD is synaptic loss (DeKosky & Scheff, 1990; Terry et al., 1991), we investigated whether Hck deficiency in J20 mice would alter the spatial expression of presynaptic (synaptophysin) and postsynaptic (PSD95) proteins. PSD95 immunoreactivity was significantly reduced in the hippocampal DG (p = .0025 vs J20 mice, Fisher's LSD post hoc test) and CA3 (p = .0022 vs J20 mice, Fisher's LSD post hoc test) regions, but revealed a trend toward reduction in the CA1 region of J20/Hck-KO mice (Figure 9a,b). Similarly, synaptophysin immunoreactivity in J20/Hck-KO mice showed trend of reduction in the DG (p = .09, one-way ANOVA), CA1 (p = .2954, one-way ANOVA), and CA3 regions (p = .0134, one-way ANOVA; p = .0548 vs J20 mice, Fisher's LSD post hoc test, Supporting Information Figure S6.) Conversely, we did not find significant difference in the PSD95 or synaptophysin immunoreactivity between WT, Hck-KO, and J20 mice.
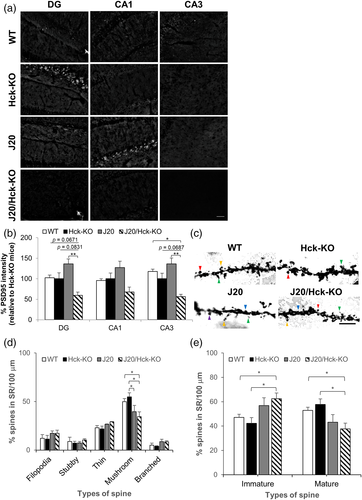
Next, we proceed to examine the dendritic spine morphology on the pyramidal neurons in the CA1 region, which is important for learning and memory (Kerchner & Nicoll, 2008), and commonly found atrophy in AD patients (Kerchner et al., 2012). Dendritic spines were classified according to their types, namely, filopodia, stubby and thin as immature spine or mushroom and branched as mature spine in the hippocampus (Penazzi et al., 2016; van der Zee, 2015). Quantification of spine types relative to the length of the dendrites revealed a significant reduction of mushroom spine in J20/Hck-KO mice when compared with either WT (31%, p = .0440) or Hck-KO (37%, p = .0110, Figure 9c,d). However, no significant difference in the number of any types of spines analyzed was detected between J20 and J20/Hck-KO mice. When we analyzed immature (filopodia, stubby, and thin) and mature (mushroom and branched) spines relative to total number of spines, J20/Hck-KO mice showed significantly more immature spines and less mature spines than WT (immature: 32% increase, p = .0419; mature: 29% decrease, p = .0419) or Hck-KO (immature: 47% increase, p = .0106; mature: 35% decrease, p = .0106) mice (Figure 9e). We also found an increased trend of immature spines and reduced trend of mature spines in J20/Hck-KO mice relative to J20 mice (Figure 9e). Taken together, the loss of mature spines in J20/Hck-KO was clearly evident when compared to WT or Hck-KO mice, but it was fairly marginal when compared to J20 mice.
3.6 Hck deficiency did not alter cognition in early plaque stage of J20 mice
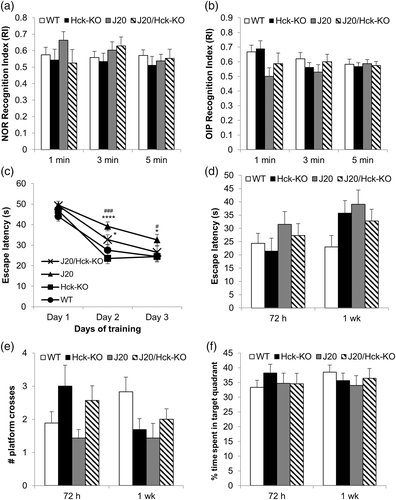
To determine whether Hck deficiency accelerated cognitive decline in J20 mice, we tested mice for nonspatial recognition memory (NOR) and spatial recognition memory (OIP and MWM). No significant differences were detected in WT, Hck-KO, J20, and J20/Hck-KO mice in NOR or OIP tests (Figure 10a,b). In MWM, while J20 mice exhibited an impaired acquisition memory during the training, that of J20/Hck-KO mice were not significantly impaired when compared to WT or Hck-KO (Figure 10c). In the probe trials, no significant difference was observed between the mouse genotypes in terms of escape latency (p = .4426 for 72 hr, p = .0796 for 1 week; Figure 10d), number of platform crosses (p = .0539 for 72 hr, p = .0642 for 1 week; Figure 10e), and time spend in the target (p = .7383 for 72 hr, p = .7069 for 1 week; Figure 10f) or opposite quadrant (p = .8768 for 72 hr, p = .4433 for 1 week; Supporting Information Figure S7a) by one-way ANOVA analysis. There was also no difference observed in the total distance that mice swam and swim speed of the mice between the genotypes (Supporting Information Figure S7b,c).
4 DISCUSSION
Emerging evidence have shown that microglia exhibit impaired phagocytic activity that contribute to Aβ deposition and subsequent AD pathology (Malm et al., 2015; Mosher & Wyss-Coray, 2014). Thus, understanding the molecular mechanisms that derail proper microglial phagocytic activity in AD is crucial in delineating the pathogenesis of AD. Hck is a phagocyte-specific tyrosine kinase among the SFKs (Guiet et al., 2008; Lowell et al., 1994) and possesses significant regulatory strength and altered expression in the microglia of sporadic AD patients (Zhang et al., 2013). Hck signaling pathways have been implicated in diseases involving phagocytes, such as inflammatory diseases, human immunodeficiency virus-1 (HIV-1) infections, and leukemia (Guiet et al., 2008). However, there is no report on the molecular assessment of Hck signaling in AD pathogenesis to date. On the contrary, Syk has been shown to be activated by tyrosine phosphorylation by the SFKs upon stimulated with Aβ (Combs, Johnson, Cannady, Lehman, & Landreth, 1999; McDonald, Brunden, & Landreth, 1997; Sondag, Dhawan, & Combs, 2009) and mediated fibrillar Aβ-stimulated microglial phagocytosis (Koenigsknecht & Landreth, 2004). Nonetheless, the involvement of Syk in mediating AβO-stimulated microglial phagocytosis has not been shown.
Our in vitro BV2 cells phagocytosis assay showed that AβO at physiological levels as found in human AD brains (Calabrese et al., 2007) stimulated phagocytosis via Hck/SFKs and Syk activation, implicating the involvement of these kinases in the neuroprotective role of microglia in AD. Our in vitro findings are in part supported by existing literature showing that PP2 as well as MNS, a Src/Syk inhibitor, significantly attenuated BV2 cells phagocytic activities (Koenigsknecht & Landreth, 2004; Marsh et al., 2016), substantiating the involvement of SFKs and Syk in mediating AβO-stimulated BV2 cells phagocytosis. Notwithstanding that, we have also demonstrated that Syk mediated AβO-stimulated phagocytosis in primary microglial cells, signifying the neuroprotective role of Hck/SFKs and its downstream kinase, Syk, in mediating microglial clearance of AβO.
Corroborating with our in vitro study, we report novel findings that deleting Hck in J20 mice significantly augmented Aβ plaque deposition in the hippocampus and cortex, with no observable change in the full-length APP. On the other hand, we detected a significant reduction in C99 fragment in J20/Hck-KO mice that correlated with the drastic decrease in mature BACE1 level. BACE1 is an initial and rate-limiting enzyme for Aβ formation (Cole & Vassar, 2007) by first producing C99 fragment. It is interesting to observe attenuation of both C99 fragment and mature BACE1 levels when Hck was genetically ablated from either WT or J20 mice. While we cannot fully explain if Hck deletion has any significant consequence on the mature BACE1 activity or subsequent alteration in the APP processing in this study, our observations may provide a clue that biological functions of Hck in neurons may be detrimental, and inhibiting Hck in neurons could be neuroprotective by suppressing BACE1 maturation, as opposed to its potentially beneficial functions in microglia shown in this study. Nonetheless, such diverse cell type-specific biological effects of Hck should be examined in more detail. In contrast to the level of C99 fragment, an elevation of C83 fragment was observed in J20/Hck-KO mice. This further substantiates the lack of enhanced APP amyloidogenic metabolism as a reciprocal relationship between nonamyloidogenic and amyloidogenic APP processing has been reported in previous studies (Skovronsky, Moore, Milla, Doms, & Lee, 2000; Vassar et al., 1999).
Our in vivo results also suggest that Hck deficiency promotes microglia toward more proinflammatory state, which has been observed in longitudinal studies of microglial activation phenotypes in APP/PS1 AD mouse model (Jimenez et al., 2008) and in human AD patients (Fan, Brooks, Okello, & Edison, 2017). In the mouse model study, Jimenez et al. (2008) observed an apparent reduction of Ym1 mRNA coupled with significant induction of iNos and Tnfα mRNA levels when comparing the hippocampi of 6- and 18-months-old APP/PS1 mice. Interestingly, the authors did not detect any modulation in the mRNA level of Arg1 as in our study. Likewise in the human study, Fan et al. (2017) suggested that once microglia fail to clear Aβ in the early stage of AD, plaques will be accumulated, leading to a decrease in anti-inflammatory but increase in proinflammatory microglial activation. Our data are in accordance to these notions in that deleting Hck, a primary regulator of phagocytosis in the SFKs, in J20 mice partially accelerated the impairment of anti-inflammatory state and Aβ clearance capacity of microglia by phagocytosis, while promoted microglial proinflammatory activation and buildup of Aβ plaque burden.
Besides reduced microglial Aβ phagocytosis and plaque clearance, our data showed evidence of dysregulation in microglia envelopment around the more mature Thioflavin-S-positive plaques and less mature 6E10-immunoreactive plaques in J20/Hck-KO mice. Condello et al. (2015) demonstrated in their study that microglia play a neuroprotective role by forming a barrier around toxic protofibrillar plaques to prevent neuritic dystrophy, which is supported by a recent study (Zhao, Hu, Tsai, Li, & Gan, 2017). Condello's study was followed up by Yuan et al. (2016) who reported that removing microglial immunoreceptor—triggering receptor expressed on myeloid cells 2 (TREM2), or its adaptor protein—DNAX-binding protein of 12 kDa (DAP12), which acts upstream of SFKs and Syk (Colonna & Wang, 2016), reduced microglia envelopment and plaque compaction in AD mice that contributed to severe axonal dystrophy. Similar observations of reduced microglia coverage around Aβ plaques owing to TREM2 deficiency were also made by other groups (Jay et al., 2017; Wang et al., 2016). Consistent with these findings, we observed trend of less spherical, that is, more diffuse Thioflavin-S plaques clustered by fewer branched microglia when removing Hck in J20 mice. This implicates that Hck deficiency in J20 mice partially reduced microglial containment capability that resulted in more diffuse or less compact mature Aβ plaques. Likewise for 6E10-immunoreactive Aβ plaques, we detected a significant reduction in the plaque coverage by Hck-deficient microglia with concomitant increase in the plaque deposition. There is, however, some distinctions here, in that morphologically similar and same number of microglia were recruited to the less mature 6E10-positive plaques, but Hck removal seemingly resulted in smaller microglial clusters covering the plaques than that observed in Hck-sufficient J20 mice. This could, in part, affect the phagocytic efficiency of the Hck-deficient microglia, as they were less accessible to the plaques.
We noted that there was no change in the dendritic spine morphology of J20 mice when compared with the non-AD mice in the CA1 region at 6–8 months old. This corroborates with the findings of Pujadas et al. (2014), while other studies demonstrated that dendritic spines loss in the CA1 region were usually observed in J20 mice of 9 months and older (Moolman, Vitolo, Vonsattel, & Shelanski, 2004; Pozueta et al., 2013). On the other hand, Hck deletion in J20 mice significantly increased the % immature and decreased the % mature spines from that of the non-AD mice, but did not mediate dramatic changes from that of J20 mice. The lack of drastic modulation in the CA1 dendritic spine morphology by J20/Hck-KO mice was also reflected in the lack of significant changes in the spatial expression of PSD95 in the same region. On the contrary, Hck deletion in J20 mice resulted in significant reductions of PSD95 immunoreactivity in the DG and CA3 regions when compared to J20 mice. The modulation, however, did not lead to cognitive deficits as observed in our behavioral tests. Neither were any cognitive impairments observed in our 5- to 6-months-old J20 mice. It is apparent that the consequence of Hck elimination in the pathologically young J20 mice elicited an early neuropathological development, with increased plaque disposition and microglial dysfunction and inflammation, but the effects were not sufficient to impair cognitive function. This is plausible since deficiency of TREM2—another microglial activation modulator—revealed exacerbated AD-like pathology only at the later stage of the disease (Jay et al., 2017).
There are evidence that high levels of pSyk were expressed in hyperactive microglia of AD mouse models and human AD brains (Satoh et al., 2012; Schweig et al., 2017), which contributed to the secretion of pro-inflammatory cytokines upon stimulated by Aβ species (Combs, Karlo, Kao, & Landreth, 2001; Sondag et al., 2009). While we did not observe such microglial phenotypes in our pathologically young J20 mice yet, we detected elevated levels of pSyk and iNOS with Hck ablation. This signifies that Hck plays a more pivotal role than other SFKs in regulating microglial activities and neuroinflammation. It is noteworthy that high levels of iNOS in activated microglia have been reported to produce nitric oxide (NO) that impaired phagocytic activities (Kopec & Carroll, 2000). In accordance to this, we observed augmented iNOS expression and dramatic attenuation in Aβ internalization owing to impaired phagocytosis in our Hck-deficient microglial cells. Taken together, these prompt toward an existence of a cause–effect relationship whereby Aβ species initially stimulated microglia to phagocytose Aβ via Hck/Syk signaling pathways, but upon chronic activation of microglia, the Syk signaling switched from activating phagocytosis to triggering proinflammatory cytokines, such as iNOS, that released NO and impaired further clearance of Aβ by phagocytosis.
This study demonstrates that Hck plays a multifactorial role in regulating microglial Aβ phagocytosis and plaque envelopment that facilitate Aβ clearance and containment. Loss of Hck in J20 mice resulted in exacerbated Aβ deposition and significant reduction of PSD95 protein level in hippocampal DG and CA3 regions, despite the presence of other members of the SFKs that could compensate for the function of Hck. Furthermore, significant activation of the proinflammatory state microglia was observed, implicating that loss of Hck alone is sufficient to accelerate microglia class switch from neuroprotective phenotype to neuroinflammation type, which is usually observed in aging AD mouse model and patients. We conclude that Hck is a likely therapeutic target for early intervention of AD progression.
ACKNOWLEDGMENTS
The authors thank the following people for their kind contribution and assistance: Dr Edward Koo (University of California, San Diego) for the 7PA2 and CHO cells; Dr Gary Landreth (Case Western Reserve University) for the BV2 cells; Dr Tatsuhide Tanaka (Asahikawa Medical University) for the protocol for isolating primary microglia; Dr Clifford Lowell (University of California, San Francisco) for the Hck-KO mice; Dr Vitaly Vasilevko and Dr David H. Cribbs (University of California, Irvine) for the Aβ40 and Aβ42 antibodies for ELISA; Dr David Baglietto-Vargas (University of California, Irvine) for his technical support on Stereology and Confocal Microscopy; Dr Samuel E. Marsh (University of California, Irvine) for his guidance on Imaris analysis.
CONFLICT OF INTEREST
The authors declare that they have no competing interests.
AUTHORSHIPS
All in vitro studies, ELISA, protein extraction and western blot analysis, RNA extraction and real-time PCR analysis, dendritic spine analysis, and statistical analyses were conducted by SLL. Guidance on 7PA2-CM generation, microdissection, ELISA, and immunostaining were provided by JZ. Animal husbandry and genotyping were done by SLL, DNT, ZK, EV, CC, VG, and SG, and tissue collection was conducted by SLL, DNT, CC, ZK, JZ, and CJRO. Behavioral tests were designed by CJRO and executed by CJRO and SLL. NOR and OIP scoring were done by EV and VG. Tissue sectioning was done by DNT, CC, and SG, while immunostaining and analyses were done by SLL, DNT, and CC. Experiments were conceived and designed by MK and SLL. Manuscript was written by SLL and critically reviewed by MK. All authors read and approved the final manuscript.


