Downregulation of miR-7116-5p in microglia by MPP+ sensitizes TNF-α production to induce dopaminergic neuron damage
Funding information: National Natural Science Foundation of China, Grant Number: 81130081
Q.H. and Q.W. performed almost all the experiments and wrote the article. C.Y. did TNF-α infusion work. YZ.W. supervised the study and wrote the article.
The authors declare no conflict of interest.
Abstract
Activation of microglia resulting in exacerbated inflammation expression plays an important role in degeneration of dopaminergic (DA) neurons in the pathogenesis of Parkinson's disease (PD). However, how this enhanced inflammation is induced in microglia remains largely unclear. Here, in the mouse PD model induced by 1-methyl-4-phenyl-1,2,3,6-tetra hydropyridine (MPTP), we found that miR-7116-5p in microglia has a crucial role in this inflammation. 1-methyl-4-phenylpyridinium (MPP+) is uptaken by microglia through organic cation transporter 3 (OCT3) to downregulate miR-7116-5p, an miRNA found to target tumor necrosis factor alpha (TNF-α). Production of TNF-α in microglia is specifically potentiated by MPP+ via downregulation of miR-7116-5p to elicit subsequent inflammatory responses. Furthermore, enhancement of miR-7116-5p expression in microglia in mice inhibits the production of TNF-α and the activation of glia, and further prevents loss of DA neurons. Together, our studies suggest that MPP+ suppresses miR-7116-5p level in microglia and potentiates TNF-α production and inflammatory responses to contribute to DA neuron damage.
1 INTRODUCTION
Parkinson's disease (PD) is a gradual degenerative disease characterized by a severe loss of dopaminergic neurons in the substantia nigra compacta (SNc) (Braak et al., 2003; Fearnley & Lees, 1991). In addition to neurodegeneration, there is exacerbated inflammation expression in the brain of PD patients (McGeer, Itagaki, Boyes, & McGeer, 1988; Mogi et al., 1994a). Use of ibuprofen, a compound known to inhibit inflammation, is associated with lowering PD risk (Gao, Chen, Schwarzschild, & Ascherio, 2011), suggesting the importance of inflammation during pathogenesis of PD. Activated microglia plays an important role in the exacerbated inflammation expression of PD. Increased activated microglia in the brain of PD patients is found and proinflammatory factors released from microglia greatly contribute to the progression of PD (Gerhard et al., 2006; Ouchi et al., 2005; Saijo et al., 2009; Wu et al., 2002). However, the mechanism underlying induction of the enhanced inflammation by microglia is largely unclear.
Exposure to environmental toxins, for example, MPTP and its analogs, is associated with an increased risk of PD (Ballard, Tetrud, & Langston, 1985; Langston et al., 1999). The MPTP is metabolized by monoamine oxidase B (MAO-B) in astrocytes into 1-methyl-4-phenylpyridinium (MPP+) (Heikkila, Manzino, Cabbat, & Duvoisin, 1984; Langston, Irwin, Langston, & Forno, 1984), which is released to extracellular spaces and uptaken by dopaminergic (DA) neurons through the dopamine transporter (DAT) (Bezard et al., 1999; Gainetdinov, Fumagalli, Jones, & Caron, 1997). The MPP+ then inhibits the oxidative phosphorylation in mitochondria to damage DA neurons (Blum et al., 2001). Besides inhibition of the oxidative phosphorylation in mitochondria, a wealth of evidence uncovers the participation of inflammation resulting from microglial activation in loss of DA neurons during administration of MPTP (Barcia et al., 2004; Hirsch & Hunot, 2009; Kanaan, Kordower, & Collier, 2008; Langston et al., 1999; Liberatore et al., 1999). In PD patients suffering from MPTP, there is a considerable microglial activation in substantia nigra (SN) (Langston et al., 1999). Additionally, reactive microglia in SN could release proinflammatory and oxidative factors and further contribute to the damage of DA neurons in MPTP model (Liberatore et al., 1999; Main et al., 2016; Martin et al., 2016; Sriram et al., 2006; Wu et al., 2002). Therefore, it is promising to clarify the process of microglial activation in pathological condition to reduce the inflammation response and delay the degeneration of DA neurons. Although the activation of microglia by the factors released from stressed DA neurons has been widely investigated (Kim et al., 2007; Wang et al., 2006), whether MPP+ could directly affect microglial inflammatory responses remains unclear.
Among the proinflammatory factors released by microglia in inflammatory responses, TNF-α has a prominent role in neuroinflammation during the pathogenesis of PD. Post-mortem brains and the cerebrospinal fluid of PD patients display increased amounts of TNF-α and its receptors (Boka et al., 1994; Mogi et al., 1994b). Additionally, a rare form of early-onset idiopathic PD has been associated with a single nucleotide polymorphism (SNP) in the TNF promoter, which predictably increases TNF-α expression (Nishimura et al., 2001). The TNF-α production is also controlled by miRNAs at post-transcriptional level (Guan et al., 2015; Tili et al., 2007; Zhang, Dong, Li, Hong, & Wei, 2012). Furthermore, in mouse MPTP model, the expression of dopamine and tyrosine hydroxylase (TH) was remarkably rescued by inhibition of TNF-α or ablation of its receptors (Ferger, Leng, Mura, Hengerer, & Feldon, 2004; Sriram et al., 2002).
In this study, we aim to investigate whether MPP+ can directly affect the expression of proinflammatory factors, especially TNF-α, in microglia in mouse MPTP model. We report now that MPP+ could be uptaken by microglia through organic cation transporter 3 (OCT3, Slc22a3), and specifically increase the production of TNF-α by downregulating miR-7116-5p to promote the death of DA neurons.
2 MATERIALS AND METHODS
2.1 Animals
All animal experiments were approved by the Institutional Animal Care and Use Committee of the Institute of Neuroscience, Shanghai, China. Crossing cluster of differentiation molecule 11B (CD11b)-Cre mice were from the European Mouse Mutant Archive, EMMA. The C57BL/6 mice were from SLAK Laboratory Animal Shanghai China.
2.2 AAV delivery and TNF-α antibody infusions
To package the miR-7116 adeno-associated virus (AAV), the fragment containing pri-miR-7116 sequence (listed in Supporting Information, Table 1) was ligated into pAOV-CMV-bGlobin-LSL-EGFP plasmid. The titers of AAV particles were between 2 × 10¹² and 4 × 10¹² units/ml. Mice were anesthetized by one intraperitoneal injection of 0.7% pentobarbital sodium and immobilized in a stereotaxic apparatus. The AAV (109, 1 μl) was slowly injected into the substantia nigra (SN) at a rate of 0.1 μl/min by a 5 μl Hamilton syringe. The coordinates of the SN are AP −3.3 mm, ML ±1.3 mm, DV −4.7 mm from bregma.
For TNF-α antibody infusions, the drug-delivery tubes were inserted into the lateral ventricles and fixed with a mixture of acrylic and dental cement. After 7-day recovery period, TNF-α antibody (2 μg, 1 μg/μl) was injected intracerebroventricularly at a rate of 0.2 μl/min. The coordinates of the lateral ventricles are AP −0.3 mm, ML ±1.0 mm, DV −2.2 mm from bregma.
2.3 MPTP injection
Briefly, male wild-type mice, or CD11b-Cre mice delivered with LSL-GFP/LSL-GFP-mir-7116 AAV (8–10 weeks) were intraperitoneally injected with MPTP (20 mg/kg) every 2 hr for a total of four doses in 1 day.
2.4 Immunofluorescence and image analysis
Anesthetized mice were perfused with 0.9% saline and 4% paraformaldehyde in 1 mM phosphate buffer (PB). The brains were incubated in 4% paraformaldehyde over night and then dehydrated in 30% sucrose for 48 hr. Frozen sections (30 μm) of the entire midbrain were prepared with a freezing microtome and then washed with phosphate-buffered saline (PBS) followed by incubation with 10% BSA and 0.5% Triton X-100 in PBS for 1 hr at room temperature. Primary antibodies (anti-tyrosine hydroxylase (TH) 1:1,000, anti-ionized calcium-binding adapter molecule 1 (Iba1) 1:500, anti-glial fibrillary acidic protein (GFAP) 1:1,000, anti-green fluorescent protein (GFP) 1:1,000) were then added, and incubated at 4°C overnight. Next day, the brain sections were washed in PBS followed by incubation with secondary antibodies (1:1,000) conjugated with fluorophore at room temperature for 2–3 hr. Every fourth section of the entire slices was chosen for determination of the number of TH-positive cells in SN and analysis of the fluorescence intensity of Iba1 and GFAP. The TH-positive cells in SN were defined as reported previously (Sauer, Rosenblad, & Bjorklund, 1995), and the cell number was counted by Image Pro Plus. The fluorescence expression of Iba1 and GFAP was defined as the average intensity of glial scar area in MPTP-injected mice or the SN area in saline-injected mice, which was quantified by ImageJ.
2.5 Isolation of the adult microglia and astrocytes in ventral midbrain
The isolated mouse ventral midbrains were grounded to pass to a 70 μm nylon cell strainer and then digested in a mixture of collagenase D (0.05%, Sigma, C5138) and DNase I (0.025 U/ml, Sigma) for 1 hr at room temperature. After washed with Hank's Balanced Salt Solution (HBSS, Invitrogen) to remove digestion mixture, cells were resuspended and stained with allophycocyanin (APC)-labeled CD45/Alexa Fluor 488-labeled CD11b, APC-labeled GLAST antibodies, or Alexa Fluor 488/APC-labeled isotype at 4°C for 1 hr. Flow cytometry was then performed for sorting CD11b+/CD45l°w, or GLAST+ population.
2.6 RNA isolation, reverse transcription, and qRT-PCR
Briefly, cells or tissues were harvested in 1 ml TRIzol to extract the total RNA. The cDNA was synthesized by reverse transcription (Promega) with random primers for mRNA or stem loop for miRNAs. The levels of miRNA and mRNA were quantified by quantitative real-time PCR (qRT-PCR) using SYBR Green Realtime PCR Master Mix (Toyobo).
2.7 ELISA
The expression of TNF-α and IL-6 was measured by ELISA kit (eBioscience) in the cell supernatant following the vender protocol. Standard curve was made to quantify the concentration of TNF-α and IL-6 from different samples.
2.8 Chromatin immunoprecipitation
Chromatin immunoprecipitation (ChIP) was performed as per the manufacturer's instructions (Millipore, 17-295). Briefly, 1 × 10⁷ BV2 cells were cross-linked by 1% formaldehyde for 10 min at room temperature and then terminated with 0.125 M glycine. Cells were resuspended with a lysis buffer (1% sodium dodecyl sulfate, 10 mM EDTA, 50 mM Tris–HCl, pH 8.1) and incubated for 30 min on ice after washed twice with cold PBS and centrifuged at 3,000 rpm for 2 min at 4°C. Chromatin was sheared into 200 to 1,000 bp fragments by sonication. Cell debris was removed by centrifugation at 13,200 rpm for 10 min at 4°C and sheared chromatin was incubated with anti-RNA pol II antibody (Santa Cruz Biotech) over night at 4°C and then with protein G-Sepharose for 2 hr at room temperature. DNA was eluted in the elution buffer (1% sodium dodecyl sulfate, 0.1 M NaHCO3) and then reverse cross-linked at 65°C for 6 hr followed by proteinase K treatment at 55°C for 2 hr. Last, DNA was extracted with phenol–chloroform for PCR analysis.
2.9 Luciferase activity assays
For TNF promoter activity determination, BV2 cells were transfected with TNF promoter (listed in Supporting Information, Table 1) cloned into a luciferase expression system for 24 hr, and then treated with MPP+ and/or LPS as described above. To verify the regulation of TNF-α by miR-7116-5p, the luciferase reporter constructs containing the 3′ UTR of mouse TNF-α (listed in Supporting Information, Table 1) and its seed sequence mutants were co-introduced with miR-7116-5p mimics (100 nM) in HEK293 cells for 24 hr. The luciferase activity was determined by Dual-Luciferase® Reporter Assay System (Promega, E1910).
2.10 Small RNA sequencing
Total RNA was extracted from BV2 cells by TRIzol reagent (Invitrogen) and the quality of RNA was assessed by Agilent 2200. The enriched small RNA library was then sequenced on the Illumina HiSeq 2500 performed by NovelBio Bio-Pharm Technology Company. The raw data were analyzed by EB-Sequencing algorithms to achieve the differentially expressed miRNAs (Dif_miRNAs). The Dif_miRNAs were selected according to the fold changes of two groups more than 1.5 and the false discovery rate (FDR) <0.05. The count number of small RNA library in each group was listed in Supporting Information, Table 2.
2.11 [3H]-MPP+ transport assays
Microglia and BV2 cells were washed with the extracellular (EC) buffer (in mM: glucose 6, KCl 4, NaCl 130, CaCl2 1.3, MgSO4 1.2, KH2PO4 1, and HEPES [pH 7.3] 25) and then incubated with [3H]-MPP+ (specific activity 78 Ci/mmol, PerkinElmer, 15 nM), unlabeled MPP+ (100 μM), D-22 (20 μM), quinidine (100 μM), nomifensine (10 μM), or/and vehicle (EC buffer for MPP+ or DMSO for other compounds) at 37°C for 40 min. To stop the reaction, the medium was rapidly replaced with cold EC buffer and followed by two washes, and 1 M NaOH was added to cells. The radioactivity was detected using a liquid scintillation counter. For time course studies, the cells were incubated with 15 nM [3H]-MPP+ and 1 mM unlabeled MPP+ for the indicated periods of time (10, 20, 40, 80, 120, and 180 min in microglia/10, 20, 40, 60, 80, and 120 min in BV2 cells). For dose-dependent studies, the incubation time was 40 min with 15 nM [3H]-MPP+ and the indicated concentrations of unlabeled MPP+ (0.1, 0.5, 1, 2, 5, and 15 mM).
2.12 Western blot analysis
Primary cultured microglia, BV2 cells and mouse brain tissues were harvested and lysed in a lysis buffer (50 mM Tris–HCl (pH 6.8), 2% sodium dodecyl sulfate, 1.5% dl-dithiothreitol, 10% glycerol, and 0.2% bromophenol blue). Immunoblot analysis was performed to measure the expression of target proteins with the antibodies (anti-OCT3 1:500, anti-DAT 1:800, anti-β-actin 1:2,000).
2.13 Northern blot analysis
The RNA extracted from BV2 cells was loaded to a 15% denaturing polyacrylamide–urea gel and transferred to a Nytran nylon transfer membrane (Ambion, Austin, TX). The membranes were cross-linked and prehybridized for at least 1 hr with Ultra-Hybsolution (Ambion), followed by hybridization to the locked nucleic acid (LNA) digoxin (DIG)-probe for miR-7116-5p (Sangon Biotech) or the U6 probe (Sangon Biotech) overnight. The wash and immunological detection were performed according to the manufacturer's instructions of DIG Wash and Block Buffer Set (Roche).
2.14 Cell cultures and transfection
Primary cultured microglia and astrocytes were obtained from C57BL/6 mice between postnatal 1 and 3 days (P1–3) and cultured in Dulbecco's modified Eagle's medium (DMEM, Invitrogen) supplemented with 10% fetal bovine serum (FBS, Invitrogen) and antibiotics. Primary cultured cortical neurons were obtained from embryonic day 18 (E18) SD rat cortices and cultured in Neurobasal (Invitrogen). BV2 and HEK293 cells were cultured in DMEM supplemented with 10% FBS and antibiotics.
The miR-7116-5p mimics (0.2-1 nM in BV2 cells and 100 nM for luciferase assays in HEK293 cells) and siRNAs (100 nM) were introduced into the cells by using siIMPORTER (Millipore, 64-101) according to the manufacturer's instructions. All plasmids were introduced into the cells using Lipofectamine 2000 (Invitrogen) following manufacturer's protocol.
2.15 Antibodies and drugs
Antibodies were used as following: TH from Millipore (AB152), Iba1 from Wako (#01919741), GFAP from Sigma (G3893), GFP from Abcam (ab13970), OCT3 from Alpha Diagnostics International (#OCT31-A), CD11b-Alexa Fluor 488 from BD Biosciences (557672), CD45-APC from BD Biosciences (559864), GLAST-APC from Miltenyi Biotec (130-098-803), and TNF-α antibody from Santa Cruz Biotech (sc-52746). Drugs were used as following: LPS from Sigma (L2630), MPP+ from Sigma (D048), MPTP from Sigma (M0898), 6-OHDA from Sigma (H4381), D-22 from Tocris Bioscience (4722), quinidine from Tocris Bioscience (4108), and nomifensine from Medchemexpress (HY-B1110).
2.16 Statistical analysis
All data were presented as mean ± SEM. Comparisons between groups for statistical significance were performed with student's t test or analysis of variance (ANOVA) with post hoc test in multiple groups by using GraphPad Prism 5.0. Results were considered significant difference at *p < 0.05; **p < 0.01; ***p < 0.001; #p < 0.05; ##p < 0.01; ###p < 0.001.
3 RESULTS
3.1 Microglia uptakes MPP+ by OCT3
We initially investigated whether microglia can uptake MPP+ and found that both the primary cultured microglia (Figure 1a,b) and a mouse microglia cell line, BV2 cells, (Supporting Information, Figure 1a,b), uptake [3H]-MPP+ in a time- and dose-dependent manner. It has been reported that DAT and OCT3 can transport MPP+ into DA neurons and astrocytes (Bezard et al., 1999; Cui et al., 2009; Gainetdinov et al., 1997). When microglia (Figure 1C) or BV2 cells (Supporting Information, Figure 1c) were incubated with decynium 22 (D-22) and quinidine, the inhibitors of OCT3, the uptake of [3H]-MPP+ was markedly inhibited, whereas when these cells were incubated with nomifensine, the inhibitor of DAT, the uptake of [3H]-MPP+ was not changed. These results provided the initial evidence that OCT3 is responsible for MPP+ uptake in the microglia. Indeed, OCT3 expression was detected in the primary cultured microglia and BV2 cells (Figure 1d). In contrast, DAT expression was not found in these cells (Figure 1d). To confirm the role of OCT3 in MPP+ uptake by microglia, we knocked down OCT3 by expressing two small interfering RNAs (siRNAs), si-1050 and si-1740, in the primary cultured microglia (Figure 1e,f and Supporting Information, Figure 1e,f) and BV2 cells (Supporting Information, Figure 1d, g, and h). As shown in Figure 1g,h and Supporting Information, Figure 1i,j, si-1050 and si-1740 greatly suppressed uptake of [3H]-MPP+ compared to si-NC. Moreover, in the cells in which OCT3 was downregulated, D-22 did not affect its uptake (Figure 1g,h and Supporting Information, Figure 1i,j). Together, these results suggest that OCT3 is responsible for the uptake of MPP+ by microglia and BV2 cells.
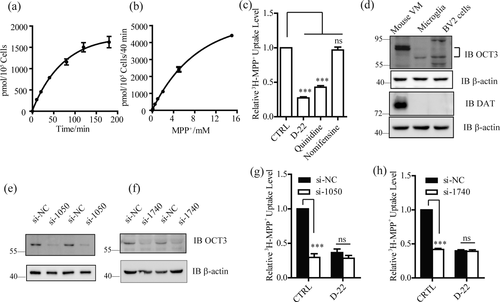
OCT3 is responsible for uptake of MPP+ by microglia. (a,b) MPP+ uptake by primary cultured microglia. Microglia were incubated with 15 nM [3H]-MPP+ and 1 mM unlabeled MPP+ for indicated periods of time (a, n = 3), or with 15 nM [3H]-MPP+ and indicated concentrations of 1 mM unlabeled MPP+ (b, n = 3) for 40 min to measure uptake of MPP+. (c) Effects of the indicated agents on the uptake of [3H]-MPP+ by microglia (n = 4). The cells were incubated for 40 min in the presence of nomifensine (10 μM), the inhibitor of DAT, or decynium 22 (D-22, 20 μM) and quinidine (100 μM), the inhibitors of OCT3. (d) Expression of OCT3 (up) and DAT (bottom) in mouse ventral mesencephalon (VM), primary cultured microglia, and BV2 cells. β-actin serves as a loading control. (e,f) Western blot analysis of expression of OCT3 in microglia transfected with si-1050 and si-1740 for 72 hr, si-NC is used as a negative control (NC) and β-actin serves as a loading control. (g,h) Effects of knocking down OCT3 by si-1050 and si-1740 on uptake of [3H]-MPP+ by microglia (n = 4). CTRL, DMSO. ns, no significance. All data were presented as mean ± SEM. All comparisons between groups for statistical significance were performed with one-way analysis of variance (ANOVA) with Tukey's post hoc test. ***p < 0.001 versus NC or CTRL
3.2 The TNF-α production by microglia is potentiated by MPP+
We next explored the possible role of MPP+ uptaken by microglia and examined the expression of proinflammatory factors in these cells. The mRNA levels of the inflammatory factors, including TNF-α, interleukin-1β (IL-1β), interleukin-6 (IL-6), and interferon-γ (IFN-γ), all were not changed when the cells were incubated with MPP+ for 12 hr, indicating that MPP+ alone did not induce the production of the proinflammatory factors in these cells (Figure 2a–c). It has been reported that microglia is activated by the factors released from stressed or dead DA neurons in the MPTP model (Kim et al., 2007). We then investigated whether MPP+ could regulate activation of microglia in inflammation. Treatment of microglia and BV2 cells with lipopolysaccharides (LPS) to mimic the factors released from stressed or dead DA neurons led to an increase in mRNA level of TNF-α (Figure 2a) and this increase was greatly potentiated by MPP+ pretreatment (Figure 2b,c). In contrast, there were no differences in mRNA levels of IL-1β, IL-6, or IFN-γ between MPP+ with LPS group and LPS group (Figure 2b,c). Additionally, mRNA levels of cyclooxygenase (COX-2) and inducible nitric oxide synthase (iNOS), enzymes associated with inflammation (Simon, 1999; Vane et al., 1994), were not different between these two groups (Figure 2b,c). As astrocytes and neurons are also responsible for production of TNF-α and other cytokines (Forloni, Mangiarotti, Angeretti, Lucca, & De Simoni, 1997; Liu et al., 1994), we assessed the MPP+ potentiation of TNF-α production in these cells. However, mRNA level of TNF-α was not potentiated by MPP+ in astrocytes or neurons (Figure 2d,e). Moreover, 6-OHDA is also a selective catecholaminergic neurotoxin that induces DA neuron damage (Ungerstedt, 1968). We thus treated microglia with 6-OHDA to explore the specificity of potentiation of TNF-α expression by MPP+. As shown in Supporting Information, Figure 2c, 6-OHDA pretreatment did not affect the TNF-α expression induced by LPS.
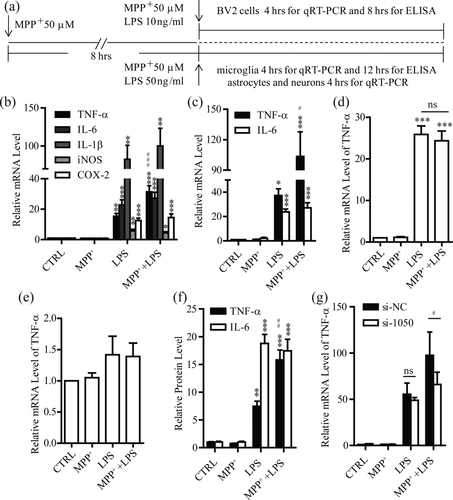
Potentiation of TNF-α expression by MPP+ in microglia. (a) The experimental schematics for (b–i). (b–e) After treatment with MPP+ or/and LPS, qRT-PCR examination of mRNA levels of TNF-α, IL-6, IL-1β, iNOS, and COX-2 in BV2 cells (b, TNF-α, IL-6, and IL-1β, n = 5, iNOS and COX-2, n = 4), primary cultured microglia (c, TNF-α, n = 5, IL-6, n = 6), astrocytes (d, n = 4) and cortical neurons (e, n = 4). (f) ELISA examination of protein levels of TNF-α and IL-6 from the supernatant in primary cultured microglia (TNF-α, n = 4, IL-6, n = 7) treated with MPP+ or/and LPS. (g) Effects of knocking down OCT3 by si-1050 on mRNA levels of TNF-α after MPP+ or/and LPS in primary cultured microglia (n = 4), si-NC as a negative control (NC). CTRL, vehicle. ns, no significance. All data were presented as mean ± SEM. Comparisons between groups for statistical significance were performed with one-way ANOVA with Tukey's post hoc test (b–f) or two-way ANOVA with Bonferroni post hoc test (g). *p < 0.05, **p < 0.01, ***p < 0.001 versus NC or CTRL. #p < 0.05, ##p < 0.01, ###p < 0.001 versus LPS group
We next measured TNF-α protein level by enzyme-linked immunosorbent assay (ELISA) (Figure 2a). Consistently, protein level of TNF-α was also notably potentiated by MPP+ in microglia and BV2 cells. In contrast, IL-6 protein level was not changed between MPP+ with LPS group and LPS group (Figure 2f and Supporting Information, Figure 2a). Therefore, MPP+ specifically potentiated TNF-α production in microglia.
To study whether OCT3 was involved in the MPP+ potentiation of TNF-α production, we introduced si-1050 into microglia and BV2 cells to knock down OCT3. The potentiation of TNF-α production by MPP+ was not observed when OCT3 was knocked down in microglia and BV2 cells (Figure 2g and Supporting Information, Figure 2b). Collectively, these results point to a possibility that MPP+ was uptaken via OCT3 in microglia to potentiate the subsequent TNF-α production induced by LPS.
3.3 Transcription of TNF-α is not affected by MPP+
In the next attempt to study whether the MPP+ potentiation of TNF-α production was due to the enhancement of its transcription activity, chromosome immunoprecipitation (ChIP) was conducted to evaluate the transcriptional activity of TNF-α promoter. By quantitative real-time PCR (qRT-PCR) analysis, we found that there was no difference in the level of TNF-α promoter pulled down by Polymerase II (Pol II) between MPP+ with LPS group and LPS group (Figure 3a). Furthermore, we constructed a luciferase reporter to monitor TNF-α promoter activity by inserting the mouse TNF-α promoter into the start of the gene of luciferase. In accordance with the result of Pol II immunoprecipitation, the expression level of luciferase was not changed after MPP+ with LPS, compared to LPS alone (Figure 3b). Together, these results are consistent with an explanation that increased level of TNF-α mRNA by MPP+ was not due to the enhancement in its transcriptional activity.
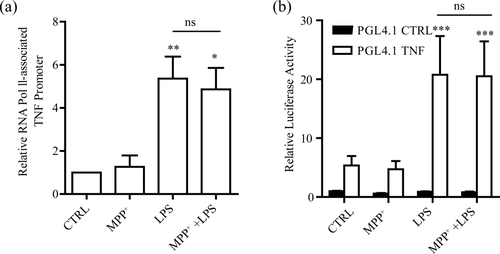
TNF-α transcription is not affected by MPP+. (a) qRT-PCR examination of TNF-α promoter levels pulled down by polymerase II (Pol II) in BV2 cells after MPP+ (50 μM, 12 hr) or/and LPS (10 ng/ml, 4 hr), one-way ANOVA with Tukey's post hoc test, n = 5. (b) Luciferase activity of BV2 cells transfected with firefly luciferase reporter constructs (pGL4.1) containing the TNF-α promoter for 24 hr, two-way ANOVA with Bonferroni post hoc test, n = 5. All luciferase data were normalized to Renilla luciferase. CTRL, vehicle or pGL4.1 basic. ns, no significance. All data were presented as mean ± SEM. *p < 0.05, **p < 0.01, ***p < 0.001 versus CTRL
3.4 The miR-7116-5p is responsible for TNF-α overproduction by MPP+
It has been known that mRNA of TNF-α can be regulated by microRNAs (miRNAs) at post-transcription level (Guan et al., 2015; Tili et al., 2007; Zhang et al., 2012). Therefore, we examined the role of miRNAs in MPP+ potentiation of TNF-α production in microglia. We then performed small RNA sequencing to search miRNA candidates that could target TNF-α and be responsible for the MPP+ potentiation of TNF-α production. After careful analysis, we found that mmu-miR-7116-5p, whose seed sequence could perfectly target to the 3′ untranslated regions (UTR) of mouse TNF-α, was downregulated by MPP+ (Figure 4a). To assess the possible regulation of TNF-α by miR-7116-5p, the 3′ UTR of mouse TNF-α and its seed sequence mutants (AT exchange mutant, GC exchange mutant, and 8 nucleotides (8 nts) mutant) were cloned into a luciferase reporter construct. We found that miR-7116-5p largely inhibited the luciferase activity in HEK293 cells transfected with wild-type 3′ UTR of mouse TNF-α. When transfecting HEK293 cells with mutants, the inhibition of luciferase activity by miR-7116-5p was partially (AT and GC exchange mutant) or totally (8 nts mutant) stopped (Figure 4b).
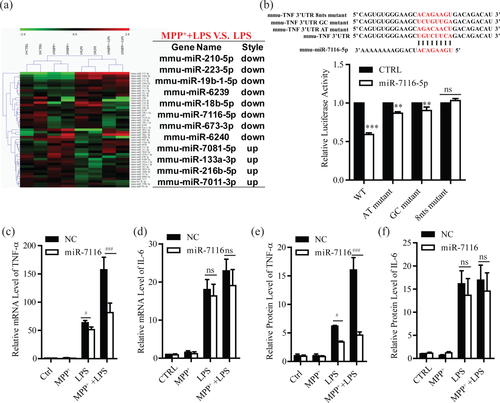
miR-7116-5p is responsible for potentiation of TNF-α production by MPP+. (a) Heat map of the miRNAs upregulated or downregulated after MPP+ (50 μM, 12 hr) or/and LPS (10 ng/ml, 4 hr) (p < 0.05) in BV2 cells (left panel). Right panel shows the changed expression of miRNAs in MPP+ and LPS group versus LPS group. (b) Sequence alignment of miR-7116-5p and its target sites in 3′-UTR of mouse TNF-α. The different mutants of mouse TNF-α 3′-UTR were listed above the wild-type (WT) form (top panel). The luciferase activity of HEK293 cells transfected with WT or mutants and miR-7116-5p mimics for 24 hr (bottom, n = 6). (c–f) Examination of mRNA and protein levels of TNF-α and IL-6 in microglia (c, n = 4; d, n = 6; e, n = 6; f, n = 6) transfected with miR-7116-5p mimics for 24 hr and then treated with MPP+ (50 μM, 12 hr) or/and LPS (50 ng/ml, 4 hr for qRT-PCR, 12 hr for ELISA). NC, negative microRNA mimic control. CTRL, vehicle. ns, no significance. All data were presented as mean ± SEM. All comparisons between groups for statistical significance were performed with two-way ANOVA with Bonferroni post hoc test. **p < 0.01, ***p < 0.001 versus NC or CTRL. #p < 0.05, ###p < 0.001 versus LPS group [Color figure can be viewed at wileyonlinelibrary.com]
To further verify the regulation of TNF-α by miR-7116-5p in response to MPP+ and LPS, mimics of miR-7116-5p were introduced into microglia and BV2 cells, and expression of TNF-α was then analyzed by qRT-PCR and ELISA. The miR-7116-5p greatly suppressed the MPP+ potentiation of TNF-α production, compared to the group transfected with control mimics (Figure 4c,e and Supporting Information, Figure 3a,c). In contrast, the expression of IL6 was not changed by miR-7116-5p (Figure 4d,f, and Supporting Information, Figure 3b,d). Taken together, these results suggest that MPP+ downregulates miR-7116-5p to potentiate TNF-α production in microglia.
3.5 The miR-7116-5p is specifically downregulated in microglia in mouse MPTP model
We next verified the MPP+ downregulation of miR-7116-5p by northern blot and qRT-PCR. The level of miR-7116-5p was markedly suppressed in microglia and BV2 cells incubated with MPP+ (Figure 5a,b and Supporting Information, Figure 4a), whereas its level was not affected when incubated with LPS (Figure 5b and Supporting Information, Figure 4a), consistent with the results obtained by small RNA sequencing. However, the level of miR-125b-5p, a miRNA known to target TNF-α mRNA (Guan et al., 2015; Tili et al., 2007), was not affected by MPP+ (Figure 5c and Supporting Information, Figure 4b). In addition, no difference was found in the level of miR-7116-5p in microglia incubated with 6-OHDA (Supporting Information, Figure 5). Moreover, suppression of miR-7116-5p by MPP+ was largely prevented when the OCT3 was downregulated by si-1050 in microglia and BV2 cells (Figure 5d and Supporting Information, Figure 4c).
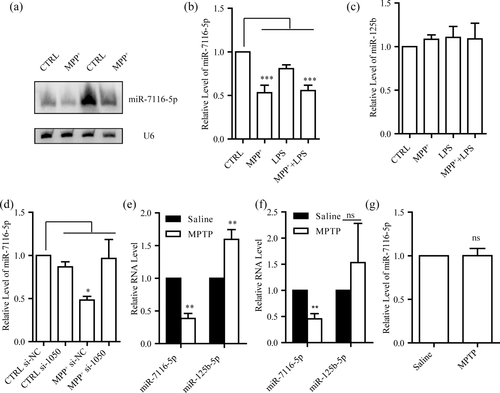
Downregulation of miR-7116-5p by MPP+ in microglia. (a) Northern blot analysis for miR-7116-5p after MPP+ (50 μM, 12 hr). (b,c) qRT-PCR examination of levels of miR-7116-5p and miR-125b after MPP+ (50 μM, 12 hr) or/and LPS (50 ng/ml, 4 hr) in microglia (n = 5). (d) Effects of knocking down OCT3 on level of miR-7116-5p after MPP+ (50 μM, 12 hr) in microglia (n = 4). (e,f) qRT-PCR examination of levels of miR-7116-5p and miR-125b in microglia sorted from ventral mesencephalon (VM) one-day (e, n = 4) or three-day (f, miR-7116-5p n = 5, miR-125b n = 4) after administration of MPTP. (g) qRT-PCR examination of level of miR-7116-5p in astrocytes sorted from VM 3 days after administration of MPTP, n = 7. CTRL, vehicle. ns, no significance. All data were presented as mean ± SEM. Comparisons between groups for statistical significance were performed with one-way ANOVA with Tukey's post hoc test (b–d) or student's test, two tails (e–g). *p < 0.05, **p < 0.01, ***p < 0.001 versus CTRL or saline group
To investigate the regulation of miR-7116-5p in the mouse MPTP model, we studied the expression of miR-7116-5p in microglia 1 day and 3 days after MPTP administration, on which there is a notable activation of microglia (Brochard et al., 2009). Microglia was sorted by crossing cluster of differentiation molecule 11B (CD11b) and CD45 antibodies staining from the single-cell suspension of ventral mesencephalon (VM) (Supporting Information, Figure 6a, b, and e). We found that miR-7116-5p level in microglia from the VM of the mice injected with MPTP was greatly reduced compared to that in microglia from the VM of the mice injected with saline. On the contrary, the level of miR-125b-5p showed a transient increase in MPTP-treated mice (Figure 5e,f). Meanwhile, we also examined the expression of miR-7116-5p in astrocytes sorted by incubation with glutamate aspartate transporter (GLAST) antibody (Supporting Information, Figure 6c, d, and f). Three days after MPTP administration, expression of miR-7116-5p in astrocytes was not changed (Figure 5g). Collectively, our results suggest that miR-7116-5p level in microglia in mice was specifically suppressed by MPP+.
3.6 Increasing miR-7116-5p expression in microglia prevents overproduction of TNF-α and reduces loss of TH+ neurons in mouse MPTP model
The results above suggest that downregulation of miR-7116-5p occurred in microglia in cultures or in mice in response to MPP+ or MPTP, respectively. To study the role of miR-7116-5p in regulation of TNF-α production in mouse MPTP model, we engineered an adeno-associated virus (AAV), in which expression of green fluorescent protein (GFP)-miR-7116 was modulated by an upstream transcriptional insulator (STOP sequence) flanked by loxP sites (LoxP-STOP-LoxP, or LSL). The expression of GFP-miR-7116 occurs only if the STOP insulator is excised in the cells expressing Cre recombinase. We next delivered the LSL-GFP-miR-7116 AAV to the VM of CD11b-Cre recombinase transgenic mice to express miR-7116 specifically in microglia (Supporting Information, Figure 7). As shown in Figure 6a, the mRNA expression of TNF-α, IL-1β, IL-6, iNOS, and COX-2 in VM was not changed in the mice injected with LSL-GFP-miR-7116 AAV and saline. In contrast, the expression of TNF-α in VM was greatly reduced in CD11b-Cre mice injected with LSL-GFP-miR-7116 AAV, compared with those injected with LSL-GFP AAV, 1 day after administration of MPTP, while the levels of IL-1β, IL-6, iNOS, and COX-2 were not changed between these two groups (Figure 6a). However, 3 days after administration of MPTP, the expression of these factors was largely reduced in LSL-GFP-miR-7116/CD11b-Cre mice, compared to that in LSL-GFP/CD11b-Cre mice (Figure 6b). Moreover, infusion of TNF-α antibody into the lateral ventricles of MPTP mice also greatly suppressed the expression of TNF-α, IL-1β, IL-6, iNOS, and COX-2 3 days after administration of MPTP (Supporting Information, Figure 8). These results support an explanation that downregulation of miR-7116-5p in microglia initially potentiated the production of TNF-α after MPTP, which then amplified the production of other proinflammatory factors.
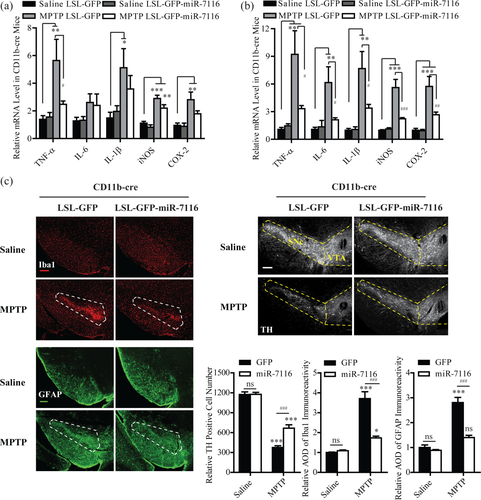
Enhanced expression of miR-7116-5p in microglia suppresses overproduction of TNF-α and reduces DA neuronal loss in the MPTP model. (a,b) qRT-PCR examination of mRNA levels of TNF-α, IL-6, IL-1β, iNOS, and COX-2 in ventral mesencephalon (VM) of CD11b-Cre mice injected with LSL-GFP-mir-7116 or LSL-GFP adeno-associated virus (AAV) 1 day (a, TNF-α, IL-1β, and COX-2, n = 6, IL-6 and iNOS, n = 7) or 3 days (b, n = 6) after administration of MPTP or saline. (c) Staining with antibodies against Iba1, GFAP (left panel), or TH (right-top panel) in VM of CD11b-Cre mice injected with LSL-GFP-mir-7116 or LSL-GFP AAV 7 days after administration of MPTP or saline. Right-bottom, quantification of Iba1-, GFAP- or TH-positive cells after MPTP, TH, and GFAP n = 8, Iba1 n = 7. SNc, pars compacta of substantia nigra; VTA, ventral tegmental area; CD11b, crossing cluster of differentiation molecule 11B; TH, tyrosine hydroxylase; GFAP, glial fibrillary acidic protein; Iba1, ionized calcium-binding adapter molecule 1. Dashed boxes indicate Iba1-, GFAP-, or TH-positive cells in SNc or VTA. Scale bar, 200 μm. ns, no significance. All data were presented as mean ± SEM. All comparisons between groups for statistical significance were performed with one-way ANOVA with Tukey's post hoc test. *p < 0.05, **p < 0.01, ***p < 0.001 versus saline-GFP group. #p < 0.05, ##p < 0.01, ###p < 0.001 versus MPTP-GFP group [Color figure can be viewed at wileyonlinelibrary.com]
As there is a substantial activation of microglia and astrocytes in the area of SN in the MPTP model (Shao et al., 2013), we next explored the role of miR-7116-5p in regulation of the activation of microglia and astrocytes. Consistent with the above results on the production of the proinflammatory factors, the expression of ionized calcium binding adaptor molecule 1 (Iba1), a marker for microglia, and glial fibrillary acid protein (GFAP), a marker for astrocytes, in mice injected with saline were not affected by the enhancement of miR-7116-5p expression, whereas the expression of these two glia markers in mice injected with MPTP were largely reduced by miR-7116-5p (Figure 6c).
We then explored whether the reduction of inflammation resulted from enhanced expression of miR-7116-5p affects DA neuronal loss by counting the number of TH-positive neurons. The LSL-GFP-miR-7116 AAV alone did not change the number of DA neurons in SN. However, the DA neuronal loss in LSL-GFP-miR-7116 AAV-injected CD11b-Cre mice 7 days after MPTP was markedly prevented, compared to that in LSL-GFP-AAV-injected CD11b-Cre mice (Figure 6c). Collectively, all these results are consistent with an explanation that enhancement of miR-7116-5p expression suppresses the overproduction of TNF-α to reduce the inflammatory activation, which then prevents loss of DA neurons in the MPTP model.
4 DISCUSSION
Here, we report a novel mechanism by which MPP+ potentiation of TNF-α production in microglia contributes to damage of DA neurons. Several lines of evidence support this conclusion. First, microglia uptook MPP+ through OCT3. Second, MPP+ alone did not induce the production of the proinflammatory factors, but specifically potentiated the production of TNF-α without affecting the expression of IL-1β, IL-6, COX-2, or iNOS in microglia. Third, MPP+ potentiated TNF-α production via downregulation of miR-7116-5p. Last, elevating the expression of miR-7116-5p specifically in microglia prevented the overproduction of TNF-α and reduced loss of DA neurons in the mouse MPTP model. Together, our results suggest a model that in addition to its direct inhibitory effects on neuronal survival, MPP+ could also damage the DA neurons by potentiating TNF-α production in microglia in a manner that is dependent on the inflammation induced by DA neuron damage (Figure 7). Therefore, inhibiting the reduction of miRNAs to suppress the exacerbated inflammation induced by MPP+ or other environmental neurotoxins could be a promising strategy to prevent neurodegeneration of PD.
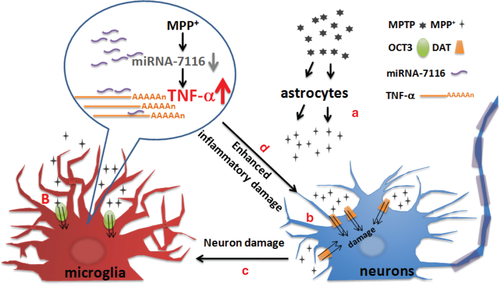
Schematic diagram depicting a working model for MPP+ potentiates TNF-α production and contributes to DA neuron damage. (a) MPP+ is metabolized from MPTP by astrocytes and released to extracellular spaces. (b) MPP+ is uptaken through DAT by DA neurons and OCT3 by microglia. (c) Microglia is activated by neuron damage resulted from MPP+ toxicity. (d) MPP+ potentiates TNF-α production through downregulation of miR-7116 to induce the inflammatory damage of DA neurons [Color figure can be viewed at wileyonlinelibrary.com]
It has been reported that OCT3 is expressed in neurons and astrocytes (Cui et al., 2009; Shang, Uihlein, Van Asten, Kalyanaraman, & Hillard, 2003). However, MPP+ in microglia, but not in astrocytes or neurons, potentiated the production of TNF-α. It is not clear at the present why MPP+ specifically potentiated the TNF-α production in microglia. A possible explanation is that MPP+ metabolized from MPTP in astrocytes is released to extracellular spaces (Di Monte, Wu, & Langston, 1992) and OCT3 in astrocytes primarily mediates the release of MPP+ in mouse MPTP model (Cui et al., 2009), whereas OCT3 in microglia uptakes MPP+. Another possibility is that OCT3 in astrocytes and microglia has different roles in affecting the downstream events of MPP+. Clarification of the mechanism by which OCT3 exhibits different roles in transportation of MPP+ by different cells will further expand our understanding on its physiological roles.
Previous studies have uncovered the regulation of miRNAs by MPP+ in DA neurons or their cell lines (Asci et al., 2013; Niu, Xu, Wang, Hou, & Xie, 2016), while little is known about miRNA regulation by MPP+ in microglia. Thus, one of the important findings of this study is that miR-7116-5p in microglia is downregulated by MPP+. Although a series of miRNAs is found to inhibit TNF-α production in different cell types (Guan et al., 2015; Tili et al., 2007; Zhang et al., 2012), miR-7116-5p in microglia is first identified as a miRNA targeting TNF-α in response to MPP+. Recently, in a clinical study of expression of miRNAs in PD patients, hsa-miR-542-3p was found significantly downregulated in the SN of 8 PD patients, compared with four healthy donors. Additionally, hsa-miR-542-3p might target human TNF-α as predicted by several bioinformatic tools, such as miRandola and TargetScan (Cardo et al., 2014). In this context, it is possible that miRNA regulation of TNF-α production affects DA neuron survival in PD patients and in other animal models. It remains unclear how miR-7116-5p in microglia is downregulated. Reported studies have proposed that transcription-dependent or -independent mechanisms are involved in the regulation of miRNA levels (Winter, Jung, Keller, Gregory, & Diederichs, 2009; Zhang et al., 2015). Clarifying the mechanism underlying the downregulation of miR-7116-5p by MPP+ in microglia will help our understanding of the miRNA regulation of TNF-α production in PD patients.
An important implication of the current findings is that a key inflammatory factor regulates consequent inflammatory responses contributing to the pathogenesis of PD. Here, the change in TNF-α expression well precedes the change in IL-1β, IL-6, iNOS, and COX-2 expression. Inhibition of TNF-α expression could almost abolish the consequent inflammatory responses and reduce neuronal damage. Therefore, it suggests that inhibiting inflammation would be unsuccessful to protect DA neurons when exacerbated inflammation and irreversible neuron damage have occurred. Therefore, targeting the key inflammatory factor in early stage of pathogenesis of PD would probably be more effective. Indeed, the current preliminary evidence of clinical trials of neurodegenerative diseases such as Alzheimer's disease (AD) indicates that there is no beneficial effect to target inflammation in AD patients who have been with significant symptoms (McGeer & McGeer, 2007; Reines et al., 2004; Scharf, Mander, Ugoni, Vajda, & Christophidis, 1999). Therefore, new and early strategies should be proposed to prevent neuron damage resulted from the inflammatory injury.
Collectively, our results point to a previously unknown role of microglia in uptaking MPP+ and existence of an MPP+-miR-7116-5p pathway in microglia that specifically regulates TNF-α production to affect DA neuron survival. The demonstration of miR-7116-5p-dependent TNF-α production in microglia further expands our understanding of the diverse functions of microglia.
ACKNOWLEDGMENT
We thank J. Zhou for helpful discussion and Q. Hu for imaging. This work was supported by the National Natural Science Foundation of China (81130081).


