Analysis of cofermentation characteristics of Lactobacillus bulgaricus and Streptococcus thermophilus based on microrheology
Abstract
The fermented milk mainly consists of Lactobacillus bulgaricus and Streptococcus thermophilus. This research was aimed to investigate the cofermentation characteristics of different L. bulgaricus and S. thermophilus strains. Three strains of L. bulgaricus and S. thermophilus ST-2 were mixed and prepared into the starter (A, B, and C) and applied to milk fermentation for screening of optimal combination, and the commercial starter (D) was used as the reference. The microrheological properties during fermentation were analyzed by using multifrequency diffusion spectroscopy. Meanwhile, the fermented milk's stability, texture, and sensory characteristics were also observed during storage. Microrheology analysis revealed that the time to reach the fermentation endpoint of starters A, B, and C was almost the same during fermentation. Groups A, B, and C showed more elastic solid-state properties and groups A and C had higher elastic factors, indicating that the gel structure of the sample was relatively strong. During storage, the pH value of fermented milk in each group D, A, C, and B was in sequence from high to low, and the titratable acidity was also in sequence from high to low in B, C, A, and D groups, respectively. The viscosity of group A was significantly higher than that of groups B and C (p < 0.05), and there was no change in group D (p > 0.05). The sensory score of fermented milk in group A was higher, and the overall texture was good. Results concluded that group A starter culture produced fermented milk with a firm gel structure and excellent texture and flavor. This study will provide data support and methodology for developing and screening compound starters applied for milk fermentation in the future.
1 INTRODUCTION
Lactic acid bacteria have long been used and widely accepted as the safest bacteria in various fermented foods. The typical yogurt starters are prepared by Streptococcus salivarius subsp. thermophilus and Lactobacillus delbrueckii subsp. bulgaricus. The final product characteristics of fermented milk are closely related to the starters. These strains of bacteria are coexisted and the most commonly used starters in fermented dairy products (Sha et al., 2015). Both L. bulgaricus and S. thermophilus provide nutrient metabolism substances to each other symbiotically in the compound fermentation process. In this process, lactose is converted into lactic acid through lactic acid fermentation, and protein is degraded into peptides and amino acids, ultimately improving the bacterial strain's growth rate and accelerating raw materials’ lactic acid content. It also gives dairy products their particular texture and flavor, and their functioning and nutritional worth are also improved, along with the efficacy of special diet therapy (Jie, 2018; Yuqing, 2018).
Optical microrheology is an analytical technique that detects backscattered light from a sample to characterize changes in that rheological property and internal structure of dispersion in a static and undisturbed condition. The back-scattering speckle images of the samples with a given wavelength are detected to determine the motion state of the particles in the dispersion, that is, the relationship between the mean square displacement (MSD) and decorrelation time, which is used to characterize the rheological parameters of the dispersion (Yue et al., 2021). Microrheology indicates the viscoelastic changes of samples by tracking the particle movement in the system. It can be used to study the rheological properties of samples without causing damage to them. Its sensitivity is higher than that of mechanical rheology. It has been successfully used to study the rheological properties of chymosin-induced casein gel (S. Zhan et al., 2019). Microrheology can reflect the changing law of the rheological properties of fermented milk with time. The rheological properties of fermented milk in the fermentation process affect the texture of fermented milk, and thus influence the taste (Jian et al., 2018).
The strains used in this research were obtained from the Lactic Acid Bacteria Collection Center (LABCC) of Inner Mongolia Agricultural University. S. thermophilus ST-2, which was fast acid producing by naturally fermented yogurt in Qinghai, and three L. bulgaricus strains with different genetic backgrounds and isolation sources (IMAU20450 isolated from Mongolian traditional sour yak milk, IMAU95110 isolated from traditional Russian yogurt, and IMAU62091 isolated from Chinese Tibetan sour yak milk) were compounded. In this paper, microrheological properties of lactic acid bacteria fermented milk were studied during fermentation, and the pH, titratable acidity (TA), viscosity, texture, water-holding capacity, and organoleptic properties of the fermented milk stored at 10°C for 21 days were measured to evaluate the effects of different starter combinations on the stability of the product. Based on the cofermentation characteristics of L. bulgaricus and S. thermophilus with different desirable traits, this paper aimed to develop yogurt starters with excellent production and application characteristics and also provide a theoretical basis for industrial production.
2 MATERIALS AND METHODS
2.1 Materials and instruments
2.1.1 Test strains and medium
S. thermophilus ST-2, L. bulgaricus IMAU20450, IMAU95110, IMAU62091, all of them were provided by LABCC of Inner Mongolia Agricultural University. The YF-L904 commercial direct-throw starter was purchased from CHR-Hansen (China) Co., Ltd. (strain composition: L. bulgaricus and S. thermophilus).
2.1.2 Experimental grouping
The grouping information of this experiment is shown in Table 1.
| Streptococcus thermophilus ST-2 (CFU/ml) | Lactobacillus bulgaricus IMAU20450 (CFU/ml) | L. bulgaricus IMAU95110 (CFU/ml) | L. bulgaricus IMAU62091 (CFU/ml) | |
|---|---|---|---|---|
| A | 2 × 10⁶ | 2 × 10³ | — | — |
| B | 2 × 10⁶ | — | 2 × 10³ | — |
| C | 2 × 10⁶ | — | — | 2 × 10³ |
| D | Commercial starter 0.03‰ (m/m) 200 U/ton ≈ 106 CFU/g | |||
2.1.3 Main test materials
Milk (Mengniu Dairy (Group) Co., Ltd.); White sugar (Guangxi Fengtang Biochemical Co., Ltd.)
2.2 Test methods
2.2.1 Preparation of fermented milk
The 94% (m/m) milk was heated to 65°C after adding 6% (m/m) white sugar. Then milk was homogenized at 20 MPa, sterilized at 95°C for 5 min, cooled to 42°C and inoculated with starters. The samples were fermented at 42°C to pH 4.50, cooled in an ice water bath, and then aged at 4°C for 1 day. After that, these were stored at 10°C for 21 days, and readings were taken every 7 days during storage.
2.2.2 Measurement of microrheological properties
20 ml of inoculated milk sample was poured into a specific glass tube (inner diameter 27.5 mm) for a sterile microrheometer. The glass tube was quickly transferred to the measuring tank, and the rheometer was set at 42°C. Rheometer readings were noted after every minute until the end of fermentation. The original data are collected and analyzed by the software on the instrument, and the rheological parameters, including Macroscopic viscosity indexes (MVI), Elasticity indexes (EI), and Solid–liquid balance (SLB) were analyzed.
2.2.3 Determination of acidity
The pH value was directly measured by the FE28 pH meter. According to the method of determination of acidity of milk and other dairy products in GB 5413.34-2010, the Titration acidity of each sample was determined in three groups in parallel (GB 5413.34., People's Republic of China Ministry of Health, 2010).
2.2.4 Determination of viscosity
The fermented milk samples' viscosity was measured at room temperature using a Brookfield DV-2T viscometer by running the samples in parallel three times. The measurement conditions include a rotating speed of 100 r/min, a torque of 10%–100%, and a measurement time 30 s (Shujuan et al., 2022).
2.2.5 Determination of water-holding capacity
2.2.6 Analysis of texture characteristics
The changes in Firmness, Consistency, Cohesiveness, and Viscosity index of fermented milk after storage were detected by TA. XT plus texture analyzer. The fermented milk samples were measured by a single compression cycle test with a 5 kg load cell (Yildiz & Ozcan, 2019). Select A/BE as the probe. The speed was set at 1 mm/s, and the penetration depth was 30 mm throughout the test. Samples were taken out at 10°C and returned to room temperature for testing with three samples in each group in parallel.
2.2.7 Sensory evaluation
Ten students were selected to form a sensory evaluation group necessary training was provided to them related to sensory evaluation. The fermented milk was presented for sensory evaluation after fermentation completion and postmaturation at 4°C for 1 day, with each item receiving 20 points. The sensory evaluation criteria for fermented milk samples is shown in Table 2 (Shujuan et al., 2022).
| Sensory characteristics | Description and scoring | ||
|---|---|---|---|
| 20–15 points | 15–10 points | 10–0 points | |
| Appearance | Smooth surface, no whey precipitation | The surface is smooth with a small amount of whey precipitated | The surface is not smooth, and a large amount of whey is precipitated |
| Taste | Smooth taste | The taste is a slightly smooth | Slightly smooth taste |
| Flavor | Has good flavor and no other lousy smell | Has good flavor and no other bad smell | Have a lousy smell |
| Tissue state | The microstructure is fine, and the clot size is uniform | Fine tissue, uneven clot size | Rough tissue and uneven clot size |
| Like | Very like | General like | No like |
2.2.8 Data analysis
Samples in each group were evaluated at least three times for parallelism, and the results were expressed by “mean-variance.” SPSS was used to analyze the differences among samples, and p < 0.05 showed statistically significant differences. The microrheological data was analyzed by the Smart software of Rheolaser Master optical microrheological analyzer. Origin 2018 software was used for drawing.
3 RESULTS AND DISCUSSION
3.1 Microrheological test results of SLB during fermentation
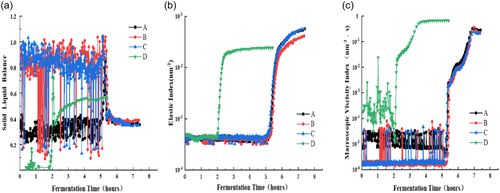
In this study, multifrequency diffusion spectroscopy was used to examine the microrheological characteristics of the gel process of fermented milk with different probiotics. EI are proportional to the elastic modulus as time passes, while MVI are proportional to the viscous modulus. The Fluidity index (FI) represents the speed of microparticle movement, and SLB is proportional to the viscoelastic properties of products (Titapiccolo et al., 2011).
SLB directly shows that the product tends to be solid state or the functional relationship between liquid state and time. When 0 < SLB < 0.5, the elastic modulus was exhibited, and the product deviation to the solid state was observed. When 0.5 < SLB < 1, it shows the viscous modulus in the liquid state (Rohart et al., 2016). Figure 1 depicts the variations in solid–liquid equilibrium. From the beginning of fermentation to 5 h, the SLB of fermented milk samples fluctuated because, as pH declined, the net negative charge of casein micelles reduced, and the electrostatic repulsion between micelles decreased, affecting the stability of micelles. At this time, the sample was liquid (Lazaridou et al., 2014), due to the continuous production of acid by the growth of the strain, the SLB value began to rise slowly after the turning point after 4 h, and the original casein aggregates were dissociated, resulting in a microviscous sample. The gel point occurred when the SLB reached 0.5; starter D reached the gel point first, followed by groups A, C, and B, respectively, from fastest to slowest. It could be seen from the figure that the fermentation time for starter D to reach the fermentation endpoint was 5 h and 30 min, while the fermentation time for starters A, B, and C was 7 h and 30 min. The difference in fermentation time may be due to the different conditions of acid production by the interaction of the strains. At the end of fermentation, the SLB value in group D was approximately 0.5, which was the highest, while the SLB values in groups A, B, and C were approximately 0.4, with group B having a slightly higher SLB value than groups A and C. The states of fermented milk A, B, and C were distinct from those of commercial starter group D. Group D had greater liquid viscosity, while A, B, and C groups exhibited excellent solid elasticity.
3.2 Test results of EI during fermentation
As a function of time, the EI can directly reflect the elastic modulus, that is, the variability of the storage modulus in a certain period, and can rapidly characterize the elastic modulus of a sample. The higher the EI value, the stronger the gel structure and the sample becomes more stable (L. He et al., 2016). The changes in EI during fermentation are shown in Figure 1b. Within the first 5 h, the EI of the fermented milk sample remained stable, but the MVI and SLB values significantly fluctuated during this period because casein did not form a gel network structure, and the sample exhibited an unstable state of low viscosity, low elasticity, and high fluidity (J. He et al., 2019). The commercial starter D initially showed a rapid vertical rise at the inflection point and reached the gel point, and around 5 h, a similar trend was observed in groups A, B, and C. With the prolonged fermentation time, casein in fermented milk was completely dissociated and rapidly aggregated to form a gel structure (Yanan et al., 2019). At the end of fermentation, EI values of A and C were higher, the gel structure was stronger, and the sample was relatively stable.
3.3 Test results of MVI during fermentation
MVI reflect samples' viscosity characteristics at the micron scale (Zhu et al., 2018). MVI can directly represent the formation of viscosity modulus, that is, the change in loss modulus in a specific time, which can indicate the change in viscosity of fermented milk (Lazaridou et al., 2014). The variations in MVI during fermentation are shown in Figure 1a. From the beginning of fermentation to about 5 h, the MVI values of each group maintain a certain level fluctuation at the same period because the gel network structure has not yet been established, which is the initial stagnation stage of low viscosity (Jian et al., 2018). After 5 h in groups A, B, and C, the sample MVI showed a rapidly increasing trend, which might be due to the dissociation of casein micelle and the initiation of gel formation in the emulsion, entering the stage of rapid viscosity change. Afterward, the MVI of each fermented milk sample subsequently increased its maximum value and entered the high viscosity stage (Y. Zhang et al., 2017). The same trend appeared in group D around 2 h. However, the viscosity production rate in group A was slightly higher than in groups B and C, and the difference was insignificant.
3.4 Changes in fermented lactic acid degree during storage
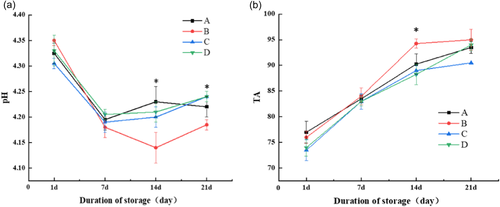
The viability of lactic acid bacteria during fermentation and storage, as well as the quality of fermented dairy products, are influenced by pH value and TA. The primary function of fermented milk starter is to produce lactic acid (Mishra & Mishra, 2013). Figure 2 shows the change in lactic acid concentration and the pH of each group decreased rapidly during storage (p < 0.05). TA increased first (p < 0.05) and then decreased slightly during storage, but the change was small and finally stabilized within 95°T. On the 14th and 21st days of storage, the pH values of starters A and C were significantly higher than that of starter B (p < 0.05), which was similar to that of commercial starter. When starters A and C were held for 21 days (p < 0.05), their TA values were considerably lower than that of starter B, indicating that starters A and C had weak postacidification ability.
3.5 Changes in viscosity of fermented milk during storage
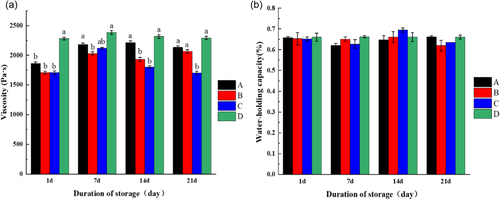
Fermented milk is an irreversible gel; its viscosity is an important indicator, and an appropriate viscosity can result in good sensory quality (Delikanli and Ozcan, 2015). The changes in the viscosity of fermented milk during storage are shown in Figure 3a. The viscosity of starter A was higher than that of starters B and C (p < 0.05), and it increased initially and then decreased with the prolongation of storage time. During storage, starter A could significantly increase the viscosity of fermented milk hence improving the product quality.
3.6 Changes in the water-holding capacity of fermented milk during storage
The variations in the water-holding capacity of the fermented milk during storage are shown in Figure 3b. The water-holding capacity of the fermented milk was related to its tissue state. The tissue state with strong water-holding capacity was favorable and prevented whey from precipitation. The water-holding capacities of the four groups of fermented milk were similar, with an average water-holding capacity of 65 ± 0.58%, indicating that the gel structures of the fermented milk samples of starters A, B, and C were relatively stable, thereby improving product quality.
3.7 Changes in texture characteristics
In this study, the texture of four types of fermented milk samples was determined during storage to evaluate the effect of varying protein concentrations on the texture of fermented milk (Table 3). The measured parameters include hardness, consistency, cohesion, and viscosity index. The fermented milk of starter B reached its maximum hardness within 21 days of storage, and the difference was significant (p < 0.05). The high consistency of fermented milk refers to high-density viscous products. With the extension of storage time, the consistency of samples gradually increased, and the consistency of starters A and starter B was significantly higher than other groups (p < 0.05). The cohesion and viscosity index of starter A and B were significantly higher than those of starter C and D (p < 0.05). Some previous studies found that cohesion is related to the strength of gel composition, which reflects the water-holding characteristics of fermented milk (Delikanli & Ozcan, 2015).
| Group | 1 day | 7 day | 14 day | 21 day | |
|---|---|---|---|---|---|
| Hardness (g) | A | 41.72 ± 2.93b | 53.42 ± 1.22ab | 53.25 ± 1.21a | 57.66 ± 0.85a |
| B | 40.58 ± 0.21b | 55.76 ± 0.86a | 50.91 ± 4.99ab | 54.18 ± 2.86a | |
| C | 41.23 ± 0.96b | 51.80 ± 1.60b | 45.75 ± 0.01b | 48.83 ± 0.41b | |
| D | 46.26 ± 2.04a | 52.72 ± 0.71b | 50.45 ± 0.29ab | 49.70 ± 0.75b | |
| Consistency (g.s) | A | 337.93 ± 14.26b | 428.17 ± 5.35ab | 420.61 ± 13.53a | 483.95 ± 1.54 a |
| B | 326.94 ± 2.83b | 432.85 ± 11.45a | 409.99 ± 36.82ab | 436.99 ± 17.5b | |
| C | 325.77 ± 4.05b | 415.06 ± 10.09b | 367.56 ± 4.22b | 390.28 ± 3.79b | |
| D | 376.27 ± 11.86a | 422.64 ± 0.44ab | 401.20 ± 1.91ab | 403.02 ± 8.15b | |
| Cohesion (g) | A | 38.079 ± 2.56b | 49.32 ± 0.27a | 48.98 ± 0.96a | 52.46 ± 0.23a |
| B | 36.81 ± 1.20b | 52.03 ± 0.63a | 47.79 ± 4.98b | 52.51 ± 3.70a | |
| C | 34.65 ± 0.69b | 51.40 ± 2.34a | 41.31 ± 1.23a | 45.27 ± 1.37b | |
| D | 47.65 ± 5.94a | 50.69 ± 2.68a | 49.44 ± 1.57a | 47.48 ± 0.67b | |
| Viscosity index (g.s) | A | 43.30 ± 4.99b | 59.76 ± 1.09a | 58.30 ± 1.81a | 62.12 ± 1.16a |
| B | 42.08 ± 0.21b | 64.56 ± 2.04a | 54.87 ± 5.39ab | 61.99 ± 3.94a | |
| C | 42.20 ± 0.90b | 57.85 ± 2.01a | 49.01 ± 0.73b | 53.69 ± 0.05b | |
| D | 53.87 ± 4.29a | 59.56 ± 0.19a | 59.10 ± 1.8a | 57.15 ± 2.19b |
- Note: The results were expressed as the mean standard deviation, and the different lettered horns at the upper right of the values indicated significant differences in the same column (p < 0. 05).
3.8 Sensory evaluation of fermented milk
Food sensory evaluation was based on the human body's five senses to judge the product's indicators. The method was practical and reliable, playing the most intuitive and vital role in food evaluation. Currently, no technology can fully replace the human sense organs for food sensory evaluation. The vertical view of the sensory evaluation of fermented milk with the four starters is shown in Figure 4. There were differences among the four yoghurts in appearance, taste, flavor, tissue state, and favorite degree. The appearance of fermented milk scores was as follows: D = A > C > B, with A and D having the highest and most similar values. In terms of mouthfeel, the smoothness of fermented milk from various groups ranked as follows: A > D > C > B, and the fermented milk from group A had the smoothest mouthfeel. From the aspect of flavor, group A had good flavor and no other unpleasant odor. The flavor scores of groups D and B were close, and the flavor score of group C was the lowest. In terms of tissue state, a tissue state is exquisite, with uniform clot size; The favorite degree of the evaluators on fermented milk was in the order of A > D > C > B.
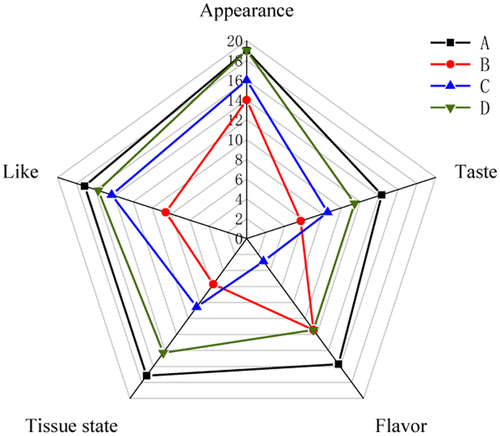
Consumers can evaluate the product's quality based on sensory characteristics such as appearance, flavor, odor, and texture. After short-term storage at 4°C for 1 day, it was found that the products of several groups did not have quality defects such as unpleasant odor and agglomeration. The fermented milk in group A had smooth taste, exquisite tissue state, and good flavor, which people liked. The good sensory quality in group A indicated that the L. bulgaricus and S. thermophilus selected for this experiment had a perfect symbiotic relationship, and they were symbiotic with each other, which improved the flavor and quality of the fermented milk. Their interaction mechanism was based on the mutual exchange and utilization of metabolites and growth-promoting factors produced by their metabolism. The sensory scores of other groups were lower than that of group A, suggesting that the interaction effect of the combination was weaker than that of group A. Many studies have also shown the symbiotic effect of L. bulgaricus and S. thermophilus. Compared with the fermentation with a single strain, the mixed fermentation of the two strains was more conducive to the formation of yogurt flavor. The symbiotic relationship formed by L. bulgaricus and S. thermophilus in the milk environment is quite complex. On the one hand, it is reflected in the symbiotic relationship of nutrition supply, such as pyruvic acid, formic acid, folic acid, urease, purine and so on. On the other hand, it is reflected in the symbiotic relationship against environmental stress, for example, NADH oxidase and glutathione can resist oxygen stress and acid stress, respectively. At the same time, lactic acid, extracellular polysaccharide, acetaldehyde, acetoin, and diacetyl promoted the formation of yogurt fermentation flavor (Xin et al., 2021). The sensory quality of the fermented milk was different due to the different strains and their proportions selected by different starters. Studies have shown (Jiale, 2021) that the different blending ratio of L. bulgaricus IMAU 20312 and S. thermophilus IMAU80809 had a greater impact on the fermentation characteristics and sensory quality of fermented milk. When the blending ratio was 1:100, the taste and flavor of fermented milk was closer to the control group. Skriver proposed that different lactic acid bacteria could be combined to achieve different fermentation performances (Skriver et al., 2003). Urshev believed that the yogurt fermentation process was mainly related to the combination of different L. bulgaricus and S. thermophilus, thus making the starter possess excellent performances such as high fermentation speed and strong characteristic flavor (Urshev et al., 2006).
In summary, starter A had a smooth appearance, smooth taste, delicate tissue state, and good flavor. The fermented milk fermented by starter A had a high score combined with the acid production, viscosity, and texture characteristics, which can satisfy the preferences of young people for fermented milk. The starter in group A has the potential for further application and development.
4 CONCLUSION
Three strains of L. bulgaricus and one strain of S. thermophilus were mixed with groups A, B, and C starters for fermentation, respectively, with commercial starter D serving as the control to explore the combined fermentation characteristics of L. bulgaricus and S. thermophilus with different traits. The microrheological results revealed that the time to reach the fermentation endpoint in groups A, B, and C was similar (p > 0.05) and approximately 2 h slower than that of group D. Group A had a higher elastic factor, indicating that the gel structure of the samples was relatively strong. The results of fermented milk during storage showed that Starter A had weak postacidification ability and good storage stability. Meanwhile, group A had the best texture state with higher viscosity. According to the sensory evaluation results, group A had the best flavor and was liked by most people. In conclusion, Starter A (S. thermophilus ST-2 + L. bulgaricus IMAU20450) has the value of an in-depth study and good application prospects. This study provided a theoretical basis, and data reference for further research on developing lactic acid bacteria starter cultures by lactic acid bacteria strain with independent intellectual property rights in China.
AUTHOR CONTRIBUTIONS
Shujuan Yang: Formal analysis; visualization; writing – original draft. Weicheng Li: Conceptualization; software. Mei Bai: Data curation; methodology. Jicheng Wang: Resources; validation. Zhihong Sun: Funding acquisition; supervision; writing – review and editing.
ACKNOWLEDGMENTS
This study was financially supported by the 2022 Basic Scientific Research Business Fee Project of Universities Directly under the Inner Mongolia Autonomous Region (BR22-14-01), the 12th Division Science and Technology Plan Project (SR202104) and Inner Mongolia Science and Technology Planning Project (2022YFSJ0017).
CONFLICT OF INTEREST
The authors declare no conflict of interest.
ETHICS STATEMENT
None declared.


