Distribution and constructed morphology of artificial foredune notches
Abstract
Foredune notches are a contemporary management intervention on coastal sand dunes, which aim to create and enhance bare sand and transitional habitats and/or increase resilience to climate change. These features consist of an excavated depression within the coastal foredune, designed to facilitate aeolian sediment transport from the beach into the inter- and back dune areas. Despite their increasing use by site managers and conservation organisations, foredune notches are under-researched, with existing analysis being almost entirely site-specific and descriptive. In this study, we present the first comprehensive, global study of these features; 133 notches were identified across the Netherlands, United Kingdom, France and New Zealand using peer-reviewed and grey literature. These notches were then verified using aerial imagery. The dimensions of 132 notches were measured using aerial imagery captured shortly after construction to understand the constructed morphology of these anthropogenic landforms. The results show that there is significant variability in constructed morphology both within and between sites. At a national scale, notches in France (average length 14.48 m, width 7.62 m, slot width 8.39 m) and New Zealand (average length 14.58 m, width 8.47 m, slot width 5.49 m) were characteristically smaller than those in the United Kingdom (average length 113.83, width 51.11 m, slot width 22.67 m) and the Netherlands (average length 109.81 m, width 81.02 m, slot width 24.67 m). There was also a large degree of variation in the relationship between landform length, landform width and ‘slot’ width, further demonstrating the diversity of current notch design. These results demonstrate that the current practice of referring to all these excavated landforms as ‘notches’ without further qualification is ineffective in communicating the diversity of size and shape of constructed foredune notches. Here, we propose a systematic classification scheme that standardises notch morphology, improving comparability across studies and enabling future research to better assess and communicate the influences of differing constructed morphology on aeolian, sediment and vegetation processes.
1 INTRODUCTION
Management of coastal sand dunes is increasingly being undertaken to mitigate the effects of dune ‘greening’, where dune systems have become more vegetated and morphologically stable over the last century (Gao et al., 2020; Jackson et al., 2019). Dynamic interventions aim to reverse or compensate for this ‘greening’ effect (Petrova et al., 2023), which has reduced bare sand and early successional wildlife habitats (Bird et al., 2020) and caused dune systems to become morphologically fixed, limiting their resilience and ability to adapt to changing environments (Gao et al., 2020). Various dynamic interventions (i.e., interventions, which aim to incorporate or restore natural processes) have been implemented since the approach first originated in the late 1980s in the Netherlands (Rooney, 2010). This dynamic approach to dune management is promoted by conservation organisations (UKCEH et al., 2021) but is criticised by some who contend that these interventions attempt to create an unnatural or anthropocentric landscape (Delgado-Fernandez et al., 2019); the primary rebuttal to this is that these systems are already highly modified and that interventions are therefore justified (Austin & Walker-Springett, 2021).
A key consideration in dynamic interventions in dunes is aeolian sediment transport (Laporte-Fauret et al., 2021). Foredune notches are a type of dynamic intervention intended to enable or stimulate aeolian sediment transport (Laporte-Fauret et al., 2021; Riksen et al., 2016; Smyth et al., 2025). These features consist of an excavated ‘slot’ through the foredune leading to a ‘lobe’ in the interdune/back dune (Figure 1) and are intended to allow sediment movement from the beach into the middle and back dune, thereby creating areas of increased bare sand and successional habitats (Riksen et al., 2016). While ‘notch’ and ‘foredune notch’ are the most used nomenclature, ‘dune gap(s)’ and ‘artificial foredune trough blowouts’ have also been used (Ruessink et al., 2024; van Kuik et al., 2022).
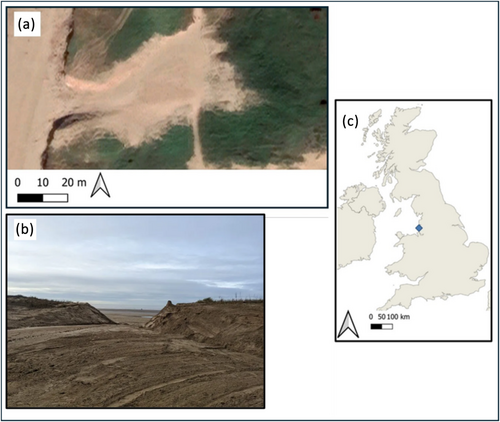
The existing literature on foredune notches consists of a small number of single-site studies (Castelle et al., 2019; Laporte-Fauret et al., 2021; Nguyen et al., 2021; Nguyen et al., 2022a, 2022b; Riksen et al., 2016; Ruessink et al., 2018) supplemented by grey literature from organisations involved in dune restoration (e.g., Pye & Blott, 2016; UKCEH, 2021). Beyond these sources, there is limited quantitative and robust information about notches more generally, and it is not known how many notches have been constructed or to what morphological design. In contrast, other geomorphic landforms, such as parabolic (Vimpere, 2023) and barchan (Goudie, 2020) dunes have been quantified, mapped and described using remote sensing datasets. While often the purpose of mapping and quantifying these features is to examine the relationships between physical processes and the geomorphic landforms (e.g., wind direction in Goudie, 2020), the information in these studies is also valuable to contextualise research as it helps justify the choice of study sites or model parameters while also illustrating research gaps.
The limited existing literature on foredune notches shows significant variation in the dimensions of these constructed features, with reported measurements varying widely both within and between published studies, for example, Ruessink et al. (2018) reported notches measuring 50–100 m wide (longshore) and 100–200 m long (cross-shore) and Nguyen et al. (2022a) reported notches ranging from 4.2–4.8 m wide and 12.6–16.4 m long. This variation has been noted within the existing research (Castelle et al., 2019; Pye & Blott, 2016; Smyth et al., 2025).
The only study to date that quantifies and evaluates this variation across more than one site is Pye & Blott (2016), which demonstrated that notches can differ substantially in their form even within a limited geographic area and management context. Drawing on three sites in Wales, Pye and Blott developed a valuable conceptual diagram to illustrate and describe this variation (Figure 2). However, this remains the only work to analyse and compare notches across multiple sites, and it takes a primarily descriptive and observational approach, rather than a systematically quantitative one that could help characterise these features more broadly.

Further complicating comparisons, previous studies have used various methods to measure notches, including DGPS field measurements (Castelle et al., 2019) and UAV-derived LiDAR measurements (Laporte-Fauret et al., 2022). However, these approaches lack standardisation, making it difficult to compare results across studies and sites.
The types of foredune notch measurement reported are somewhat consistent within the literature, with width (longshore) and length (cross-shore) being reported in all studies and depth in most. However, the specific measurement points used are not reported. For example, Castelle et al. (2019) measured ‘cross-shore length’ and ‘longshore width’, but the precise points where the measurements were taken are not clear. The time between construction and measurement also varies between studies, for example, measurements were reported from 23-day post-construction by Ruessink et al. (2018), whereas Nguyen et al. (2021) reported measurements that were taken 1465 days after construction.
The variation in notch morphology, measurement technique and timing shown by the existing limited literature (Castelle et al., 2019; Laporte-Fauret et al., 2021; Nguyen et al., 2021; Nguyen et al., 2022a, 2022b; Pye & Blott, 2016; Riksen et al., 2016; Ruessink et al., 2018) provokes the question of how transferable these studies (and their findings) are. There are some suggestions within the literature about how results can be generalised. For example, Nguyen et al. (2022a, 2022b) stated that their findings can assist dune managers in the design of notches, specifically the best notch angle in relation to the prevailing wind direction. However, this assumes that the notches on their site are comparable to other notches in terms of their key morphological features, a question, which is currently unresolved and challenging to answer without a clear, systematic and globally representative way of describing these features.
This study aims to comprehensively map the locations of existing foredune notches, measure and analyse their constructed morphology using a consistent methodology and produce a classification system similar to those used for other aeolian landforms. It is hoped that the results presented here will provide useful context for researchers and land managers when comparing notches and attempting to understand their dynamics and evolution, as well clarifying the overall status of this dynamic intervention method.
2 METHODOLOGY AND METHODS
2.1 Identification of foredune notches
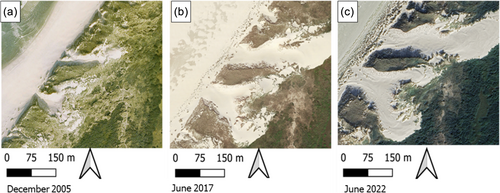
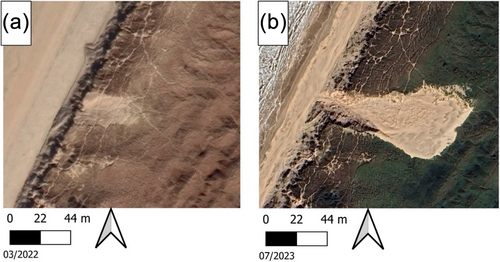
A two-step approach was used to locate foredune notches. First, a comprehensive search of peer-reviewed and grey literature was conducted to locate reported notches using standardised search terms (listed in Appendix S1). This was then expanded to include high-quality grey literature (Haddaway & Bayliss, 2015) identified through references in peer-reviewed literature and knowledge of the key organisations involved in dynamic dune restoration. This grey literature included publicity, planning and project reports. Using these sources, the location of notches and other contextual data were recorded. A full list of sources used is in Appendix S2. These notches were then geo-located, identified and confirmed using satellite and aerial imagery, following methodologies similar to those used by Vimpere (2023) and Goudie (2020). These locations were then plotted into QGIS using Google Earth (Google, 2022) imagery as a base map. Where sources provided only general locations, a visual examination of the surrounding area was conducted to pinpoint precise locations. In order to exclude natural features, historic imagery was examined to ensure that these were not inadvertently included as foredune notches (Figures 3 and 4).
2.2 Image collection and processing
To establish the constructed morphology of each notch, we compared Google Earth (Google, 2022) imagery before construction with imagery captured as soon as possible after construction. Spatial resolution of the images used ranged from 8 to 30 cm and time from construction to image capture ranged from 30 days to 13 months. Images were georeferenced using static objects such as rocks and trees (Talavera et al., 2022). In a small number of cases, colour differences between the pre-and post-construction images were evident, which were beyond those expected through seasonal variation. This was most likely due to differing atmospheric conditions/instrumentation when the imagery was collected (Pettorelli, 2019). Where this occurred, these images were normalised using the histogram matching tool in QGIS (Steinberg & Stieinberg, 2015). A root mean square error (RMSE) of under 13.5 cm was achieved for the georeferencing procedure, apart from one outlying site where an RMSE of 50 cm was achieved. All GIS operations were carried out in QGIS version 3.34.8 (Open Source Geospatial Foundation Project, 2023). See Appendix S3 for details of the spatial data used.
2.3 Notch measurements
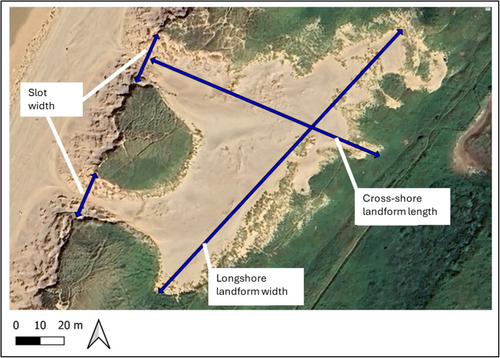
Three measurements were taken for each landform: cross-shore landform length, longshore landform width (taken at the widest/longest points (Nguyen et al., 2022b)) and the width of the ‘slot’ (Figure 5). The first two measurements follow the terminology and types of measurements used by Castelle et al. (2019) and are consistent with those used in the literature to describe blowout morphology (Schwarz et al., 2019; van Kuik et al., 2022). For consistency across sites, the measurements were taken based on the bare sand area as this provided the clearest demarcation point on the imagery as opposed to attempting to delineate the edges of the excavated depression within the foredune, which could not be achieved consistently with the available data. Therefore, the measurements included the excavated area and any deposition that may have occurred between the point of notch construction and the post-intervention image. The impact of this was minimised by using the aerial imagery that was closest to the time of notch construction.
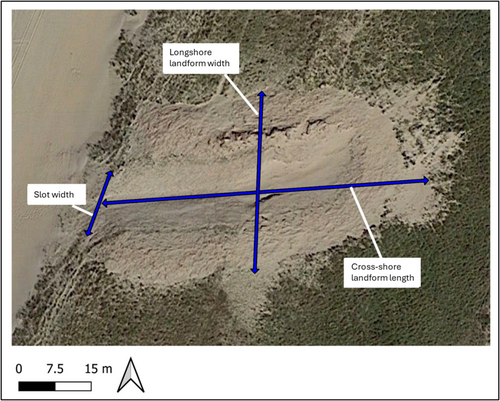
Slot measurements were taken in line with the edge of the vegetated foredune, which was digitised on the baseline image and then transferred to the post-intervention image in a manner similar to Yang et al. (2019). When a landform had more than one slot leading to a shared landform, a single measurement was taken for longshore landform length and cross-shore landform width, but the width of each slot was recorded separately (Figure 6). Data on the depth of the notches were not consistently available or measured in a comparable way across all sites. While some site-specific literature reports depth measurements, the methods, measurement points and timings vary between published studies. Therefore, depth data are not included here to maintain consistency across all notches.
3 RESULTS
The number, distribution and location of constructed foredune notches are presented, followed by the results of the analysis of the constructed morphology of these landforms.
3.1 Construction of foredune notches
The results show that 133 notches were constructed on 20 sites across the United Kingdom (England and Wales), the Netherlands, France and New Zealand between 1994 and 2023 (Figure 7). For seven notches, an exact year of construction was not identified, so the range of years was reported instead.
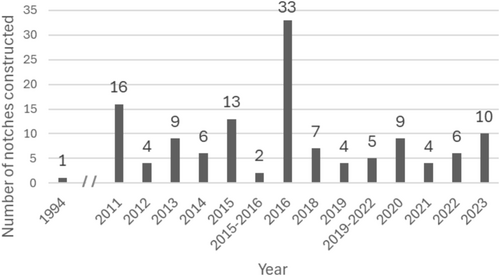
A total of at least 33 notches were constructed in 2016, more than double the amount constructed in the next highest year (2011); most of these were on one site in New Zealand and four of them in the Netherlands. Figure 7 shows that an initial notch was constructed in 1994 (Terschelling—the Netherlands) followed by a significant (17 year) gap until the next notches were constructed in 2011. Most notches have been constructed in Europe, with only one site identified outside of Europe, in St Kilda in New Zealand. Figures 8 and 9 show the locations of the notches in the Netherlands and the United Kingdom; for France (Truc Vert) and New Zealand (St Kilda), this is shown in Figures S1 and S2 in Appendix 4. For one site in the Netherlands (Figure 9), imagery was not able to be sourced, meaning that it is not included in the morphology analysis and discussion. See Table S2 in Appendix 2 for details of individual notch sites.
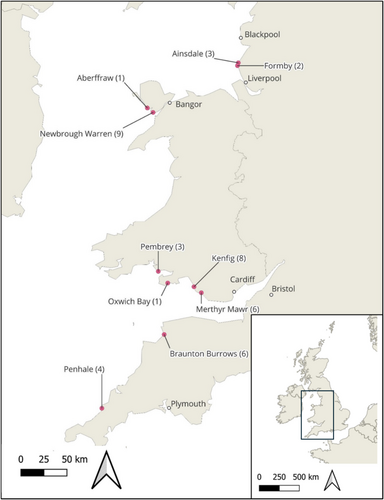
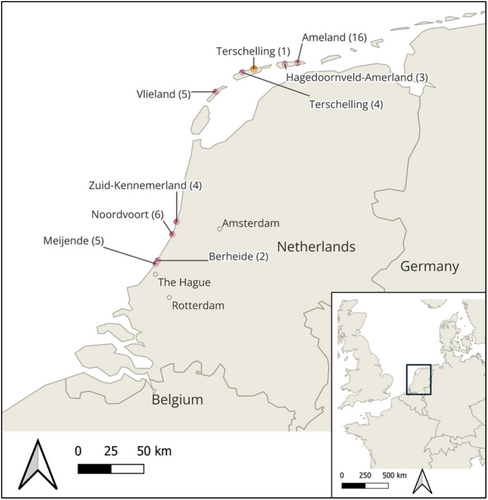
Most sites have several notches clustered in close proximity, although some have only one. St Kilda (Figure A2) and Ameland (Figure 9) are outliers, where 33 and 16 notches, respectively, have been constructed on one site, which is much higher than other sites. All UK notches and most of those in the Netherlands have been constructed in protected landscapes, such as national parks (e.g., Ruessink et al. (2018)) and national nature reserves (e.g., Hunt (2021)), whereas the New Zealand site is a public beach (Moloney et al., 2018) and the French site is a coastal research site (Castelle et al., 2019). From observations of the areas surrounding the notches, it appears that most have been constructed in areas with some light level of recreational activity.
3.2 Constructed morphology
Measurements were taken from the first available image following the construction of the notches. The interval between notch construction and the first available image varied from under 30 days to 13 months. Notches were visually assessed, and it was observed that 10 landforms had more than one slot. For these features, a measurement for each slot was taken, but only a single cross-shore landform length and longshore landform width measurement was recorded; otherwise, these landforms would have been measured twice (Figure 6). Because landforms with multiple slots only have one length and width measurement, there are more slot measurements than total measured notches.
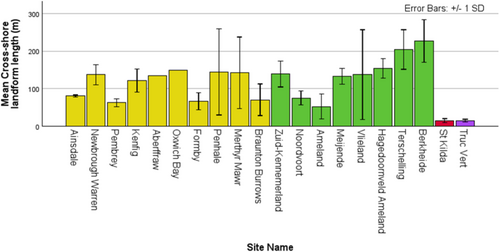
The shortest cross-shore landform length recorded was 5.7 m, while the longest was 316 m, with an average of 80.3 m. The 33 New Zealand notches are intended to increase the width of the foredune, thereby increasing resilience to erosional events that could threaten coastal infrastructure. Therefore, their purpose is different from those in Europe, which are constructed for conservation purposes (Nguyen et al., 2021). If these 33 notches are excluded, the minimum and maximum values remain the same, but the average length increases to 102.7 m. Figure 10 shows the length measurements by site and coded by country.
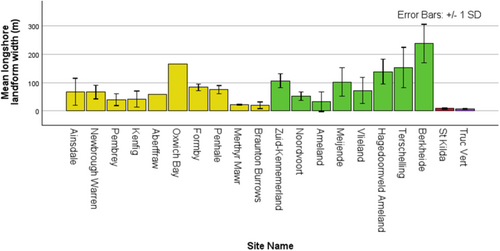
Longshore landform width also showed a significant variation across all landforms and between sites, with the variation within sites (Figure 11) being greater than that seen in the length measurements (Figure 12). The widest landform width was 286.3 m, and the narrowest was 3.8 m, with a mean of 47.6 m. If the New Zealand notches are excluded, the minimum landform width increases to 5.9 m, and the mean increases to 60.9 m (the maximum value remains the same).
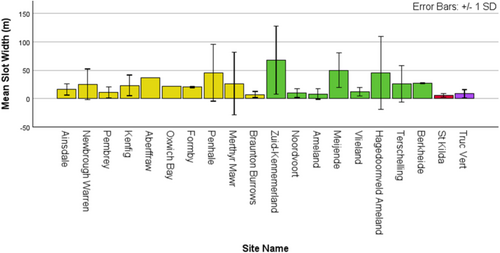
Slot widths ranged from a minimum of 3.1 to 105.1 m (Figure 12), with a mean of 18.4 m. Excluding the New Zealand notches slightly increases the minimum slot width to 3.8 m and the average value to 22.4 m. In addition to the wide range in overall measurements, there is significant within-site variation in slot width in some sites, as shown by the ranges shown on the error bars.
A comparison of cross-shore landform length and slot width (Figure 13) and longshore landform width and slot width (Figure 16) shows a weak but statistically significant linear relationship between the constructed landform length and the constructed slot width (R2 = 0.238, F [1,128] = 39.911, p < 0.001). This indicates that overall, slot width poorly predicts notch length within the model (β = 0.488, p < 0.001). Figure 13 also shows that there is a clustering of smaller notches in New Zealand and France. Notches in the United Kingdom and Netherlands have a greater range in the relationship between cross-shore landform length and slot width, with some landforms being much longer but with narrower slots than the main trend. When broken down by country, the regression model for cross-shore landform length and slot width is not statistically significant for the notches constructed in France (R2 of 0.205, p = 0.221) and New Zealand (R2 = 0.001, p = 0.836) and marginally not significant for notches constructed in the United Kingdom (R2 = 0.080, p = 0.070). The regression model is, however, statistically significant for notches constructed in the Netherlands, where R2 = 0.115 (p = 0.021), again illustrating the diversity within the dataset and highlighting potential construction and design trends by country.
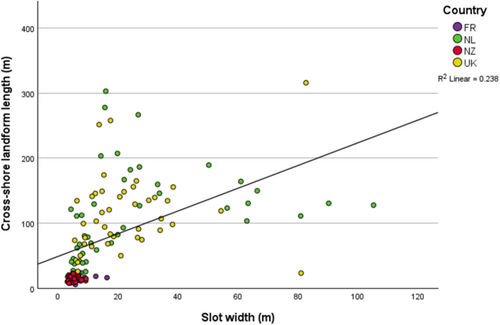
Figure 14 shows the relationship between longshore landform width and constructed slot width. This was again tested with simple linear regression. The overall regression was statistically significant (R2 = 0.245, F [1, 128] = 41.602, p < 0.001), indicating that within the model, the slot width only weakly predicts cross-shore landform width (β = 0.495, p < 0.001).
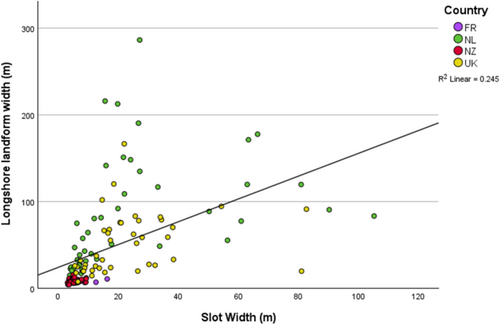
However, the R2 value indicates notable differences within the dataset and several notches do not follow the general trend. Country-level analysis shows that the model is not statistically significant for France (R2 of 0.315, p = 0.116) and New Zealand (R2 of 0.031, p = 0.323). For the Netherlands, the regression model is statistically significant (p = 0.008) with an R2 of 0.148, and for the United Kingdom, it is also statistically significant (p = 0.047) with an R2 of 0.095. These country-level results further illustrate that the headline trends conceal substantial variation by country.
4 DISCUSSION
In the following, we first discuss the trends and patterns in notch construction in different locations, followed by a discussion on the constructed morphology of the notches we have identified. We then propose a method of more accurately and consistently describing notches along with a classification system that is reflective of notches globally; we also highlight the implications of our findings. Finally, we discuss some limitations of the study.
4.1 Notch construction and location
Our analysis enabled the identification of 133 notches. The construction of the first notch in 1994 broadly aligns with the development and acceptance of the principle of dynamic intervention and restoration (Rooney, 2010). However, there is a substantial gap between the first recorded notch construction and subsequent construction in 2011, after which notches have been constructed almost every year up until 2023. The reason for this gap is unknown, but the relatively consistent construction of notches since 2011 indicates their acceptance as an intervention method in some jurisdictions. From a review of the published evidence, it seems unlikely that this increase in popularity is due to a greater evidential basis, as much of the published evidence dates from 2016 onwards (e.g., Riksen et al. (2016) Ruessink et al. (2018)). Alternatively, this may be because they have become accepted within the dune management community. This possible explanation would reflect points raised by Delgado-Fernandez et al. (2019) in their commentary on the remobilisation of dunes, where they suggest that interventions can become popular among land managers and management organisations without having a strong evidential base.
All identified notches were found in broadly similar well-vegetated dunes in temperate climates. This is consistent with the areas where the literature suggests these features will be effective, that is, well-vegetated dunes above the high tide level in temperate regions (Riksen et al., 2016). It appears that the adoption of notches is highly country specific. For example, Belgium and Germany, despite having the same geomorphological setting and processes (Mao et al. 2022), climatic conditions and pressures on dune habitats as the Netherlands (Provoost et al., 2011), have not constructed dune notches. This suggests that if, over time, notches prove to be a successful and sustainable intervention, there is scope for their use more widely in Europe.
4.2 Constructed morphology
This is the first study to consider all notches globally in a quantitative and comparable way. This showed that notches in both France and New Zealand are unusual in their size, being smaller than those elsewhere (Figures 10-12). The notches in New Zealand are also noteworthy as there are a large number of notches on a single site (33, compared with 1–9 on most European sites). The purpose of these notches differs from those in the Netherlands and the United Kingdom, which were constructed for conservation purposes (Pye et al., 2014). The French notches were experimental in design, and their size was constrained by land managers' requirements (Laporte-Fauret et al., 2021). The New Zealand notches were constructed to create a wider foredune for coastal defence and resilience and are constrained by an embankment and road in the back dune area (Nguyen et al., 2022a). This demonstrates that despite the use of the word ‘notch’ to describe these interventions, they are diverse in their purpose and morphology.
Given this variability, it is questionable whether findings based on one type of notch can be generalised to other notches at other sites. Indeed, when the New Zealand notches were excluded from the European ‘conservation focused’ notches, it slightly increased some of the minimum and average measurements recorded. However, this was not a large increase, showing that despite much of the existing research being conducted on larger notches, there are some morphological similarities across other notch sizes. Nguyen et al. (2021) suggests that their findings on topographic steering in the New Zealand notches may be relevant to notches elsewhere, which is partly supported by our findings as we have shown that the New Zealand notches are generally smaller than those in many other places; it is therefore desirable to replicate research such as Nguyen et al. (2021) for multiple notch sizes to establish whether findings can be generalised, especially to some of the larger notches that have been constructed in the United Kingdom and the Netherlands.
An interesting finding was the number of notches constructed with multiple slots. This is not widely referred to within the literature, and there does not appear to be any published work examining how these differences affect geomorphological function, leading to questions about whether and how the addition of multiple slots may affect sediment dynamics. Nguyen et al. (2021) showed that within the relatively narrow notches in New Zealand, slot angle was important in controlling aeolian processes, with wind speed through the notch being strongly correlated to incident wind direction. This work suggests that slot morphology is very important in the aeolian functioning of notches (Smyth et al., 2025). This idea is also supported by research in trough blowouts (Pease & Gares, 2013), but it appears that there has been no specific research or consideration of this in relation to there being two (or more) slots within a single notch.
Using consistent measurement points and methods, we have produced a global dataset of length, width and slot width for dune notches. These results show significant variability not only in the overall size of these constructed features but also in the relationship between slot width and landform cross-shore length and landform longshore width (Figures 15, 16). This variation in size is logical as there are a variety of site-specific constraints, such as dune height and width. Notably, the Netherlands exhibits a wide range of slot widths and notch lengths. The UK notches have a smaller spread, and the overall dimensions are smaller compared with the Netherlands. This is probably a reflection of the landscapes available within these areas, with dune areas in the Netherlands being characteristically wider than in the United Kingdom (Provoost et al., 2011). Analysis of the locations of notches within the Netherlands (Figure 10) and their sizes (Figures 12-14) shows that several notches in the Netherlands have been constructed on barrier islands in the North Sea. These islands have characteristically narrower and shorter dune systems compared with the Dutch mainland (De Jong et al., 2014) and on these sites, the constructed notches are smaller compared with those on the mainland.
The country-level differences in the regression analyses for both longshore landform length and cross-shore landform width highlight the variability in the overall size and morphological design of notches across the different countries. The relationship between the cross-shore width and longshore length for the notches constructed in the Netherlands, France and New Zealand indicates some consistency in their design at a country level. The United Kingdom, however, exhibits a wider range of variability in the relationships between longshore width/cross-shore length and slot width, suggesting less consistency in the approach to the design and construction of these features and or more site-specific constraints such as existing topography and land managers' requirements. The statistically significant regression models for the Netherlands indicate a more predictable relationship between slot width and both longshore and cross-shore dimensions. This could potentially be due to the greater amount of heterogeneity within dune landscapes in the Netherlands due to a long and recent history of significant levels of intervention and engineering (Arens et al., 2013). Our analysis suggests a notable distinction between within-country and between country trends, particularly when comparing the United Kingdom and the Netherlands. The notches in the Netherlands show a higher degree of within-country consistency, as shown by the statistically significant relationships between notch dimensions and slot width across various sites. In contrast, the United Kingdom's greater variability in notch dimensions and slot width relationships points to a less uniform approach within the country.
An interesting result is the lack of a strong relationship between the overall landform width and the slot width, with many of the features being wider at the back dune end of the excavation, tapering to a narrower width at the foredune end (slightly trapezoidal). Given that the angle of wind entry in relation to the erosional walls and deflation basin has been shown to be critical in sediment transport into and out of trough blowouts (Hugenholtz & Wolfe, 2009), this raises questions on how notches may be similar to or differ from trough blowouts in terms of aeolian functioning. Furthermore, this also illustrates a gap in the existing research on foredune notches, as much of the recent aeolian-focused research has been conducted on notches that are closer to a more even trough shape (Laporte-Fauret et al., 2021; Nguyen et al., 2021), rather than the slightly trapezoidal shaped notches that exist in substantial numbers, especially in the Netherlands.
4.3 Notch description and classifications
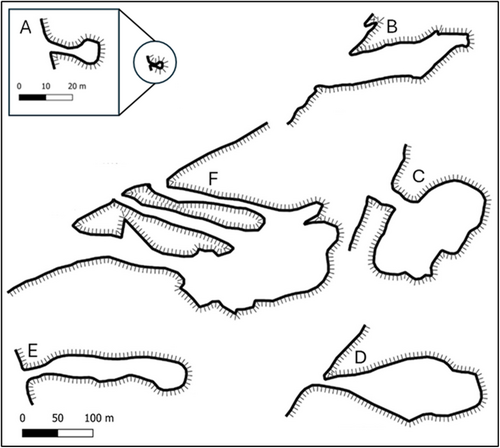
Figure 15 presents a classification system for notches based on our global inventory. Notches are classified into six types, as follows: (a) ‘minor notch’: smaller scale notch typical of those found in New Zealand and France, as well as some of the notches within the Netherlands and the United Kingdom. (b) ‘rectangular notch’: more rectangular with little difference in width between the excavation at the foredune line and the width of the walls of the excavation. (c) ‘slot and lobe’: defined slot and lobe, currently only found in the Netherlands and the United Kingdom. (d) ‘trapezoidal notch’: wider back dune end tapering to a narrower foredune end. (e) ‘Elongated notch’: narrow (longshore) but long (cross-shore). (f) ‘composite notch’: multiple slots leading to a shared lobe.
Our approach here builds on the conceptual diagram created by Pye and Blott (2016) (Figure 2). However, due to our much larger dataset, our scheme incorporates several morphologies not included in the previously published diagram, such as smaller notches (referred to as ‘minor notches’), ‘slot and lobe’ notches and ‘composite’ notches. Our conceptual scheme has only one diagram per notch ‘type’, rather than separate sections for notch plan view, cross-section and axial profile. This is similar to classification systems used for blowouts and allows a faster and simpler identification of notch types from aerial imagery, while also allowing for the lack of depth data.
Overall, the results of this study raise important questions about whether these features have been adequately described in the existing literature. Given the significant differences in constructed morphology, not only in absolute size but also in the relationships between the key characteristics, it invites questions on the transferability of research findings on one ‘type’ of notch to another ‘type’. For example, are the results of Riksen et al. (2016) on the sediment transport behind a foredune notch with an 85-m-wide slot (rectangular notch) relevant to the notches in Noordvoort that have a 5-m-wide slot (minor notch)? Evidence from blowouts and notches suggests differences in size, and morphology can significantly affect aeolian processes (Hugenholtz & Wolfe, 2006; Smyth et al., 2025).
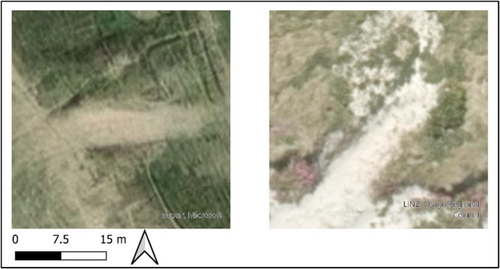
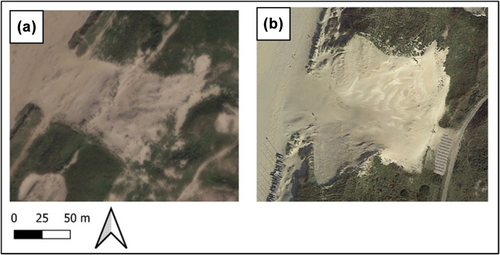
This suggests that findings from research on a certain ‘type’ of the notch may not be relevant to another ‘type’ and that greater clarity and consistency in describing these landforms may be useful in allowing a greater understanding of the applicability of existing and future research. This is an approach that has been noted to be beneficial in other similar coastal applications (Finkl, 2004; Mashimbye & Loggenberg, 2023). Blowouts (being the landform that notches are intended to emulate) are described using a range of morphological descriptors, such as ‘trough’, ‘saucer’ and ‘bowl’, reflecting the variability within the landform (Hesp, 2002). These distinctions aid the transferability of research between studies and landforms and also reflect the expected differences in aeolian processes and morphological evolution (Hesp, 2002). In the context of notches, this is demonstrated in Figures 16 and 17. These figures compare morphologically similar notches in different locations, highlighting how research might be relevant to morphologically similar notches while being of less relevance to morphologically dissimilar notches. For instance, research on 16a could apply to Figure 16b but may not be relevant to Figure 17a or Figure 17b. Conversely, findings from Figure 17a might apply to Figure 17b but not to Figure 16a or Figure 16b. These examples highlight the potential benefit of using a classification system so that research can be better understood and applied.
4.4 Research implications
By synthesising data from 133 notches, this research highlights the increasing adoption of notches as an intervention method in dune management. The findings suggest that while their implementation varies by country, the growing acceptance of notches reflects broader trends in dynamic coastal restoration.
A key contribution of this study is the establishment of a standardised classification system for dune notches that is based on all notches globally. The identification of six distinct notch types enhances the ability to compare research findings across different locations and geomorphological settings. This is particularly important given the variability in notch dimensions at construction, which may influence sediment transport and broader dune system dynamics (Nguyen et al., 2022a, 2022b; Riksen et al., 2016; Smyth et al., 2025).
This study also raises fundamental questions about the transferability of current and future notch ‘type’-specific findings (e.g., Castelle et al. (2019), Laporte-Fauret et al. (2021), Nguyen et al. (2021), Riksen et al. (2016)) from one type of notch to another. The observed morphological differences, ranging from minor notches to large multi-slot features, underscore the need for nuanced interpretations when applying research conclusions across different contexts. By developing a globally applicable dataset and classification framework, this research lays the foundation for future studies to refine best practices in notch design and implementation, ultimately supporting more effective coastal management and conservation efforts.
4.5 Limitations
This study has several limitations imposed by the data choice, availability and processing methods (Vitousek et al., 2023). The level of accuracy that was achieved in the georeferencing processes in this study is comparable to that achieved in other similar studies (Yang et al., 2019). The most significant limitation was sourcing imagery as close to construction as possible. The longer the interval between construction and the point of measurement, the more morphological evolution occurs, resulting in measurements that may no longer reflect the constructed morphology. However, for the majority of sites, imagery was acquired reasonably soon after notch construction (between 30 days and 13 months), with the imagery for only one site being acquired just over a year after construction.
There is potential for methodological bias in assessing literature to find notches, particularly due to the accessibility of non-English language publications. This is a common challenge in reviews and evidence synthesis (Morrison et al., 2012). Several pieces of literature in languages other than English were used and machine-translated, but discovering non-English publications was less efficient than discovering English ones. Despite this, it is likely that the majority of notches have been located and recorded using both peer-reviewed and grey literature.
Unlike site-specific research on notches (e.g., Laporte-Fauret et al., 2021), this study could not measure the depth of the landforms due to the lack of necessary elevation data across most sites. This limitation in the analysis is notable, as depth is likely to vary between sites and may be influenced by factors such as the existing height of the foredune, resource availability or land managers requirements (e.g., Castelle et al., 2019). Depth in blowouts and parabolic dunes has been shown to be important in their formation and development (González-Villanueva et al., 2011; Smyth et al., 2020), and it would be a useful addition to our developing knowledge of the status and trends of foredune notches.
5 CONCLUSIONS
This study presents the first systematic data on the distribution and constructed morphology of foredune notches worldwide. By identifying 133 notches in the United Kingdom, the Netherlands, France and New Zealand, this research illustrates the adoption of this dynamic dune management intervention in different locations. We have shown quantitatively that there is significant variation in constructed notch morphology, with cross-shore lengths, longshore widths and slot widths displaying a wide range of dimensions across different sites and countries. These variations underscore the potential challenges in applying research findings from one site to another, given the diversity in the purpose and physical characteristics of these constructed landforms.
The weak (though statistically significant) relationship between slot width and both longshore width and cross-shore length indicates that notch dimensions are not uniformly proportional. Country-level analysis further reveals that notches in the Netherlands and the United Kingdom exhibit greater variability in size and form compared to those in France and New Zealand, where notches tend to be smaller and more consistent in their dimensions, raising important questions about the transferability of knowledge between sites. This research has also highlighted a gap in the existing literature related to notches with multiple slots. While several notches have been constructed with more than one slot, there is a lack of research on how this affects sediment transport and aeolian dynamics. The potential importance of slot morphology in influencing aeolian processes has been suggested in previous studies on trough blowouts, and it is likely that similar dynamics are at play in foredune notches. However, further research is needed to understand how notch morphology, particularly the presence of multiple slots, influences geomorphological functioning, especially in relation to wind flow, sediment transport and medium and long-term geomorphic change.
This study provides a baseline for future research and offers a more standardised approach to describing and comparing foredune notches. However, it also underscores the need for greater clarity and consistency in how these landforms are described in the literature. The proposed classification can facilitate better comparisons between studies and improve the applicability of research findings to land management practices. By offering a clearer understanding of the current status of notch construction and highlighting areas for further research, it contributes to the ongoing advancement of dynamic dune management and wider coastal aeolian research.
AUTHOR CONTRIBUTIONS
Thomas Pagon: Conceptualization; data curation; formal analysis; investigation; methodology; writing—original draft, writing—review and editing, visualisation. Thomas Smyth: Conceptualisation; data curation; formal analysis; methodology; supervision; writing—review and editing. Ryan Wilson: Methodology; supervision; writing—review and editing; visualisation. Bethany Fox: Methodology; supervision; writing—review and editing.
Open Research
DATA AVAILABILITY STATEMENT
Additional data are available in Supporting Information.


