A karst rather than periglacial origin for small enclosed depressions of the Landes Triangle, southwest France
Abstract
Small topographic depressions offer insight into past and present groundwater recharge processes. The Landes Triangle (SW France) is dotted with over 2,400 such depressions, whose origins and hydrogeological implications remain unclear. This paper aims to disentangle their origin, with emphasis on the Villagrains-Landiras anticline sector: a key recharge zone, which also features the highest density of depressions. We first evaluate three historical hypotheses with open GIS data at the regional scale, then detail the near-surface structure of a depression near the anticline with electrical resistivity tomographies and ground-penetrating radar. We identify two groups of depressions based on their morphology, distribution and geological context. One aligns with an aeolian origin. The other (encompassing 97% of the depressions near the anticline) suggests a karst origin, with more circular shapes and proximity to karst, streams, faults and neighbouring depressions. However, 18% of these lie outside the crypto-karst area derived from GIS references and may rather be of periglacial origin. Yet, our geophysical survey revealed subsidence but no evidence of cryogenic sediment or solifluction. We conclude that a karst origin remains the best hypothesis in the anticline area, and highlight that sole reliance on GIS references may underestimate crypto-karst extent. Further geological investigation is therefore needed to map its full extent and related water pathways near the anticline.
Abbreviations
-
- BDLISA
-
- Database of aquifer system boundaries
-
- BSS
-
- Subsoil databank of the French geological survey
-
- BP
-
- Before present (i.e., before 1950)
-
- BRGM
-
- French geological survey
-
- CBNSA
-
- National botanical conservatory of South Aquitaine
-
- CD40
-
- Landes departmental council
-
- DOI
-
- Depth of investigation
-
- CEN
-
- Natural spaces conservatory
-
- ERT
-
- Electrical resistivity tomography
-
- GPR
-
- Ground-penetrating radar
-
- HI
-
- Hypsometric index
-
- IGN
-
- French national geographic institute
-
- KG
-
- Gravelius compactness coefficient
-
- MPQ
-
- Mio-Plio-Quaternary
-
- PNRLG
-
- Landes de Gascogne natural regional park
-
- RMS(E)
-
- root mean square (error)
-
- SANDRE
-
- French national service for water data and common repositories management
-
- VL
-
- Villagrains-Landiras
1 INTRODUCTION
In a context of increasingly frequent and long-lasting droughts, groundwater resources are of growing strategic importance. The analysis of landforms provides insights into flow paths and paleoclimate, both essential for inferring past and present groundwater recharge and guiding sustainable management strategies (Jasechko, 2016; Letz et al., 2021; Priestley et al., 2020).
In particular, small enclosed depressions from a few metres to a kilometre in diameter are ubiquitous features that can originate from a large variety of genetic processes, strongly determined by the lithological context and climate (Pardo-Igúzquiza & Dowd, 2021). Typically found in karst landscapes (Sauro, 2019), they are also widespread in glaciated environments, periglacial areas, or aeolian drylands (Grosse, Jones, & Arp, 2013; Hugenholtz & Wolfe, 2006; Prowse et al., 2006), spanning diverse hydrogeological settings. They may indicate complex underground systems (Ford & Williams, 2007), function as focal points for groundwater recharge - including in permafrost areas (Rains, 2011) - and contribute to paleoclimatic reconstructions (Brosius et al., 2021).
However, due to morphologic similarities, identifying the geomorphic nature of shallow or relict enclosed depressions may prove challenging in the absence of clear contextual data (Goudie & Wells, 1995; Majecka et al., 2019; Pissart, 2003). In some cases, even the natural origin of such depressions is uncertain (Etienne et al., 2011; Kołodyńska-Gawrysiak & Poesen, 2017). Misinterpretation may lead to the overlooking of possible hazards or the formulation of inaccurate assumptions about paleoclimate. For instance, the ‘viviers’ on the Hautes Fagnes Plateau (Belgium), were long considered pingo scars from the Younger Dryas, implying past continuous permafrost. However, Pissart (2003) later demonstrated that they are instead thermokarst ponds associated with discontinuous permafrost. Similarly, the ‘spungs’ of the Pine Barrens (New Jersey, USA) have been successively interpreted as relic traces of discontinuous permafrost (thermokarst basins), continuous permafrost (pingo scars) and seasonally frozen ground (deflation hollows) (French & Demitroff, 2001). Since permafrost acts as an aquitard (Walvoord & Kurylyk, 2016), such a distinction leads to contradictory reconstructions of groundwater recharge, affecting hydrogeological interpretations (Jiráková et al., 2011).
In this article, we focus on the origin of the ‘lagunes’ of the Landes Triangle, in southwest France. These shallow enclosed depressions are scattered across the Quaternary coversand of the Aquitaine sedimentary basin. Their highest density is found along the axis of the Villagrains-Landiras (VL) anticline (Legigan, 1979), a key recharge area for the regional, multilayered aquifer (Labat, 2021; Saltel, 2008), making them highly relevant to regional hydrogeology. To date, a total of 2,432 depressions have been inventoried (Figure 1), based on two morphological criteria: their shallow depth (approximately 2 m or less) and their circular or elliptical shape in aerial view. Many of them are filled with freshwater for at least part of the year and form ecologically valuable ponds. However, they exhibit notable diversity in sedimentary context, morphology and hydrological functioning.
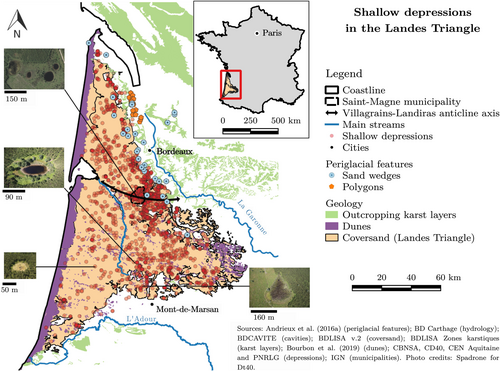
Since the 1950s, three possible origins for these depressions have been proposed. Initially, they were interpreted as periglacial features resulting from permafrost thawing at the end of the Last Glacial period (Legigan, 1979). Later, researchers suggested they were the surface expression of karst processes affecting the underlying calcareous formations (Becheler, 2014; Texier, 2011). Others have attributed their formation to eolian deflation (Corbier, 2015; Enjalbert, 1960; Sitzia, 2014).
A periglacial origin would imply ground subsidence following either the melting of buried ice or the thawing of ice-rich permafrost. Indeed, in continuous permafrost, the melting of ice-cored hills known as pingos results in ramparted, enclosed depressions measuring 100 to 500 m across and a few metres deep (Ballantyne, 2018; Harris, Brouchkov, & Guodong, 2017). These features are generally scattered across the landscape, with densities of less than one per square kilometre (Pissart, 2002). Thermokarst lakes can also form through the melting of ice-wedge networks or through the broad, inhomogeneous subsidence of ice-rich ground (Grosse, Jones, & Arp, 2013). In discontinuous permafrost, the thawing of ice-rich permafrost mounds, sometimes referred to as lithalsas, produces similar ramparted depressions, known as thermokarst ponds. These range from 2 to 150 m in diameter and are a few metres deep (Arlen-Pouliot & Bhiry, 2005; Seppälä, 2011). Unlike pingo scars, thermokarst ponds often occur in clusters ranging from a few to dozens of depressions.
The covered karst hypothesis would involve the dissolution or collapse of underlying carbonate rocks or evaporites (Gökkaya et al., 2021; Keskin & Yılmaz, 2016; Sauro, 2019). In such a context, small enclosed depressions can correspond to buried sinkholes, suffusion sinkhole or dropout sinkholes (Kranjc, 2013; Waltham & Fookes, 2003). These landforms commonly have circular to subcircular plan geometry, with a diameter from one to hundreds of metres and a bowl- or funnel-shaped concave profile.
Lastly, aeolian depressions result from the deflation of lake sediments, sand ridge dunefields or fluvial drainage lines (Goudie & Wells, 1995). In particular, blowouts are saucer-, cup- or trough-shaped depressions formed by wind erosion on a preexisting sand deposit (Hesp, 2002).
Previous studies on the ‘lagunes’ depressions were conducted by Legigan & Marambat (1993), Texier (2011) and Faure & Galop (2011). These researchers performed palynologic analysis and 14C dating on shallow peat layers from the infilling of five depressions: three located away from the VL anticline and two in its vicinity. The results revealed a contrast between the two groups, with peat deposits in the former dating to approximately 6,000 to 8,000 years before present (BP), while those in the latter were only 2,000 to 3,000 years BP. Using cross-sectional stratigraphic observation of four depressions (both close and far from the anticline), Texier (2011) further identified significant sedimentary deformations at their centres and margins. These included mass flows, shears, ball-and-pillows and centimetric collapses framed by short vertical strike-slip steps. They concluded that such deformations could be attributed to both karst and periglacial processes. However, Sitzia (2014) and Corbier (2015) later observed that the location and elongated shape of depressions in the southern half of the Landes Triangle are often influenced by dunes, suggesting an aeolian origin. This raises the possibility that, despite being grouped under a common term, the ‘lagunes’ may actually encompass distinct geomorphic features.
In the study presented here, we combine GIS analysis with near-surface geophysical investigations to specifically disentangle the possible karstic, aeolian and periglacial origins of these depressions and assess their role in vertical water flows near the Villagrains-Landiras anticline. After a short description of the study site, we compile geospatial information to examine the morphology of all depressions and their spatial distribution as a function of topography, lithology of the surficial deposit, proximity to aeolian and karst features and proximity to faults and folds. We partition the depressions into clusters that share similar properties regarding these variables. Then, we analyse the vertical distribution of the karst and impervious layers, and classify each depression with respect to its susceptibility to crypto-karst processes (i.e., the development of karst beneath the superficial layer of permeable sediment). Special attention is paid to the 368 depressions located in the municipality of Saint-Magne, which lies just above the axis of the VL anticline and hosts the highest density of depressions. In light of these results, we eventually select one depression in a non-karst context near the VL anticline, and perform a sedimentological and geophysical investigation to get insights into its morphogenesis. This includes seven 2D electrical resistivity tomographies (ERT) and ground-penetrating radar (GPR) profiling. The findings provide new insights into the origin of the depressions in the Landes Triangle and especially near the VL anticline. Discussion of the results is followed by a comparison of our findings with previous studies, and by a reflection on the limitations of the available geospatial data and possible perspectives to overcome them.
2 REGIONAL SETTING
The Landes Triangle is defined as the spatial extent of the Quaternary coversand in the Aquitaine basin. This aeolian deposit occupies a triangular surface of about 13,000 km2, delimited by the Atlantic Ocean to the west, the Adour River to the south and the Garonne River to the north. Its thickness is greatest near the Atlantic coastline (50 to 60 m) and decreases down to a few metres towards the east. The main karst, aeolian and periglacial features found in the Landes Triangle are synthesized in Figure 1. No map of the karst rockhead exists for the region; however, Figure 2 synthesizes the stratigraphic position of the karst based on the “Karst zones” subset of the BDLISA (v2) - the reference database for aquifer system boundaries. Depth measurements to the corresponding karst layer are provided locally, according to the subsoil databank (BSS) of the French geological survey.
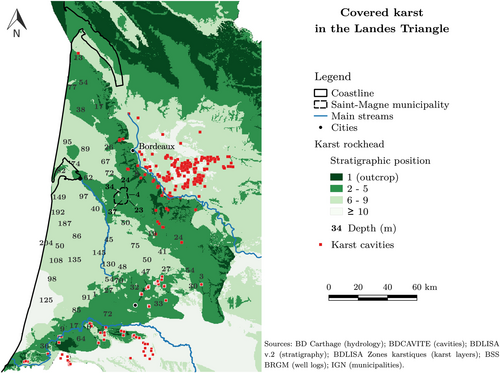
In terms of general geology, the deep substratum is composed of thick sedimentary layers accumulated over successive cycles of marine transgression and regression from the Triassic to the Miocene (Platel & Dubreuilh, 1986). The carbonate layers deposited during the marine phases were subsequently eroded and covered by clay-marl or even sand deposits during the regression phases, progressively building up a multi-layered aquifer. The geological structure exhibits pronounced asymmetry on either side of a NW-SE flexure that divides the Landes Triangle into two halves. To the north, sedimentary layers from the Mesozoic to the Neogene are between 500 and 2000 m thick (Platel & Dubreuilh, 1986) and are predominantly horizontally stratified, with occasional folds (Bourbon, 2019). In contrast, to the south, the sedimentary complex is significantly thicker, ranging from 4,000 to 6,000 m, and has been extensively folded as a result of Pyrenean orogenesis.
After the late Miocene, the basin evolved toward a continental context, with fluvial and aeolian sedimentation within a large delta (the future Landes Triangle), where sandy-gravelly and clayey layers were successively deposited. The Plio-Quaternary complex is structured into five sequences, each at least 10 m in thickness. However, their spatial distribution is patchy due to either erosion or a lack of deposition. As a consequence, few areas exhibit the entire lithological column. Schematically, each sequence starts with coarse sand or gravel in a clayey matrix at its base, then gradually evolves to clayey sands and terminates with clay. The sequence ends with the aeolian sedimentation, which started from 400 ka BP. The parabolic and barchanoid dunes that currently overlain the coversand were formed after 13 ka BP (Bertran et al., 2020).
Together with this overlying coversand, the Mio-Plio-Quaternary (MPQ) complex constitutes the shallow aquifer, which reaches up to 100 m in thickness.
The overall stratigraphy is affected by a network of faults and folds oriented N110–120°E (Bourbon, 2019). These features were formed during two key tectonic events: extensional tectonics during the opening of the Bay of Biscay, and compressional tectonics during the Pyrenean orogeny (Platel & Dubreuilh, 1986).
Numerous caves and sinkholes are found where carbonate layers outcrop outside the Landes Triangle, at topographic heights (Figure 2). Inside the Landes Triangle, these karst units are found at depth, except along anticline folds, where they nearly outcrop (Cabaret et al., 2020; Labat et al., 2021; Perrin, Noury, & Cartannaz, 2014). Some natural caves and suffusion sinkholes have therefore been identified in the eastern part of the Landes Triangle (Figure 2), where they are accompanied by sinking streams and springs. While most of them are a geological heritage, two new collapses appeared in 2011 and 2012 in the south-east.
According to global paleoclimatic models (Lindgren et al., 2016), the Landes Triangle lies outside the permafrost extent of the Last Glacial Maximum (26.5–19 ka BP). On the other hand, local proxies reported in Figure 1 (Andrieux et al., 2016; Andrieux, Bertran, & Saito, 2016) suggest that discontinuous permafrost may have extended down to this area during the Last Permafrost Maximum (25–17 ka BP), under favourable conditions (Bertran et al., 2014; Vandenberghe et al., 2014). However, the most recent publications reinterpret these proxies as the expression of an older permafrost episode or a deep seasonal freezing (Bertran et al., 2017). According to dune orientations and to grain-size gradients, dominant winds blew from the west and northwest during the Late Pleniglacial, then from the west and southwest during the Younger Dryas (Sitzia et al., 2017).
Today, the region is characterized by a temperate oceanic climate. The mean annual temperature is 14.2°C (over the period 1991–2020), and precipitation is relatively consistent throughout the year, averaging 925 mm annually. The wind regime changes seasonally, shifting from southeasterly winds in winter to westerly and northwesterly winds in summer (Sitzia et al., 2017). The mean wind speed decreases eastward and southward, ranging from 5 m.s−1 at the northwestern vertex of the Landes Triangle to 2 m.s−1 at the eastern vertex.
3 MATERIALS AND METHODS
3.1 Selection of descriptive variables
The 2,432 depressions were mapped by cross-checking four independent inventories carried out between 2005 and 2014, and updated on a case-by-case basis up to 2018. In case of inconsistency regarding the delineation of the depressions between two inventories, the most recent mapping was retained.
For each depression, seven variables were measured. The first five are lateral distances, respectively from the depression to the nearest: (1) karst feature, (2) dune, (3) natural stream, (4) fault or fold and (5) neighbouring depression. Indeed, karst features and dunes are surface expressions of past karst and aeolian processes, respectively. Therefore, the proximity of a depression to either feature provides insights into the geomorphological context in which it formed. The closer a depression is to a karst or aeolian feature, the more likely its formation was influenced by the corresponding process. The proximity to streams and faults is known to favour karst processes (Keskin & Yılmaz, 2016; Perrin et al., 2015). Lastly, measuring the lateral distance to the nearest depression helps determine whether a given depression is part of a cluster or isolated.
These variables are complemented by two geomorphological criteria: (1) the position of the depression on the hypsometric curve of its watershed (referred to as the “hypsometric index” or HI in this study), and (2) the Gravelius compactness coefficient (KG) of the depression.
HI represents the percentage of the watershed's surface that lies at a lower elevation than the depression. It reflects the hydrological context of the depressions – a parameter that influences karstic, aeolian and karstic processes alike. The lower the index, the wetter the surface conditions.
The geospatial data needed to compute these variables were obtained from governmental sources listed in Table 1.
| Geospatial data | Database (producer, date) | Data source |
|---|---|---|
| Karst features | BDLISA v.2 (BRGM, 2018) | http://sandre.eaufrance.fr |
| BDCavités (BRGM, 2021) | https://www.georisques.gouv.fr | |
| Dunes | 1/25,000th numerical geological map of Aquitaine (Bourbon, 2019) | https://sigesaqi.brgm.fr |
| Streams and watershed | BD Carthage v.3.0 (SANDRE, 2019) | http://services.sandre.eaufrance.fr |
| Faults and folds | 1/25,000th numerical geological map of Aquitaine (BRGM, 2019) | https://sigesaqi.brgm.fr |
| DEM | RGE ALTI v.2.0 (IGN, 2018) | https://portail.pigma.org |
The covariance table (Table 2) of these seven parameters was checked to evaluate the redundancy of information. The maximum correlation strength between two variables is −0.51, which remains quite low. This occurs between the distances to the nearest karst feature and dune, reflecting the geographical distribution of calcareous units around the border of the sandy unit (Figure 1). The other variables show no significant correlation with each other (all correlation coefficients are < 0.25 in absolute value). This means that each variable brings new and relevant information about the diversity of depressions.
| Karst | Dune | Stream | FoF | Depres. | KG | HI | |
|---|---|---|---|---|---|---|---|
| Karst | 1 | −0.51 | 0.25 | 0.04 | 0.34 | 0.13 | 0.10 |
| Dune | 1 | 0.03 | −0.03 | −0.24 | −0.19 | 0.14 | |
| Stream | 1 | 0.21 | 0.17 | −0.01 | 0.19 | ||
| FoF | 1 | 0.09 | −0.01 | 0.08 | |||
| Depres. | 1 | 0.05 | −0.00 | ||||
| KG | 1 | −0.05 | |||||
| HI | 1 |
3.2 Clustering strategy with K-means
The clustering strategy was then based on the non-supervised K-means method (James et al., 2021; Mariani, Tweneboah, & Beccar-Varela, 2021). The depressions were first randomly assigned to a pre-specified number (K) of clusters. The centroids of these clusters were then computed based on the seven variables. Each depression was reassigned to the cluster with the nearest centroid, and this process was repeated iteratively until the clustering stabilized. It is important to note that the K-means approach has four limitations: (1) the algorithm always converges, regardless of the existence of a clear structure in the dataset, (2) the resulting clusters are sensitive to the presence of outliers, (3) the resulting clusters depend strongly on the first random step and (4) even when relevant, it says nothing about the underlying rationale for the clustering (James et al., 2021). To overcome these limitations, we implemented three additional processing steps.
First, to test the existence of a real K-structure, we cross-checked the results of 1,000 independent K-means clusterings and assigned a depression to a given subset (cluster) only if it was assigned to it more than 90% of the times. Below 90% affiliation, the depression's assignment was considered unknown. This first step has been tested on dummy datasets to evaluate its performance. Attempts to cluster a random dataset into K = 2 or K = 3 subsets resulted in more than 90% of the points being categorized as “unknown”. This strategy is thus robust and seems unable to cluster the data in absence of real structuration within the dataset. On the contrary, tests on dummy structured datasets also revealed that it may fail to detect the underlying clustering when the distinction among subsets is weak. In such cases, it results in a high proportion of unassigned data. This clustering strategy is consequently restricted to the detection of strong heterogeneities within the dataset.
Then, we filtered out the depressions with “unknown” assignment, ran again 1,000 independent K-means clusterings and selected the one with the best clustering score (i.e. with the lowest total within-cluster distances). This second step is necessary to eliminate the distortion effect produced by the filtered-out data (outliers) on the clusters' shapes. The purpose of running a large number of independent clusterings is to reduce the effect of the K-means random initialization on the result.
Eventually, appropriate statistical tests were performed to compare the clusters in pairs and get insights into the rationale for the clustering. For each of the seven variables, we tested the null hypothesis (H0): “there is no significant difference between the clusters regarding the variable i” versus the alternative one (H1): “there is a significant difference”. The H0 hypothesis was rejected only when the p-value of the statistical test was lower than 0.001. The choice of the appropriate statistical test was based on the distribution of the variable of interest and the difference in its variance between clusters. These were respectively evaluated using a Shapiro–Wilk normality test and a Fischer-Snedecor test, with a significance level of 5%.
3.3 Susceptibility assessment to karst processes through stratigraphic analysis
The susceptibility of each depression to karst processes was assessed following the methodological framework developed by Perrin, Noury, & Cartannaz (2014); Perrin et al. (2015), on the basis of a literature review (Doctor & Doctor, 2012; Farrant & Cooper, 2008; Galve et al., 2009; Lamelas et al., 2008; Orndorff, Weary, & Lagueux, 2000). This methodology postulates that undercover karstification is more efficient when water easily percolates down to the karst layers (promoting dissolution), and when dissolution products are efficiently evacuated. Specifically, five criteria are evaluated: (1) permeability of the sedimentary cover; (2) thickness of the sedimentary cover; (3) strength of water table fluctuation; (4) proximity to loosing streams; (5) proximity to geological discontinuities. The first two criteria assess water percolation efficiency, while criteria (3) to (5) evaluate the removal of dissolution products.
To simplify the approach, we built a decision tree solely on the first two criteria (Figure 3), while the last three (less decisive) were taken into account during the interpretation phase. The assessment was made on all the Landes Triangle depressions, but in a more detailed manner near the VL anticline (in Saint-Magne municipality), where a map of the thickness of the MPQ complex was provided by the French geological survey (Corbier and Karnay, 2010).
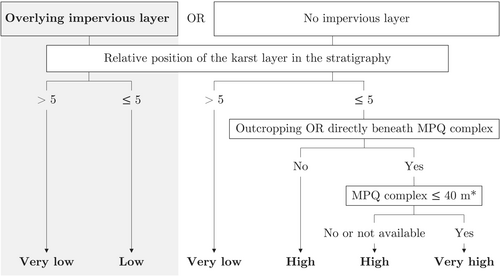
In both cases, impervious and potential karst layers (listed in Supporting information, Table S1) were identified according to the corresponding lists provided by the national aquifer reference system (BDLISA, version 2). An additional unit of shelly sand, sandstone and limestone (labelled “CodeEH: 320AA01” in BDLISA) was considered a karst layer, as it shows a high susceptibility to karst near the Roquefort anticline (Perrin, Noury, & Cartannaz, 2014), and evidence of intense ghost-rock karstification along the VL anticline (Labat et al., 2021).
In France, Perrin, Noury, & Cartannaz (2014) have shown that covered karst generally occurs where karst layers are overlain by less than 40 m of permeable sediments. This conclusion is based on the examination of approximately 600 covered karst features across the territory. Since the BDLISA lacks information on layer thickness, we compiled 194 verified stratigraphic logs from the BSS database (French geological survey) across the Landes Triangle to estimate how the stratigraphic position of karst provided by the BDLISA relates to the actual depth of the karst layers. On average, the 40 m threshold is reached when the karst layer occupies the 5th position in the stratigraphy, with a mean depth of 48 ± 10 m (95% confidence interval). However, depth variations at this stratigraphic position are substantial, ranging from 9 to 150 m. Notably, the depth is significantly lower when the karst layer lies directly beneath the MPQ complex, averaging 30.5 m compared to 74.5 m in other cases. These observations were therefore included in the decision tree (Figure 3).
3.4 Sedimentological and geophysical investigation of a depression in non-karst context
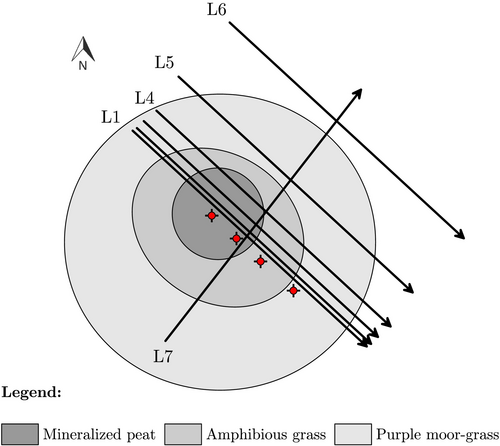
Shallow sediment sampling, ground-penetrating radar (GPR) profiling and electrical resistivity tomography (ERT) were carried out along 7 survey lines (L1 to L7) each 31.5 m in length, arranged as shown in Figure 4. The objective was to examine the near-surface sedimentary structure of the depression. Lines L1 and L7 crossed the depression's centre at two different angles, to reveal potential symmetries within its 3D structure. This information was essential for interpreting 2D ERT cross-sections. Lines L2 to L6, running parallel to L1, were designed to focus on the 3D structure of one half of the depression. To balance acquisition time with accuracy, the spacing between these lines increased progressively from the centre of the depression – where greater precision was required – towards its edges. Lastly, line L6 lay outside the depression (delimited by the amphibious grass vegetation belt shown in Figure 4) to serve as a reference for the general stratigraphy in areas without depressions. Absolute elevation of the ground surface was measured with a differential GNSS antenna every 50 cm along each line, with a maximum cumulative uncertainty of 3 cm in all three spatial dimensions. The antenna was connected to a mobile GNSS base installed a few metres away from the depression (44°32′46.37268” N, 0°41′31.86930” W, σ = 0.0066 m). The real-time kinematic data were then post-processed using a combination of three reference GNSS bases, located in La Brède, Bordeaux and Lacanau.
3.4.1 Sampling and analysis of shallow sediments
3.4.2 Ground-penetrating radar
GPR profiling was achieved with a pulseEKKO PRO GPR (Sensors & Software) in October 2019, at two nominal frequencies: 100 and 250 MHz. The transmitter and receiver antennas were maintained a fixed distance apart and oriented perpendicularly to the survey lines. Only the 250 MHz antennas were shielded. Distinct survey parameters were used for each frequency. At 100 MHz, the antenna spacing was 1 m, and data were collected at a 0.25 m step size, with a 200 ns time window and 64 repeated measurements (stacks). Based on the average radar velocity in common soil materials (0.1 m.ns−1), these settings allow for an estimated penetration depth of 10 m. At 250 MHz, the antennas were mounted on a SmartCart (Sensors & Software), with a spacing of 0.38 m. Data were collected at a 0.05 m step size with a 100 ns time-window, enabling a penetration depth of approximately 5 m under the same velocity assumption. The number of stacks at this frequency was automatically adjusted by the GPR system as a function of the travel speed.
Data were processed with the software Reflexw (Sandmeier geophysical research), starting with time-zero correction, followed by signal amplification with manual gain (applied exclusively to the data collected at 250 MHz), and concluding with topographic correction. Radar wave velocity was estimated by diffraction adjustment fitting in sandy areas, and by collecting GPR data immediately above a buried metallic electrode (at 60 cm depth) in the peaty, central part of the depression.
3.4.3 Electrical resistivity tomographies
ERTs were carried out individually along each line in September 2019, in Wenner array, by means of sixty-four metal electrodes grounded at regular 50 cm intervals. The aim was to delineate the geometry of sedimentary deposits in the depression and its surrounding area, with a focus on identifying potential traces of solifluction or cryogenic sediments at depth. These targets typically produce lateral variations in the subsurface stratigraphy, which in turn affect electrical resistivity. The Wenner array, characterized by good vertical sensitivity, is well suited for detecting such variation (Binley, 2015). Moreover, the proximity of the injection and potential electrodes ensures a strong signal.
We used a DAS-1 impedance metre (Multi-Phase Technologies, LLC) with 1 Hz alternating current. The Wenner sequence involved 144 quadrupoles with a minimum electrode spacing of 1 m. Two reciprocal measurements were systematically performed on each quadrupole by swapping the injection electrodes. We also ensured that the contact resistance of the electrodes was lower than 3,000 Ω, and that a minimum of 2.5 mA was received at the electrodes. Data with more than 1% standard error between reciprocal measurements were filtered out, as were those with effective electrode currents below 5 mA.
ERT inversions were performed with the software RES2DINV (Loke & Barker, 1995, 1996) with robust data constrain and robust model constrain, as well as topographic correction. This software solves the inverse problem (Binley, 2015; Binley & Kemna, 2005) by means of an optimization function based on the incomplete Gauss-Newton least-squares equation. The subsurface was discretized in finite elements with a width of 50 cm and a length that increases with depth, varying from 0.25 m to 4.9 m. The convergence criterion was a decrease of less than 5% in root mean square error (RMSE) between two consecutive iterations.
A high DOI index indicates that the computed value is strongly influenced by the initial model rather than being reliably determined by the data. To prevent misinterpretation, model regions with DOI index above 0.1 were blanked.
3.4.4 ERT interpretation strategy
We assumed that salinity in the porous medium remained constant at the scale of the survey lines. Therefore, any resistivity changes (ρ, in ohm.m) were attributed to variations in water content, lithology, or both. Specifically, a decrease in water content is known to increase resistivity, as does an increase in grain size (and vice versa).
4 RESULTS
4.1 Clustering
The results of the clustering strategy (based on cross-checking 1,000 independent K-means runs) on the depressions dataset is shown in Table 3 for cases K = 3 and K = 2. For K = 3, 76% of the depressions were not successfully assigned to a cluster, while the remaining 24% were all assigned to the same one. The attempt to group the depressions into three strongly different homogeneous subsets was thus unsuccessful. In contrast, with K = 2, the clustering consistently assigned 96% of the depressions to a specific subset. The first subset (SE1) included 1,403 depressions, while the second (SE2) included 939. The 2-subsets clustering was therefore validated.
| (a) Clustering with K = 3 | (b) Clustering with K = 2 | ||||
|---|---|---|---|---|---|
| Cluster | Count | Prop. | Cluster | Count | Prop. |
| SE1 | 572 | 24% | SE1 | 1,403 | 58% |
| SE2 | 0 | 0% | SE2 | 939 | 39% |
| SE3 | 2 | 0% | Unkn. | 90 | 4% |
| Unkn. | 1858 | 76% | |||
After filtering out the 90 unassigned depressions, 1,366 depressions belonged to SE1 and 976 to SE2. Their spatial distribution is shown in Figure 5, and their statistical comparison is presented below.
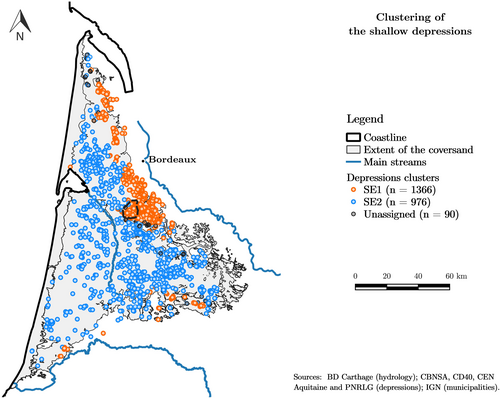
Finally, according to the Shapiro–Wilk test, none of the seven variables followed a normal distribution. Therefore, the appropriate statistical test for comparisons was the Wilcoxon test. This analysis revealed significant contrasts between the SE1 and SE2 subsets for each variable. In particular, depressions in SE1 are significantly closer to karst features, natural streams, faults or folds and other depressions, while they are farther from dunes. They are also situated at lower elevations within their watersheds and exhibit a more circular shape compared to those in SE2.
4.2 Susceptibility to karst processes
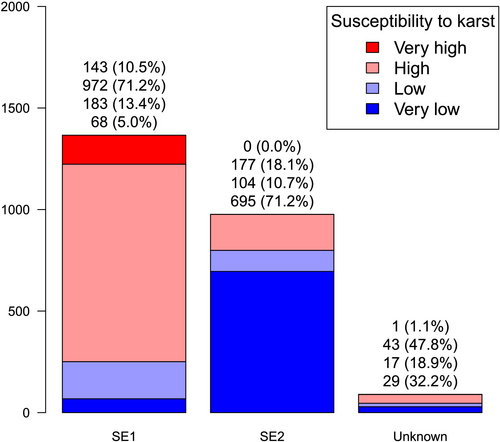
There is a strong dissymmetry between the SE1 and SE2 subsets regarding susceptibility to karst processes. Although 55% of the Landes Triangle depressions were found to lie in a context favourable to karstification, this proportion rises to 82% in SE1 subset and drops to only 18% in the SE2 one (Figure 6).
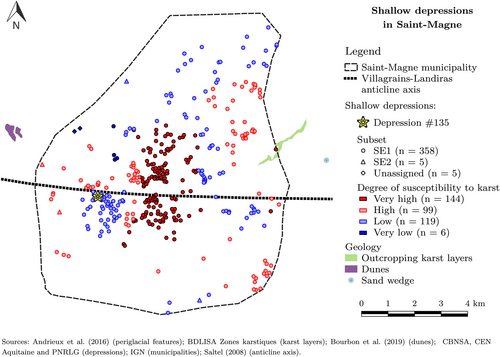
In Saint-Magne, most of the depressions were found to belong to SE1 subset (358), compared with just 5 in SE2 and 5 unassigned. According to stratigraphic data (layers permeability, thickness and susceptibility to karst), 66% of them lied in a context suitable for crypto-karst processes with a “high” to “very high” degree of karst susceptibility (Figure 7). However, the remaining 34% were located in a context that was not favourable to crypto-karst, due to the absence of a potential karst layer within the five first geological layers (6 depressions), or to the presence of an impervious layer between the MPQ complex and the deep potential karst layer (119).
4.3 Investigation of depression #135
Depression #135 (Figure 7) is a circular depression 19.6 m in diameter and 1.85 m deep. It was selected for further geophysical investigation because it was found to lie in a non-karst context along the VL anticline, while belonging to the SE1 subset. In addition, geological soundings and piezometric monitoring of the shallow MPQ aquifer were available within 300 to 500 m, providing valuable benchmarks for the hydrogeological context. Finally, the surrounding area was free of electromagnetic noise or metallic structures that could alter the measured signal.
4.3.1 Shallow sedimentary structure
The lithological information issued from the analysis of shallow samples collected near the line L1 is synthetized in Figure 8.
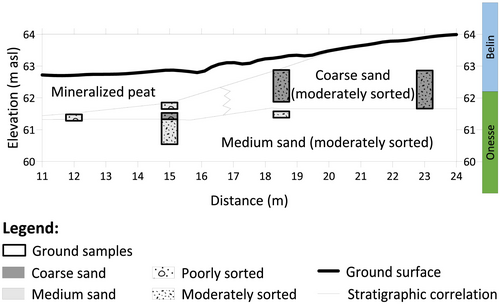
In its centre, the depression was partially filled with highly mineralized peat, whereas the host sediment in its vicinity was a medium (250–500 μm) to coarse sand (500 μm - 1 mm). The sand grains were moderately sorted (So in 1.35–1.87), except just beneath the peat, where they were poorly sorted (So in 1.87–2.75).
4.3.2 Ground-penetrating radar
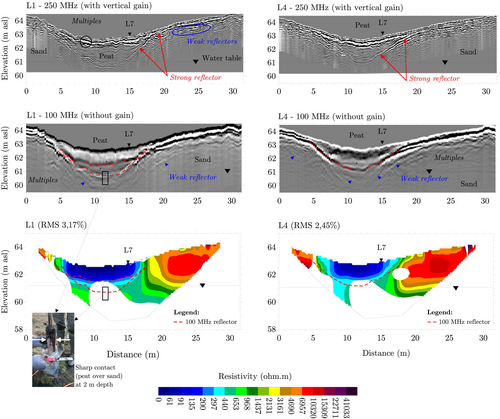
All radargrams are provided in Supporting information (Figure S1, and a selection is shown in Figure 9 (top and middle). Radar speed evaluation was 0.06 m.ns−1 within the peat and 0.11 m.ns−1 within the sand. In Figure 9 and S1, the speed 0.06 m.ns−1 was taken as a reference to convert the vertical axis of the radargrams from two-ways travel time to depth. The depth of investigation dropped from 3 m at 100 MHz, to 2 m at 250 MHz. Regardless of frequency, the position and shape of the reflectors on the radargrams from lines L1 to L4 and L7 were very similar.
4.3.3 Tomographies of electrical resistivity
All inverse models of electrical resistivity are provided in Supporting information (Figure S1), and a selection is shown in Figure 9 (bottom). Data filtering removed three points from line L1, one from L4, eleven from L5, six from L6 and none from the other lines. On every model, the RMSE was lower than 4.6%, and the DOI was about 3 m. The interpretation is given together with that of the GPR results in the following paragraph.
4.3.4 Interpretation of the GPR and ERT images
The strongest GPR reflector on the 100 MHz radargrams of line L1 to L4 (and L7) highlights a gently curved contact between the depression's infill and the substrate. This contact fits precisely with both the base of the conductive unit (ρ < 600 Ω.m) on the electrical resistivity models and the boundary between the peat and sand layers observed during sediment sampling (see the dashed line on Figure 9). Therefore, GPR and ERT methods efficiently allow to map the 3D structure of the peat layer.
On the 100 MHz radargram of survey line L1, a strong reflector divides the peat unit into two layers. The upper layer exhibits very low resistivity (ρ < 200 Ω.m), while the lower one is slightly more resistive (200 < ρ < 600 Ω.m). This contrast marks the transition from saturated to dry peat at depth, caused by the downward propagation of a wetting front following a rain event. At 250 MHz, the bottom part of the peat is clearly visible and depicts a homogeneous unit, as shown by the absence of weak reflectors.
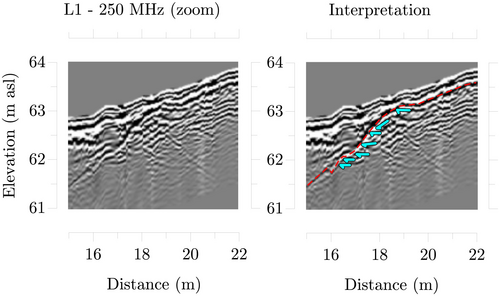
On the other hand, the substrate is highly resistive (ρ > 5,000 Ω.m) near the surface and shows many weak reflectors on the 250 MHz radargrams. These correspond to boundary reflections in the layered sand. The sharp decrease in electrical resistivity with depth (down to 500–1,000 Ω.m) matches the position of the water table measured in the well PQ-08515X0053 (250 m away) at the time of the ERT survey. It represents the transition to the saturated zone. More interestingly, while the substrate weak reflectors are subparallel and horizontal away from the depression (as visible at 250 MHz on lines L5 and L6), they tend to converge below the pond, before being truncated by the strong reflector. Figure 10 illustrates this phenomenon along L1. This reveals that ground subsidence occurred below the pond, either before or during the peat deposition. Most of the weak reflectors depicted in the sand unit at 100 MHz, just below the strongest reflector, are ‘multiples’ caused by repeated reflections of the GPR signal on shallower reflectors. However, some of them correspond to deep reflection boundaries and indicate that this subsidence has spread a little deeper (Supporting information, Figure S2). In addition, the step-like shape of the strongest reflector on either side of the peat infill suggests that successive small collapses occurred during the peat deposition.
5 DISCUSSION
5.1 Updated hypothesis on the origin of the depressions
Despite three morphogenetic processes that could explain their onset, only two types of depressions have been observed. Those in the SE2 group have irregular shape and proximity to dunes, which are consistent with the aeolian origin by deflation proposed by Sitzia (2014). Blowout hollows indeed develop by wind erosion in dunes (Hesp, 2002) and are typically described as semi-circular or elongated shallow depressions, respectively called “saucer-shaped blowouts” or “trough blowouts” (Cooper, 1958, 1967). In the Landes Triangle, they may result from the erosion of low amplitude dunes (0.3–0.7 m high) of Pleniglacial age (62–42 ka BP) in the northern half, or of more recent parabolic dunes (12.9–11.7 ka BP) in the southern half (Sitzia et al., 2017). Interestingly, SE2 depressions are evenly distributed between these north and south halves (49% vs 51%, respectively).
Yet, surface morphology alone is not sufficient to confirm blowout origin, as blowout hollows can display a high variability of shape and surface, ranging from pits to broad basins (Smith, 1960). The only characteristic criterion is the presence of a deposition lobe and erosional walls, resulting from deflation (Hesp, 2002). González-Villanueva et al. (2011) and Neal & Roberts (2001) have shown that proper identification of these features can be achieved by GPR. Similarly, sedimentary structures typical of deflation could be investigated in SE2 depressions with GPR at 100 MHz and 250 MHz, which have proven effective for delineating sand beddings near the depression #135.
Depressions in the SE1 group, on the other hand, exhibit characteristics consistent with karst origin, such as circular morphology, distribution in clusters and proximity to karst features, natural streams and faults or folds. Notably, 82% of them lie over shallow potential karst layers buried under permeable sediments- a context favourable for crypto-karst. According to Waltham & Fookes' (2003) classification of closed depressions in carbonate karst, they could correspond to buried dolines or suffosion dolines.
However, their circular morphology, distribution in clusters and location in permeable sediments could also be consistent with a periglacial origin. They specifically show similarities to thermokarst ponds observed in Northern Canada after the thawing of ice-rich permafrost mounds (Bussière et al., 2022; Calmels, Allard, & Delisle, 2008; Fortier & Aubé-Maurice, 2008). The mixture of sand and Brach's clay at the top of the Belin formation of the MPQ complex could act as a frost-susceptible sediment: a necessary component for frost-heave (Konrad, 1999, 2005; Peppin & Style, 2013). Therefore, given the paleoclimatic context of the region, our alternative hypothesis was that the portion of the SE1 group located outside of the karst context may have originated from the thawing of frost mounds during the Last Permafrost Maximum. In such a case, we should be able to detect typical solifluction features and frost-susceptible sediments close to the surface (Bussière et al., 2022; Pissart, 2000).
Near the VL anticline, however, our geophysical survey, aimed at detecting periglacial features, found only evidence of subsidence and no trace of frost-susceptible sediment or solifluction feature typical of permafrost. This new finding contradicts the periglacial hypothesis and therefore, supports the most recent publications in demonstrating the absence of permafrost in southwest France during the Last Glacial Maximum (Saltel et al., 2019; Stadelmaier et al., 2021). The detection of subsidence features definitely eliminates the aeolian hypothesis as well. Alternatively, this close to the anticline axis, the MPQ layers become thinner, the karst layers shallower and the faults more abundant: three elements likely to strengthen water percolation and crypto-karst. The step-like shape of the strongest reflector across depression #135 bears strong similarities to the sedimentary structures obtained under laboratory conditions when simulating ground collapse below a sand deposit (Al-Halbouni et al., 2018; Geyer, Folch, & Martí, 2006). A crypto-karst origin is therefore prone to explain the origin of the depressions near the VL anticline. Deeper geophysical investigation designed to target karst features (like gravimetry) would allow verification.
5.2 Validity of our morphogenetic classification: comparison with previous work
In this section, we verify our rough morphogenetic classification - opposing the SE1 group of karst depressions to the SE2 group of aeolian ones - against local investigations available in the literature. As far as we know, only five academic publications provide observations at the depression scale (Figure 11). Additionally, some dating carried out by Faure & Galop (2011) help refine the chronology of their formation, if not the process involved.
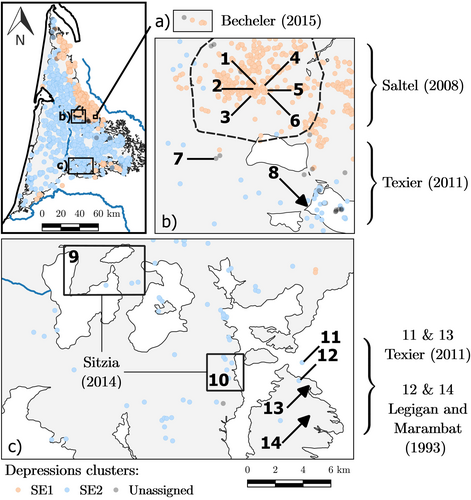
The depressions in Garein and Brocas municipalities, identified by Sitzia et al. (2015) as deflation hollows, are included in the SE2 group, supporting the interpretation of an aeolian origin for this group.
Likewise, the depressions identified as karstic by Becheler (2015) in Budos and by Saltel (2008) in Saint-Magne all belong to the SE1 group, reinforcing the interpretation of a karst origin for this subset. Specifically, Saltel (2008) identified step-like profiles in the bathymetry of eight large depressions, which they interpreted as a succession of karst collapses over time. The infill of one of them (labelled “Les Anguilleyrons”) was dated 2,312–2,107 BP by Faure & Galop (2011) at 170 cm depth. Another one (“La Hucau”) was exceptionally deep (10 m), reinforcing the interpretation as a doline.
Legigan & Marambat (1993) investigated one depression belonging to the SE2 group (“Bordelounque”, in Canenx-et-Réhaut) - a subcircular depression of 150 m in diameter and 1.8 m deep. According to the authors, it displayed a slightly asymmetric profile and a sandy surrounding rim. These elements are again consistent with an aeolian origin, with the surrounding rim possibly corresponding to a deflation lobe. Faure & Galop (2011) later dated its peaty filling, which stretches from 8,391 BP (at 61.5 cm) to 2,470 BP (at 25 cm depth). This implies a much earlier onset compared to the “Anguilleyrons” depression (SE1).
Finally, among the 4 depressions selected for stratigraphic cross-section analysis by Texier (2011), only 2 were included in the present inventory. The first one (“Roudrigue”, in Canenx-et-Réhaut) belongs to SE2. According to the author, it was formed at the expense of an aeolian sand sheet. The cross-section presented no deformation (soft or brittle), but some gley horizons were embedded in the sand deposits. Those were interpreted as the result of temporary flooding between low-amplitude dunes. Therefore, the aeolian origin of the SE2 group is still consistent. The second one (“du Bois”, in Hostens) has been classified as “unknown”. It is surrounded by another unassigned depression (350 m away), as well as depressions from both the SE1 (700 m away) and SE2 (<2,500 m away) groups. This reflects a particularly complex context and explains the indecision of the clustering algorithm. However, Texier (2011) clearly identified multiple small collapses and shears along the stratigraphic cross-section, which they interpreted as karst.
The other two depressions studied by Texier (2011) have disappeared due to human activity, but their stratigraphy can provide insights into the processes that occurred in their area, where other depressions still remain. One (“Matalin”, in Canenx-et-Réhaut) presented a surrounding rim, but no stratigraphic deformation. This implies the absence of karst processes. This depression was located in an area containing dozens of SE2 and “unknown” depressions. It was notably 900 m away from the “Bourdelounque” depression (SE2) - which also presented a sandy rim - and less than 2 km away from the “La Hubla” one, dated by Faure & Galop (2011) around 7,687–7,587 BP at 46 cm depth (before it also disappeared).
The second one (“La Honteyre”, in Hostens) was also located close to depressions currently classified in SE2 group or as “unknown”. However, the stratigraphy displayed numerous deformations and significant changes in layer thickness, interpreted as karst features (Texier, 2011). But the author also noted the presence of a surrounding rim, which we would rather associate with a deflation lobe. The peat filling was dated between 1,100 BP (at 29.5 cm depth) and 4,455 BP (at 98.5 m) (Faure & Galop, 2011). Again, the complexity of the context is consistent with the variability of classes (SE2 and “unknown”) found in the vicinity. It reveals that karst occurred in this area, whereas depressions of SE1 are only found further north, about 3 km away.
Overall, these local-scale investigations demonstrate that the morphogenetic distinction between SE1 and SE2 groups is mainly accurate, even though fine tuning may be necessary in some areas - notably where most of the depressions with “unknown” affiliations are found, or where the geological context is complex (e.g., in Saint-Magne). Additionally, the last example suggests that some old depressions may have been affected by both karstic and aeolian processes at different periods of time.
5.3 Geospatial data limitation and outlooks
Version 2 of BDLISA, which we used here, only provides a qualitative description of the vertical succession of geological layers, but gives no information about the thickness or the depth of each layer. Therefore, the vertical distance from a given depression to the nearest potential karst layers beneath could not be evaluated at the regional scale. Instead, we combined the qualitative stratigraphic information with the lateral distance to the nearest mapped karst features, as an insight of the karst context. This approximation relies on a local version of Walter's law: in the absence of a break in the sedimentary sequence, the lateral sequence of facies gives an insight into the vertical one. However, the uncertainty associated to this approximation is very high: it has probably led to an underestimation of the karst potential in some areas, particularly at the edges of the sand cover (which encompass the whole area of the SE1 depressions subset, as well as the border between the SE1 and SE2 subsets). In these areas, the stratigraphy needs to be refined on a case-by-case basis, using borehole stratigraphy. The next generation of BDLISA 3 will soon allow such a refinement by providing layer thickness estimation.
The precision in spatial extent of the layers is also critical in the karst assessment methodology presented here. The BDLISA has been built at the regional scale on the basis of spatial correlation between geological soundings that are unevenly distributed across the Landes Triangle. Despite best efforts, the mapping is inevitably subject to interpretation. As an illustration, if we extend the search for impermeable layers to a radius of 200 m around the depressions when using the decision tree (Figure 3), 6% of the depressions previously classified as in a karst context switch to a non-karst context. Conversely, some depressions located within the extent of an impermeable layer but close to its edges could actually be outside it and subject to crypto-karst, as it seems to be the case for depression #135. This highlights the need to pay special attention to depressions at the boundaries between karst and non-karst contexts.
6 CONCLUSION
At the regional scale, we showed that the Landes Triangle depressions can be classified into two subsets. The first one (SE1, with 1,366 depressions) is consistent with a crypto-karst origin, whereas the second one (SE2, 976 depressions) is likely to be of aeolian origin. Ninety depressions remain unassigned because they had no marked resemblance to either of the subsets. Near the VL anticline, the vast majority belongs to SE1, with 34% are not obviously in a karst context (according to the available data). To explore an alternative periglacial origin, we conducted a geophysical survey specifically designed to target periglacial features beneath the sand layers, such as solifluction lobes in frost-susceptible silt. Nevertheless, the geophysical images revealed only evidence of subsidence, with no indication of frost-susceptible sediment or thermokarst features. This aligns with recent paleoclimatic results, which show that climatic conditions in the Landes Triangle during the LGM were too mild for permafrost to develop. We conclude that a karst origin is the most plausible explanation for the formation of most depressions near the VL anticline, and that further geological investigation is needed to capture the extent of karst and map the related water pathways in that area.
More broadly, our methodology offers a robust framework for distinguishing between geomorphological processes. By integrating statistical analyses with geophysical imaging, it revealed the presence of karst depressions in a key recharge area of a regional aquifer. This implies the presence of rapid surface-to-groundwater connections and emphasizes the vulnerability of the groundwater resource to climate change. As this approach relies on commonly available GIS data and rapid, non-invasive geophysical methods, it can be extended to assess the role of any pond-like ecosystems in groundwater recharge.
ACKNOWLEDGEMENTS AND FUNDING
The research presented herein was supported by the Initiative d'Excellence program of Université de Bordeaux and by the Sentinel North program of Université Laval. The authors are also grateful to UMR 7619 METIS for the loan of their GPR and for their pertinent advice; to the CBNSA, CEN, CD40 and PNRLG for sharing the inventories of depressions; to J. Paris (UMR 5805 EPOC) for taking part in GPR acquisition; and to P. Bertran (UMR 5199 PACEA and INRAP) for his careful reading and pertinent comments on the early version of the manuscript. We thank two anonymous reviewers for their detailed comments and suggestions for improving this study.
CONFLICT OF INTEREST STATEMENT
The authors declare that they have no conflict of interest regarding the work presented here.
ACKNOWLEDGEMENTS
Open Access funding enabled and organized by Projekt DEAL.
Open Research
DATA AVAILABILITY STATEMENT
The data that support the findings of this study are available from the corresponding author upon reasonable request.


