Suspended transport of gravel in rivers: Empirical evidence from the 2022 flood in the Misa River (Eastern Apennines, Italy)
Abstract
In September 2022, an exceptional flood in the Misa River basin (Eastern Apennines, Italy) resulted in the unusual deposition of gravelly lobes on terraces up to 6 m higher than the riverbed. These deposits suggest that coarse bed sediments were transported in suspension rather than as bedload, as typically occurs under competent flow conditions. To verify this hypothesis, we combined field evidence—obtained from geomorphological and sedimentological surveys—with theoretical insights based on sediment transport theory. Our findings indicate that medium-sized gravels, which are part of the riverbed material, were transported in suspension within the water column. This phenomenon required specific conditions to generate the necessary shear stress and energy, including (i) a high-magnitude flood enriched with fine sediments, which increased the fluid density and viscosity, and (ii) an entrenched channel with stable banks that limited channel widening during the flood event. When these processes coincided with alluvial plain inundation by overbank flows, gravel transported in suspension was able to reach and settle on elevated surfaces, such as terraces far above the active channel. These observations highlight the potential for gravel-bed rivers to support the transport of coarse sediment in suspension under extreme flood conditions and specific geomorphological constraints on the active river channels. By demonstrating the role of sediment concentration, channel morphology and flood dynamics, our research provides new insights into sediment transport mechanisms and contributes to a broader understanding of the morphodynamic processes governing gravel-bed rivers under such exceptional conditions, with broad implications for refining flood hazard models and improving sediment transport predictions in fluvial systems.
1 INTRODUCTION
In gravel-bed rivers, the coarse clasts that constitute the alluvial bed are intermittently transported as bedload during competent flow conditions (Church, 2006). This bedload transport ranges from stage 1 (i.e. partial mobility of bed material) to Stage 3 (i.e. full mobility of bed material) according to the characterisation provided by Carling (1988) and Ashworth and Ferguson (1989). Once set into motion, sediment clasts are transiently deposited within the geomorphic active channel, which is delineated as the morphodynamic domain directly shaped by the bed material load, encompassing wet channels and sediment bars (Brousse et al., 2021; Ham & Church, 2002) (Figure 1). Coarse clasts transported as bedload can only occasionally reach surfaces extending beyond the active channel, such as active (or genetic) floodplains, which typically exhibit topographic elevations comparable to—or slightly higher than—the riverbed (Gautier et al., 2009, 2010; Hupp & Osterkamp, 1996; Wohl, 2021). These phenomena are chiefly observed during major flood events (Hauer & Habersack, 2009; Magilligan, Buraas, & Renshaw, 2015; Ritter & Blakley, 1986), thereby fostering the formation of gravelly deposits commonly organised in crevasse splays or floodouts (Hajek & Edmonds, 2014; Millard, Hajek, & Edmonds, 2017; Yamada et al., 2023) (Figure 1).
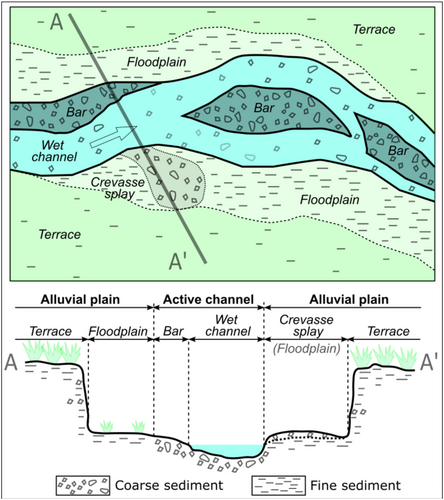
Although gravels constitute the dominant size in gravel-bed rivers, there is usually a substantial amount of sand stored in the interstices of the alluvial substrate (Church, 2010). These finer particles (e.g. fine to medium sand) and the mud commonly constituting the river washload are predominantly transported in suspension (Church, 2006). During overbank stages, the fine material is subsequently deposited onto floodplains (Asselman & Middelkoop, 1995; Magilligan, 1992; Pizzuto, Moody, & Meade, 2008; Saint-Laurent et al., 2010). Additionally, this material may settle on superelevated surfaces, such as fluvial terraces, when channels are entrenched within an alluvial plain (Figure 1) and temporary inundation occurs during high-magnitude hydrological events. Being transported in suspension, such fine materials can also reach and subsequently settle in areas more distal to the active channel. An exemplary case of these mechanisms is delineated in the study by Moody and Meade (2008), which analyses the sediment transport and deposition engendered by a high-magnitude flood event along the Powder River (USA). The authors highlighted how substantial quantities of coarse material, comprising a significant fraction of gravel and coarse sand, were transported as bedload and deposited in the geomorphic active channel and onto the surrounding floodplains. Meanwhile, the pronounced aggradation observed on terraces situated approximately 2 to 3.5 m above the riverbed stemmed from the deposition of silt, coupled with fine sands and clay, transported in suspension by overflowing water and then deposited during the recession phase of the flood event.
As part of a series of field investigations examining the geomorphological responses of rivers to high-magnitude floods, we recently identified unusual fluvial features in the Misa River, located in Central Italy. This river was affected by a high-magnitude flood in September 2022. Despite rather moderate effects in terms of flood-induced morphological changes (e.g. channel widening and riverbed elevation changes), we identified repeated occurrences of overbank sediment accumulations. These include muddy–sandy deposits and freshly deposited gravels arranged in lobate sedimentary bodies formed on terraces positioned several meters (up to more than 6 m) above the riverbed. The absence of erosional features on the surface of the terraces—such as scour holes, which in other contexts have been described by Magliulo and Valente (2020) and Mandarino, Luino and Faccini (2021) as capable of exhuming coarse materials potentially buried within the terraces—combined with the lack of other potential sources of coarse sediment (e.g. levee breaching) near the depositional lobes, indicates that the gravels forming these deposits are exotic in origin (i.e. allochthonous) relative to the terraces on which they were found. Moreover, the similarity in grain size with the active channel suggests that the gravel component within these deposits consists of riverbed sediments (D50 = 7–13 mm) that have been transported and deposited on superelevated river terraces.
These observations prompt questions about the processes responsible for the deposition of coarse fluvial sediment in such superelevated surfaces, where, according to conventional sediment transport mechanisms described in the literature, only finer sediment transported in suspension (e.g. sand) would typically be expected to settle (Church, 2006; Hajek & Edmonds, 2014; Magilligan, Buraas, & Renshaw, 2015; Moody & Meade, 2008) (Figure 1). Clarifying these mechanisms will not only enhance our understanding of river geomorphic responses to high-magnitude flood events (Church, 2006; Rinaldi et al., 2016) but also improve our ability to properly assess the related hydro-geomorphological hazards (Brenna et al., 2021; Bryndal et al., 2017; Rinaldi et al., 2015; Vázquez-Tarrío et al., 2024). The objectives of this study are as follows: (1) to investigate the transport mechanisms (i.e. bedload, suspended load) that may have mobilised, transported and deposited the gravelly bed material on the Misa River terraces, and (2) to elucidate the geomorphologic and hydraulic conditions necessary for the occurrence of such morpho-sedimentary dynamics.
2 STUDY AREA
The Misa River is 48 km long and flows northeastward from the Eastern Apennines in central Italy toward the Adriatic Sea, where it empties near the city of Senigallia (see Figure 2). The Misa River catchment extends for 379 km2, with its highest point reaching 820 m a.m.s.l. (Figure 2). The upper part of the catchment exhibits a topography and geology characteristic of the Umbria–Marche Apennines, dominated by Cretaceous and Miocene limestones alongside terrigenous rocks (Calderoni et al., 2010). Here, the Misa River assumes the characteristics of a mountain torrent, featuring steep riverbed slopes exceeding 3–4%, with coarse gravels and pebbles forming the bed material. Transitioning to the hilly terrain between the mountainous region and the coastal plain, the river has an average slope of around 0.5%. Within this sector, the Misa River flows through an alluvial plain that was incised, leading to the formation of terraces which are from 1.5 to 8 m higher than the present riverbed (Figure 2). The surrounding slopes of the local hills, predominantly composed of Plio–Pleistocene mudstones (Argille Azzurre Formation), flank this alluvial plain. Moving downstream, the alluvial plain gradually widens from a few tens of meters to several hundred meters as it approaches the coastline (Figure 2). The gravel-bed river's morphology predominantly exhibits a sinuous single-thread channel, with an average active channel width ranging between 5 and 30 m. The segment of the river within the hilly terrains represents our study area (Figure 2). The downstream segment of the river, from its confluence with the Nevola River to its mouth at the Adriatic Sea, was not considered in this study because it is extensively modified by human activities, with artificial levees and longitudinal bank protections that significantly limit channel morphodynamics.
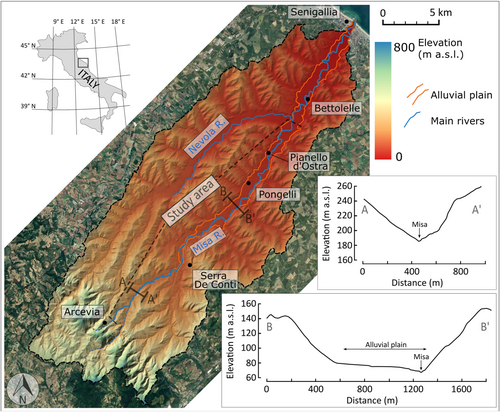
The basin's climate is classified as sub-Mediterranean. Average annual rainfalls exhibit variability across elevations, ranging from 1100 to 1200 mm at higher altitudes to 800 mm in coastal regions, with peak rainfall typically occurring during autumn (Amici & Romina, 2002). The hydrological regime of the Misa River is primarily influenced by precipitation. Mean daily discharge at Senigallia typically ranges between 2 and 4 m3 s−1, although notable fluctuations can occur, particularly during intense hydrological events. For instance, discharges can escalate significantly, reaching approximately 400 and 600 m3 s−1 for events with recurrence intervals of 100 and 500 years, respectively (Bagnarelli et al., 2016; Brocchini et al., 2017).
One of these extreme events occurred on 15 September 2022, when the central regions of Italy experienced a self-regenerating storm that brought about substantial rainfall to the study area between 15:00 and 20:00 CET. Cumulative precipitation during this short period locally exceeded 400 mm, with associated recurrence intervals exceeding 1000 years (Boccanera et al., 2022). This intense rainfall event caused severe flooding in several streams along the Adriatic side of the central Apennines, including the Misa River (Morelli et al., 2023). Overbank flooding inundated extensive areas of the heavily anthropised alluvial plain, resulting in 13 fatalities and substantial damage to human infrastructures (Pulvirenti et al., 2023), with estimated economic losses approaching EUR 2 billion. Although widespread damage to hydrometric gauging stations resulted in incomplete records of the event, data from the Bettolelle gauging station, located downstream of the Nevola River confluence (see Figure 2), indicate that the peak of the flood occurred between 22:00 and 23:00 CET on 15 September. The hydrometric levels reached approximately +6.4 m above the local hydrometric datum. This measurement exceeds the maximum value for which stage–discharge relationships are available. Consequently, determining the exact maximum discharge during the event proves challenging. Nevertheless, it is plausible that the discharge surpassed historical maximums, which stood at several hundred cubic meters of water per second.
3 MATERIALS AND METHODS
3.1 Data collection
3.1.1 Field surveys
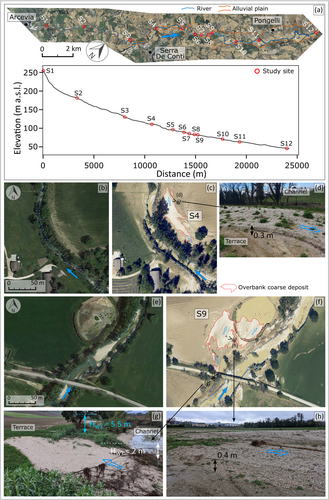
In the months immediately following the September 2022 event (November 2022–March 2023), field surveys were undertaken along the Misa River to examine the geomorphological effects induced by the flood. These surveys encompassed various activities, including the description of channel morphologies. However, particular emphasis was placed on sites characterised by the presence of overbank deposits consisting of freshly deposited fluvial gravels arranged in lobate sedimentary bodies. Each site exhibiting such coarse sedimentary bodies, situated on terraces notably higher in elevation (approximately from 2 to 6 m) than the mean riverbed elevations, was considered a study site warranting detailed investigation (Figure 3). Preliminary GIS observation of the 2022 post-flood aerial photographs (see Section 3.1.2) shows a widespread presence of this type of deposit along the hilly sector of the river, amounting to a total of approximately 23 depositional bodies likely composed of coarse material. The emergency interventions carried out in the days immediately following the September 2022 flood and the intense agricultural activities that characterise the Misa valley floor obliterated some of these deposits, thus making possible the detailed field survey and characterisation of 12 depositional bodies, located along a river sector that extends for about 24 km between the villages of Arcevia and Pianello d'Ostra (Figure 2). At these sites, comprehensive geomorphological and sedimentological observations were conducted to delineate the characteristics of the overbank deposits, the banks and the riverbed.
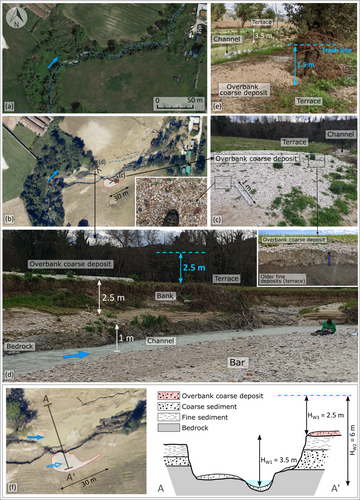
The D16, D50 and D84 parameters of the overbank coarse deposits were determined through the application of grid-by-number counting methodology (Church, McLean, & Wolcott, 1987; Wolman, 1954). A random sampling grid was defined for each lobe, established by laying out a tape along lines spaced at intervals ranging from 1 to 5 m. Samples were collected at regular intervals along the tape, with a total of 150 to 200 particles collected at each lobe following the sample size recommended by Bunte and Abt (2001). To sort particles finer than 128 mm based on their b-axes (intermediate axes), a half-phi template with square openings was utilised, following the methodology suggested by Wohl et al. (1996). A similar procedure was employed to determine the grain size distribution of the alluvial sediments constituting the riverbed in proximity to the overbank deposits under investigation. The site for grain size measurements within the active channel was selected based on accessibility (e.g. emerged sediment bars) (Figure 3d). The maximum thickness of the overbank coarse deposits was estimated through direct field observations and by digging specific trenches expressly for this purpose (Figure 3c).
The topography of both the active channel and the adjacent floodplains and terraces was determined utilising a laser distance sensor in conjunction with an optical level to measure elevation differences. During these topographic surveys, particular attention was devoted to evaluating the maximum water levels reached during the flood. Assessment of these levels was conducted by examining indicators such as trash or woody debris lines and other effects on riparian vegetation (e.g. branch breaking) caused by the water flow (Figure 3e). These measurements allowed the determination of three fundamental hydrometric heights (Figure 3f): the water height relative to the talweg at the bank-full stage (HW1); the maximum water height relative to the talweg at the flood peak (HW2); and the maximum height of overbank water flowing onto the terraces (HW3). These measurements refer specifically to the bank (right or left) above which overbank coarse deposits were found and consider the post-event talweg elevation. In the absence of detailed pre-flood topographic surveys, such as high-resolution digital terrain models (DTMs), it is not feasible to accurately ascertain these elevations relative to the pre-event talweg levels. Nonetheless, field observations suggest with reasonable confidence that most study sites experienced little to no significant riverbed elevation changes, either through incision or deposition, during the flood event. This conclusion is supported by the absence of significant undercutting at bridge piers and the presence of only moderate and/or localised deposition of fresh material on structures (e.g. weirs) within the riverbed.
The banks of the active channel were characterised at each study site based on both their sediment composition and geometry. Concerning sediment composition, banks were classified as cohesive (predominantly composed of fine alluvial sediments or bedrock, such as Plio–Pleistocene mudstones; Calderoni et al., 2010; Bagnarelli et al., 2016), non-cohesive (composed mainly of coarse alluvial sediments) or composite (Figure 3d and f). In terms of geometry, we differentiated between (sub-)vertical and planar banks based on whether their average slope inclination was greater or less than 45°, respectively.
3.1.2 Remote sensing analyses
Data collection was completed through a series of remote analyses performed utilising QGIS 3.36.0. A high-resolution aerial photograph captured on 18th September 2022 (i.e. 3 days after the event) by the Protezione Civile of the Marche Region, served as the basis for manually digitising the planimetric extent of overbank coarse deposits identified in the field (Figure 3b). This post-event image was juxtaposed with the pre-event (April 2022) Google Satellite imagery to assess the morphological changes induced by the flood at the designated study sites. We quantified river widening using the width ratio (Krapesch, Hauer, & Habersack, 2011), calculated as the ratio of the active channel's average width after the event (manually digitised from September 2022 aerial photos; Figure 3b) to its width before the event (manually digitised from April 2022 satellite images; Figure 3a). Given the purposes of this work, this digitisation was focussed exclusively on the study sites characterised by the presence of the coarse overbank deposits, considering local portions of the river of lengths of a few hundred meters (i.e. 400 to 800 m) centred on each study site. Remote sensing imagery was complemented by a 1:5000-scale topographic map (Carta Tecnica Regionale, CTR) and a Digital Elevation Model (DEM) with a 10-m resolution obtained from the Geoportale of the Marche Region (https://www.regione.marche.it/Regione-Utile/Paesaggio-Territorio-Urbanistica/Cartografia). This dataset enabled the digitisation of the margins of the alluvial plain (Figure 2) and the calculation of channel slopes at the study sites. Average slopes were determined by considering elevation differences along a 400 m-long segment of the channel centred on each study site, encompassing 200 m upstream and 200 m downstream from the centre of each coarse overbank deposit.
3.2 Hydraulic calculations
One of the objectives of this study was to explore the transport mechanisms (i.e. suspended load versus bedload) involved in the mobilisation, transportation and subsequent deposition of the gravels forming the overbank coarse deposits on river terraces during the 2022 flood. While morphodynamic modelling approaches (e.g. Nicholas & Walling, 1998; Williams, Brasington, & Hicks, 2016) are frequently employed for addressing similar inquiries, their application in this particular case was deemed challenging for two main reasons. Firstly, such models still possess inherent limitations concerning predictive accuracy and the scale of applicability, especially when applied to dynamic streams during high-magnitude floods (Ferguson, 2007; Ferguson & Church, 2009; Mohammadi et al., 2018; Mosselman, 2012). Secondly, the application of morphodynamic models at a detailed spatial and temporal scale would necessitate refined input data, including high-resolution DEMs and detailed flood hydrographs, which are largely unavailable in this context.
Following Parker's seminal work in the early 1980s (refer to Garcia, 1999) and the comprehensive review conducted by Buffington (1999), the integration of real river data into the original Shield diagram (Shields, 1936) has led to the development of the Shields–Parker River Sedimentation Diagram, as proposed by García (2008). This refined diagram features three distinct curves, allowing for the determination of whether a specific bed sediment grain will be mobilised by a given flow, based on various values of and . It also indicates whether the prevailing mode of transport will be bedload or suspended load (Figure S1).
The approach was applied to determine the transport mechanisms that might have affected the grains constituting each overbank coarse deposit on the terraces. Most of the parameters required to apply the Shields–Parker River Sedimentation Diagram, including median sediment diameter (D50 of the overbank deposit at each study site), flow depth and stream slope, were available from the surveys described in Section 3.1. Three flow depths were considered for each study site, corresponding to HW1 (i.e. the water height relative to the talweg at the bank-full stage), HW2 (i.e. the maximum water height relative to the talweg at the flood peak) and HW3 (i.e. the maximum height of overbank water flowing onto the terraces) (Figure 3f). In this way, it was possible to reconstruct the evolution of the flood in terms of transport mechanisms, starting from the bankfull condition and progressing through to the flood peak, when overflow waters inundated the terraces. Concerning the parameters for which no measured data were available (i.e. fluid and sediment densities, and kinematic viscosity), we referred to realistic values determined from literature data. We considered in particular the results obtained by Rickenmann (1991), who analysed the effects of an increasing fluid density on the flow transport capacity. Among the available experimental flume configurations, we selected the following fluid density () and kinematic viscosity () values representative of water, water with moderate concentration of fine sediment moved in suspension and hyperconcentrated flow, respectively: = 998 kg m−3 and = 1.0*10−6 m2 s−1; = 1078 kg m−3 and = 4.6*10−6 m2 s−1; = 1365 kg m−3 and = 183.2*10−6 m2 s−1. Kinematic viscosities were obtained from the ratio of the dynamic viscosities reported in the paper (i.e. 1, 5 and 250 cP) to the respective fluid densities. Lastly, considering the predominantly calcareous lithologies of the grains, a value equal to 2500 kg m−3 was considered as sediment density for our calculations.
Lastly, for the study sites where possible to measure the grain size of the bed material (D16, D50 and D84), we calculated also the dimensionless shear stress () exerted by the flow on the alluvial sediments forming the riverbed. This calculation utilised the water depths at bankfull conditions (HW1) and at flood peak (HW2) as the values for H, following Equation (1).
4 RESULTS
4.1 Characterisation of the study sites and post-flood analysis
4.1.1 Morphological and sedimentological characterisation
The spatial distribution of the 12 sites characterised by the presence of coarse overbank deposits placed on terraces surveyed in the field is shown in Figure 4a. The areal extents of the depositional bodies are extremely variable, varying from a few tens of square meters (e.g. S1 and S12) up to a maximum of 6720 m2 measured at Site S11, while the maximum thicknesses observed in the field are typically around 20–30 cm, except as observed at site S10 where the coarse overbank deposit locally reaches thicknesses close to 1 m (Table 1). Depositional bodies typically assume a lobed shape elongated in the local direction of overflow water fluxes, evaluated from evidence such as the orientation of tree trunks uprooted and transported by the flow (Figures 3 and 4). These deposits are massive—showing no visible stratification in the trench exposures (Figure 3c)—and lack well-developed sedimentary structures, except for some iso-oriented elongated clasts whose long a-axes are either parallel or transverse to the flow direction, and few imbricated fabrics.
| Study site | Channel slope (%) | Banks type | Width ratio | HW1 (m) | HW3 (m) | HW2 (m) | Area (m2) | Max thickness (cm) | D16 (mm) | D50 (mm) | D84 (mm) | D16 (mm) | D50 (mm) | D84 (mm) |
|---|---|---|---|---|---|---|---|---|---|---|---|---|---|---|
| Overbank deposits | Riverbed sediments | |||||||||||||
| S1 | 3,40 | M – P | 3,0 | 1,6 | 1,2 | 2,8 | 18 | 15 | 2,5 | 6,4 | 22,0 | - | - | - |
| S2 | 1,20 | M - V/P | 3,4 | 3,8 | 1,7 | 5,5 | 438 | 25 | 3,6 | 7,7 | 21,8 | - | - | - |
| S3 | 0,35 | M – V | 3,1 | 3,5 | 2,5 | 6,0 | 202 | 50 | 4,7 | 9,3 | 22,2 | 4,0 | 9,6 | 22,5 |
| S4 | 0,20 | M - P/V | 1,7 | 3,8 | 4,2 | 8,0 | 1650 | 30 | 5,0 | 10,0 | 19,8 | 2,4 | 8,4 | 19,1 |
| S5 | 0,23 | M - V/P | 3,1 | 2,5 | 4,3 | 6,8 | 303 | 30 | 3,3 | 8,4 | 15,0 | 4,3 | 8,6 | 11,4 |
| S6 | 0,60 | C – V | 1,7 | 4,5 | 3,3 | 7,8 | 3009 | 35 | 4,7 | 8,8 | 22,3 | - | - | - |
| S7 | 0,75 | C – V | 2,0 | 5,0 | 3,6 | 8,6 | 870 | 30 | 4,5 | 7,8 | 14,8 | 2,5 | 10,1 | 34,7 |
| S8 | 1,10 | C – V | 1,8 | 6,3 | 3,5 | 9,8 | 305 | 25 | 2,7 | 6,9 | 18,5 | 2,0 | 12,7 | 35,6 |
| S9 | 0,71 | M – P | 2,2 | 2,0 | 5,5 | 7,5 | 4895 | 40 | 2,9 | 6,9 | 16,9 | 6,2 | 13,3 | 22,4 |
| S10 | 0,64 | M – V | 1,2 | 2,5 | 4,5 | 7,0 | 1499 | 100 | 4,1 | 6,8 | 15,2 | 4,9 | 13,3 | 27,8 |
| S11 | 0,77 | C – V | 1,4 | 3,5 | 3,0 | 6,5 | 6720 | 30 | 3,8 | 7,5 | 18,1 | 2,8 | 6,5 | 14,5 |
| S12 | 0,50 | C – V | 1,1 | 4,0 | 2,4 | 6,4 | 49 | 35 | 4,7 | 8,1 | 14,3 | - | - | - |
- Note: Bank type: M (composite), C (cohesive), P (planar), V (sub-vertical). Area and maximum (Max) thickness refer to the coarse overbank deposits.
All analysed overbank deposits are characterised by a scarcity of fine sediments, demonstrating relatively good sorting, and consistent grain sizes. The median grain size (D50) ranges from a minimum of 6.4 mm (fine gravel) to a maximum of 10 mm (medium gravel), with the 84th percentile grain size (D84) not exceeding 22.3 mm (coarse gravel) (Figure 5). The D84/D50 ratio has a median value of 2.40, with a range spanning from 1.77 to 3.44. The particle size distributions of riverbed sediments, sampled from fluvial bars, are similar to those observed in overbank deposits but generally exhibit slightly higher characteristic parameter values. Riverbed sediments have D50 values ranging between 6.5 and 13.3 mm (fine to medium gravel), while the maximum D84 reaches up to 37.4 mm (very coarse gravel) (Figure 5). The D84/D50 ratio has a median value of 2.25, with a range spanning from 1.33 to 3.53. Additionally, the sediments sampled from the riverbed exhibit a higher fraction of fine materials (silt and sand), as evidenced by D16 values that are typically slightly lower than those observed in the overbank deposits (Figure 5).
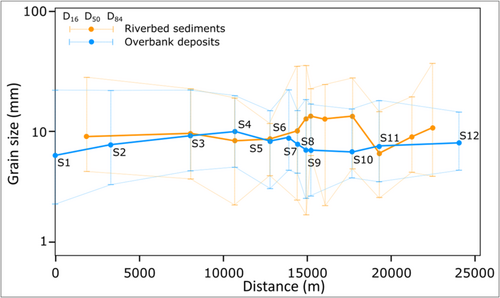
The riverbed slope measured locally at the study sites appears to be highest for the two sites located upstream (3.4 and 1.2% measured at sites S6 and S7, respectively) and then settles down to median values of approximately 0.6% from site S17 (Table 1).
4.1.2 Estimate of water depth during the 2022 flood
The water heights relative to the talweg at the bankfull stage (HW1) range from a minimum of 1.6 to a maximum of 6.3 m, measured at sites S1 and S8, respectively (Table 1). Such HW1 levels commonly exceeding 3–4 m are allowed by channel geometry, because the channel is often found to be significantly entrenched with respect to the surrounding alluvial plain (Figures 3 and 4). The maximum heights of water flowing onto the terraces where the coarse overbank deposits are located (HW3) range from a minimum of 1.2 to a maximum of 5.5 m, measured at sites S1 and S9, respectively (Table 1), with a median HW3 value of approximately 3.6 m. These HW3 values indicate major flooding of the alluvial plain, with notably high water depths observed near the river banks. Consistent with the previous observations, the maximum water heights relative to the talweg at the flood peak (HW2) show extremely high values, with a median of about 7.3 m and the highest value close to 10 m measured at site S8 (Table 1).
4.1.3 Bank composition and channel widening
At the study sites, the banks of the active channel predominantly exhibit a (sub)vertical geometry, although planar banks with a relatively steep slope were observed at five locations (Table 1). From a compositional perspective, purely non-cohesive banks are absent at all sites. Upstream sites, from S1 to S5, are characterised by composite banks, where dominant fine cohesive materials are associated with outcrops of mudstone bedrock and gravelly strata. Conversely, moving towards the downstream sites, starting from S6, purely cohesive banks become dominant (Table 1). The bank erosion that occurred during the event caused channel widenings at the study sites varying from small (e.g. width ratio of 1.1 at site S12) to moderate (e.g. width ratio of 3.1 at site S5). In general terms, moderate widening was found in the upstream sectors, while almost negligible widening characterised the downstream sites (Table 1).
4.2 Application of the Shields–Parker River sedimentation diagram
The data presented in Table 1, which includes river slope, water depths and median grain sizes of investigated gravels, were utilised to analyse the processes transporting the gravel grains constituting overbank coarse deposits during different flood stages (i.e. bankfull, peak and overflowing phases). This analysis was conducted using the Shields–Parker River Sedimentation Diagram. Given the lack of direct information regarding the physical characteristics of the flow during the flood events, calculations were carried out using three configurations (Table 2) that represent the range of plausible conditions of flow characteristics in terms of fluid density () and kinematic viscosity ().
| Flow depth | ||||
|---|---|---|---|---|
| HW1 | HW2 | HW3 | ||
| Fluid characteristics | = 998 kg m−3 ν = 1.0*10−6 m2 s−1 |
Suspended load: 3 sites Bedload: 9 sites |
Suspended load: 8 sites Bedload: 4 sites |
Suspended load: 3 sites Bedload: 9 sites |
= 1078 kg m−3 ν = 4.6*10−6 m2 s−1 |
Suspended load: 5 sites Bedload: 7 sites |
Suspended load: 9 sites Bedload: 3 sites |
Suspended load: 4 sites Bedload: 8 sites |
|
= 1365 kg m−3 ν = 183.2*10−6 m2 s−1 |
Suspended load: 12 sites Bedload: 0 sites |
Suspended load: 12 sites Bedload: 0 sites |
Suspended load: 12 sites Bedload: 0 |
|
- Note: HW1: the water height relative to the talweg at the bank-full stage, HW3: the maximum height of overbank water flowing onto the terrace and HW2: the maximum water height relative to the talweg at the flood peak.
The first set of calculations pertains to the flow of pure water, devoid of any fine sediment suspension, characterised by a fluid density () of 998 kg m−3 and a kinematic viscosity () of 1.0 * 10−6 m2 s−1 (Table 2). Under bankfull conditions—specifically, at the stage of the flood immediately preceding overflow, simulated considering the flow depth as indicated by HW1—the dimensionless Shields number () and Reynolds number () values suggest different transport conditions across multiple sites (Figure 6a). For three sites, the analysis indicates conditions favourable for the suspended transport of gravels found on the terraces. Conversely, for the remaining seven sites, the calculations indicate bedload transport of gravels. As the flood progresses towards its peak, corresponding to the maximum water levels observed in the field and denoted as HW2, there is an increase in Shields number values with a range spanning from 1.06 to 10.38. This increase in enhances the likelihood that gravels at 8 out of the 12 sites are transported in suspension (Figure 6b). Finally, as the water overflows the river channel and spreads across the terraces, where the gravel deposits are located, the instantaneous reduction in flow depth from HW2 to HW3 results in a decrease in values, ranging from 0.56 to 4.24. Consequently, this decrease in Shields number induces a rapid transition to bedload transport conditions for the majority of the study sites, specifically 9 out of 12 (Figure 6c).
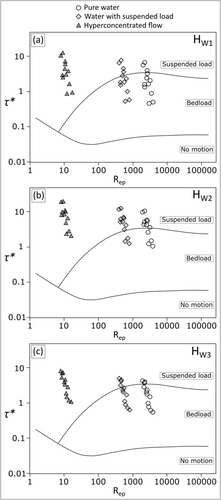
In the second set of calculations, we considered a water flow characterised by a moderately high presence of fine material transported in suspension. This condition results in a fluid density () of 1078 kg m−3 and a kinematic viscosity () of 4.6*10−6 m2 s−1 (Table 2). The increase in the values of these physical parameters enhances the likelihood of suspended transport for the analysed gravels. Under bankfull stage conditions (HW1), resulting in values spanning from 0.52 to 7.61, suspended load conditions were observed in five out of the 12 sites evaluated (Figure 6a). This number increases to nine sites when considering the peak flood stage (HW2) and the related values (1.21–11.84). In this configuration, the gravels at the remaining three sites are situated very close to the threshold between extremely intense bedload transport and suspended transport (Figure 6b). Under conditions of overflowing water on terraces (HW3), the decrease in flow depth causes gravel transport to occur in suspension at four sites, while the remaining eight sites exhibit bedload transport (Figure 6c).
The same calculations were performed considering a hyperconcentrated flow characterised by a fluid density () of 1365 kg m−3 and a kinematic viscosity () of 183.2*10−6 m2 s−1 (Table 2). Under this latter configuration, regardless of the flood stage considered, the flow depths (HW1, HW2 and HW3) and the relative , reaching a maximum value of 18.79, were always sufficient to transport gravels entirely in suspension (Figure 6). The significant shift toward lower Reynolds number values observed in these configurations is attributed to the two orders of magnitude increase in kinematic viscosity compared to that of pure water.
Lastly, Equation (1) was also employed to estimate the dimensionless shear stress () induced under bankfull conditions and at the flood peak on the alluvial material constituting the riverbed. Therefore, this analysis included specifically the eight sites where the D50 estimation of the bed material was performed exactly at the study sites (Figure 5) where HW1 and HW2 water height data were available (Table 1), and was performed considering only a configuration representing a fluid with moderately high presence of fine material transported in suspension ( = 1078 kg m−3). The values so obtained at the bankfull stage (HW1) range from 0.51 to 4.14, increasing to 1.38–6.43 at the flood peak simulated considering HW2 (Table 3).
| Study site | τ*(HW1) | τ*(HW2) |
|---|---|---|
| S3 | 0.97 | 1.66 |
| S4 | 0.69 | 1.44 |
| S5 | 0.51 | 1.38 |
| S7 | 2.81 | 4.84 |
| S8 | 4.14 | 6.43 |
| S9 | 0.81 | 3.04 |
| S10 | 0.91 | 2.55 |
| S11 | 3.14 | 5.84 |
5 DISCUSSION
5.1 Flow's physical parameters and mechanisms of gravel transport
The results presented in Section 4.2 elucidate the mechanisms responsible for the transport of gravels at different flood stages. As previously mentioned, in the absence of direct measurements of the flow's physical parameters during the 2022 flood event, we conducted most of our calculations using three different combinations of fluid densities and kinematic viscosities, representative of pure water, water with suspended fine sediment, and hyperconcentrated flow. The results obtained by considering physical parameters representative of pure water ( = 998 kg m−3; = 1.0*10−6 m2 s−1) indicate that in most cases (8 out 12) the hydraulic conditions at the peak of the flood allowed for the transport of gravels as suspended load (Figure 6b).
However, such a representation of the flow's physical characteristics is considered quite unrealistic. The geological characteristics (e.g. the presence of easily erodible pelitic lithotypes in outcrops; Bagnarelli et al., 2016) and the land use in the Misa catchment (e.g. extensive agriculture) indicate a propensity of the basin to produce substantial amounts of clay, silt and fine sand. These fine materials are entrained by surface runoff, partially conveyed into the stream network, and transported in suspension by the Misa River, particularly under high-discharge conditions (Brocchini et al., 2017). Additionally, field and remote sensing evidence supports the occurrence of a large amount of fine material in suspension during the 2022 flood. This is evidenced by the substantial mud deposits on inundated floodplains and terraces (Figure 4f), as well as the extensive river sediment plume observed at the mouth of the Misa River during the 2022 flood event (Figure 7). In light of this, it is reasonable to assume that the second type of flow considered in our calculations, that is, water with a substantial suspended sediment load such as to generate a fluid density of 1078 kg m−3 and a kinematic viscosity of 4.6 * 10−6 m2 s−1, may likely be closer to the real flow characteristics during the flood event. Comparable flow characteristics have been recorded during high-magnitude floods in European streams with climatic, morphometric and geological characteristics similar to those of the Misa River. For instance, in the Isábena River (northern Spain), López-Tarazón et al. (2009) reported maximum concentrations of suspended sediment ranging from approximately 100 to over 350 g l−1. In the context of the Italian Apennine region, De Girolamo et al. (2023) reported maximum suspended sediment concentrations ranging from 50 to 90 g l−1 in several southern Apennine streams. Syvitski and Kettner (2007) highlighted that the Apennine streams, characterised by relatively small and rugged catchments, are easily capable of generating high concentrations of suspended sediment (> 60 g l−1) that are enough to potentially generate hyperpycnal plumes of sediments in the Adriatic Sea. Therefore, the fluid density used in the second set of calculations is deemed realistic. Under these assumptions, the hydraulic conditions at the flood peak were fully consistent with movement in suspension of the gravels forming the overbank deposits at nine study sites, with data points from the remaining three sites lying close to the threshold between intense bedload transport and suspended load (Figure 6b).
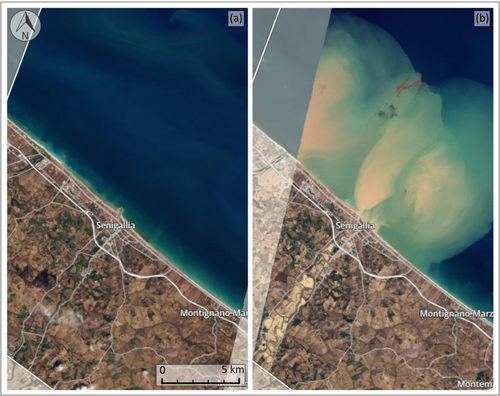
The third set of calculations considers a potential hyperconcentrated flow, rheologically defined as a plastic, turbulent to laminar and non-Newtonian flow that has an apparent liquid behaviour in which water transports an extremely high amount of suspended sediment (e.g. fluid density of 1100–1400 kg m−3) (Coussot & Meunier, 1996; Pierson & Costa, 1987). When these phenomena occur, flows can reach densities ranging from 1150 to 1600 kg m−3 (e.g. Li, Qi, & Sun, 1997; Wang & Ta, 2016). This type of process, with the exception of volcanic settings (e.g. Cronin et al., 1999) is relatively uncommon in rivers within temperate climates. However, considering the characteristics of the Misa catchment (e.g. over 85% of the basin area is dedicated to agricultural use), the extreme magnitude of the 2022 flood event and the post-flood evidence mentioned earlier (Figure 7), it cannot be ruled out that the flow during the 2022 event may have at least temporarily and/or locally approached hyperconcentrated states—similar to those hypothesised for several gravel-bed rivers of the Gangetic Plains during severe floods (Quick et al., 2023). These conditions were simulated considering a fluid density of 1365 kg m−3 and a viscosity of 183.2 * 10−6 m2 s−1 according to Rickenmann (1991). Under such circumstances, all the gravels found on the river terraces at the 12 study sites could have been mobilised in suspension at the flood's peak (Figure 6b). The progressive increase in the number of study sites where and values are compatible with the suspended transport of gravels—shifting from simulations based on pure water flows to those assuming hyperconcentrated flows—fully aligns with the core assumptions of the Shields–Parker approach. Previous studies have confirmed the importance of fluid density and viscosity in determining the transport capacity of a flow, demonstrating that increasing suspended sediment concentration promotes the entrainment and mobility of coarse riverbed particles (e.g. An et al., 2019; Quick et al., 2023; Rickenmann, 1991; Xu, 2002). Moreover, García and Parker (1993) highlighted how denser flows are more prone to entrain sandy bed sediments and transport them in suspension. However, to our knowledge, no previous field studies have specifically considered the potential effects of flow's physical parameters on the mechanisms responsible for the transportation of bed gravels in alluvial rivers.
5.2 Temporal evolution of gravel transport processes during the flood event
It is likely that the flow in the Misa River during the 2022 flood event exhibited spatially and temporally variable physical characteristics within the studied sector. However, in light of the preceding discussion, we consider it reasonable to hypothesise that the flow consistently ranged between the conditions represented by two of the configurations considered in this study: moderately high ( = 1078 kg m−3; = 4.6 * 10−6 m2 s−1) and very high ( = 1365 kg m−3; = 183.2 * 10−6 m2 s−1) suspended sediment concentrations (Figure 6). This hypothesis allowed us to reconstruct the temporal evolution of mechanisms that determined the mobilisation, transport and overbank deposition of gravels during the different stages of the flood (Figure 8).
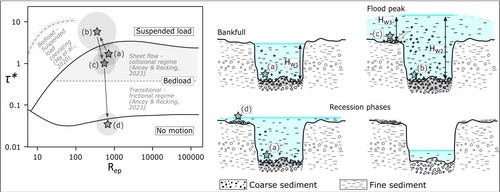
As bankfull conditions were approached, the energy within the channel increased significantly, resulting in the transport of riverbed gravels under intense bedload conditions (i.e. bedload Stage 3, sensu Carling, 1988). This mobilisation likely involved sheet flow, significant saltation phenomena (Bagnold, 1973; Chen, Bai, & Xu, 2017; Gao, 2008) and, in some instances, gravelly particles that were already being transported partially in suspension (Figure 6a; star (a) in Figure 8). Given that we are examining a gravel-bed river where the D84/D50 ratio of the riverbed sediments is approximately equal to 2 (see Section 4.1), we are in an appropriate context to apply the hydraulic criteria proposed by Church and Jakob (2020) for defining the potential occurrence of a Type 1 debris flood. This process is defined as an intense transport condition occurring in rivers and streams that involves the full mobilisation of the entire bed material through the exceedance of the critical shear stress threshold generated by intense hydro-meteorological events (Brenna et al., 2020; Church & Jakob, 2020). According to these and other authors (e.g. Palucis et al., 2018), a > 4 (where is the critical stress required to initiate movement of median bed particles) is necessary to trigger a Type 1 debris flood, but only > 6 and τ* > 8 are capable of inducing ‘damaging’ and ‘catastrophic’ debris floods, respectively. Even higher ratios, up to > 10 , have been reported in other works (e.g. Gao, 2008) to trigger similar phenomena. The specific for the study segment of the Misa River is not known and may vary significantly depending on the grain size distribution, relative roughness, structural arrangement of grains in the bed and slope (Lamb, Dietrich, & Venditti, 2008; Shvidchenko, Pender, & Hoey, 2001). In light of this, and considering the range of data reported in the literature (e.g. Church & Jakob, 2020; Mueller, Pitlick, & Nelson, 2005; Wilcock & Crowe, 2003), we cautiously selected a high value of 0.1 (Buffington & Montgomery, 1997). By dividing the ) values (Table 3) by this assumed value, we obtain a / ratio ranging from a minimum of 5 to a maximum of 40, with a median value of approximately 9. This indicates that, under bankfull conditions, the bed material at some, or likely many, of the study sites could be mobilised in the form of a debris flood type 1. Moreover, as highlighted by the position of the star (a) in Figure 8 relative to the domains defined in the Shields–Parker River Sedimentation Diagram by Ancey and Recking (2023), the high concentration of mobile particles and consistently elevated ) values well above the 0.4 threshold (Table 3) support the hypothesis that intense bedload transport occurred as sheet flow, dominated by a collisional contact regime among the moving particles.
As the flood wave progressed, hydrometric levels in the Misa River continued to rise, reaching maximum water depths. At the flood peak stage, represented in this study by HW2 values, one must consider an energetic water flow laden with fine sediment overriding a channel in ‘live bed’ conditions, a term introduced by Church and Jakob in 2020 to describe the dynamics of a riverbed during a debris flood in which all the alluvial particles are moving in the form of intense Stage 3 bedload (Carling, 1988). The increased flow density and viscosity induced by the suspension of abundant fine sediment, combined with the maximum water depths, generate a dimensionless shear stress capable of transporting a portion of the mobile medium-sized gravels in suspension within the water column (star (b) in Figure 8). The hypothesis that only a portion of these gravels was actually transported in suspension at the peak flow is supported by the version of the Shields–Parker River Sedimentation Diagram proposed by Ma et al. (2020). By integrating field and flume data, these authors identified a region of potential coexistence between bedload and suspended load (see their Figure 2b). Although their study focusses on fine-grained rivers (grain size smaller than 2 mm), the conditions they identified for the simultaneous occurrence of both transport mechanisms appear to be consistent with the dynamics of the medium gravels in the Misa River, in response to the dimensionless shear stresses that occurred at flood peak (Figure 8). The scenario under analysis may, at least locally and temporarily, align with the conditions described by Church and Jakob (2020), where a high-magnitude flood, given appropriate hydraulic conditions and grain size distributions, simultaneously induces a hyperconcentrated flow, or at least a flow with a very high amount fine particles in suspension together with some coarser gravelly clasts, overriding a debris flood.
As water carrying fine and coarse suspended sediments locally overflowed the channel and spread across the terraces, the sudden drop in flow depth from HW2 to HW3 led to a decrease in . Consequently, this decrease in shear stress triggered a rapid transition from suspension to bedload transport conditions for the gravels, which started moving in contact with the topographic surface in the direction of overflowing fluxes (star (c) in Figure 8). It is reasonable to infer that the movement of the gravelly material as bedload on such topographically high surfaces was of relatively short duration, coinciding with the flood peak, and preceding the lateral expansion of overflow waters onto the terrace. During this phase of transport, the gravels travelled distances ranging from a few tens of meters to a maximum of approximately 250 m across the terraces, as documented at sites S4, S9 and S11 (Figure 4). As the water level on the terraces receded, the flow was no longer competent to keep the coarse clasts moving and the deposition of the elongated gravelly lobes occurred (see star (d) in Figure 8). The sedimentological characteristics of the overbank deposits are consistent with this dynamic. The presence of clasts with their long a-axes oriented both parallel and transverse to the local flow direction and imbricated fabrics, along with the massive nature of the deposits, is indicative of high intensity but likely short-lived bedload transport conditions, followed by rapid deposition (Ballance, 1984; Brenna et al., 2020, 2024; Moss, 1972; Todd, 1996). This hypothesis can be generalised to most of the study sites investigated along the hilly sector of the river course, all of which are characterised by the presence of overbank coarse deposits (Figure 4).
Interestingly, the grain size parameters D50 and D84 of overbank deposits are moderately smaller than those measured for the material within the riverbed (Table 1 and Figure 5). This observation is consistent with the fact that only a portion of the bed material, specifically the medium-sized gravels, was entrained from the mobile bed and transported in suspension during the peak of the flood event (star (b) in Figure 8). Conversely, the coarser bed grains (e.g. coarse and very coarse gravels) continued to be transported as bedload within the active channel. Moreover, the scarcity of sandy and fine material within the analysed coarse sediment lobes (Figure 5) aligns with the described transport and deposition conditions. As the energy diminished to the point where it could no longer transport gravel onto the terraces (star (d) in Figure 8), finer materials likely continued to move, either as bedload or in suspension, leading to selective deposition (Paola et al., 1992) of the gravelly material. Meanwhile, fine materials were deposited in more distal portions on the terraces, resulting in the large sandy and muddy deposits observable in Figures 4f and 7.
5.3 Boundary conditions necessary for the occurrence of suspended transport of fluvial gravels
The mobility conditions discussed above are unusual compared to those typically described in the literature concerning bedload processes of coarse material in fluvial contexts (e.g. Church, 2006; Dey & Ali, 2019; Hajek & Edmonds, 2014; Magilligan, Buraas, & Renshaw, 2015; Moody & Meade, 2008). Suspended transport of coarse particles necessitates a level of flow energy that rarely occurs during floods in gravel-bed streams. Consequently, the occurrence of a high-magnitude hydrological event, capable of producing substantial runoff, is essential. This condition is satisfied by the characteristics of the September 2022 flood, induced by rainfall with return periods exceeding 1000 years in the study area (Boccanera et al., 2022; Morelli et al., 2023; Pulvirenti et al., 2023). However, the hydrological forcing represents a necessary but not sufficient condition for the occurrence of the transport processes illustrated in this study. Pitlick, Marr and Pizzuto (2013) conducted flume experiments to investigate the morphodynamic response of alluvial gravel-bed channels to floods theoretically capable of generating overbank flows. They demonstrated that any flow capable of imparting shear stresses exceeding the stability threshold of non-cohesive banks in channels that are free to laterally adjust will lead to bank erosion and channel widening. This widening allows the flow to be almost fully contained within the enlarged cross-sectional area of the active channel. Similarly, Church and Jakob (2020), discussing debris floods—a phenomenon likely occurring during the present event—stated that such occurrences typically induce channel instability, often resulting in channel widening. They illustrate this with the example of a reach of Cougar Creek in the town of Canmore, Alberta, which experienced a significant debris flood in June 2013, resulting in considerable channel widening (Jakob et al., 2017). Similar processes and related morphological responses have been documented in various gravelly streams following high-magnitude floods (e.g. Brenna et al., 2021, 2023; Rinaldi et al., 2016; Scorpio et al., 2018; Surian et al., 2016). In those cases, a remarkable widening of the active channels has been observed, with width ratios typically ranging from 2 to 5 up to values nearly 15–20 (Ruiz-Villanueva et al., 2023). In unconfined alluvial channels with predominantly non-cohesive banks, bank erosion and the associated widening of the river channel led to the dissipation of flow energy. Besides, channel widening implies a decrease in water depths and consequently lower shear stress values within the active channel (Figure 9). Under these conditions, the bed material is mobilised through typical transport mechanisms (Church, 2006), with the coarser gravelly fraction moving as bedload with varying rates within the active channel (Magilligan, Buraas, & Renshaw, 2015; Pitlick, Marr, & Pizzuto, 2013).
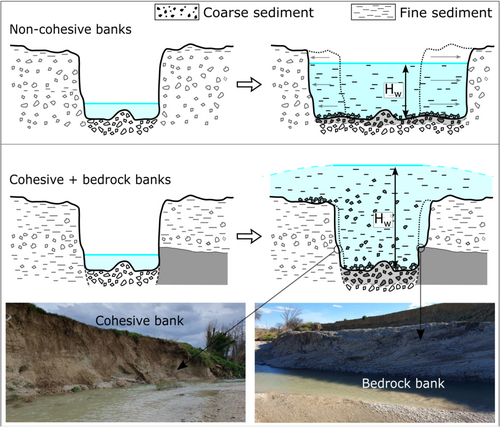
The lateral dynamics of river channels, particularly in response to flood events, can be notably constrained in the presence of erosion-resistant banks predominantly composed of cohesive sediments or bedrock (Konsoer et al., 2016; Pitlick, Marr, & Pizzuto, 2013; Pizzuto, O'Neal, & Stotts, 2010; Righini et al., 2017; Simon et al., 2000). At the study sites along the Misa River, the banks are primarily constituted of cohesive materials associated with mudstone bedrock, interspersed with limited gravelly strata (Table 1 and Figure 9). Consequently, it is reasonable to infer that these bank characteristics influenced the stream's response to the flood event resulting in a less pronounced widening, ranging from almost negligible (e.g. width ratio of 1.1 at site S26) to moderate (e.g. width ratio of 3.1 at site S25) at the study sites (Table 1), in comparison to a flood of similar magnitude in a context dominated by easily erodible banks. This hindered the dissipation of flow energy and prevented the full accommodation of water discharge within the active channel (Figure 9). Instead, remarkable increases in flow depths were observed during the hydrological event, leading to overflow and extensive inundation of the terraces, and in the generation of exceptionally high water depths (Table 1) and relative dimensionless shear stresses within the active channel, as shown in this study (Table 3). The magnitude of these water depth and shear stress values was further facilitated by the riverbed's pronounced incision, with superelevated banks separating the relatively narrow active channel from the terraces located several meters (up to approximately 6 m) above the riverbed. This morphological setting of the river is related to its glacial–interglacial Quaternary evolution (Calderoni et al., 2010; Coltorti, 1991) and to a recent phase of incision induced by anthropogenic sediment starvation as documented in several rivers of the Marche Region (Coltori, 1997). In summary, the occurrence of a high-magnitude flood within a laterally stable and entrenched channel represents an optimal condition for generating the morpho-sedimentary processes described herein.
From the perspective of bed material transport processes, entrenched channel and erosion-resistant banks facilitated the occurrence of debris flood—a relatively uncommon phenomenon—and also the partial entrainment and suspended transport of gravelly alluvial material comprising the riverbed (Figure 9). The well-established notion that sand constitutes a particle size fraction of bed material load, which in many rivers can be transported both as bedload and in suspension (Church, 2006), is thoroughly demonstrated by field data and laboratory experiments (e.g. Cantalice et al., 2013; García & Parker, 1991; Naqshband et al., 2014). In contrast, the phenomenon of bed gravel mobility in suspension, as discussed in this study, is a peculiar condition that has been scarcely explored in the literature, especially within real river systems. However, this is not the first time that the sedimentary products of similar processes have been observed. An illustrative example is provided by Magilligan, Buraas and Renshaw (2015), who investigated the effects of a high-magnitude flood induced by Tropical Storm Irene during the summer of 2011 in Vermont, USA. By analysing what they refer to as ‘extra-channel manifestations of the flood’, Magilligan et al. documented the formation of new stripping channels in the alluvial plain. These channels were subsequently partially filled with fluvial gravels ‘probably transported in suspension’, as no bank ramps connecting them to the river channel were identified.
5.4 Study limitations and future developments
Although the interpretations of the morpho-sedimentary dynamics that characterised the Misa River during the 2022 event are predominantly based on robust field data, certain limitations of our approach must be acknowledged. First, the physical characteristics of the flow are not precisely known, necessitating assumptions about the actual flow parameters, such as fluid densities and kinematic viscosities, during the 2022 event. Additionally, under overbank flow conditions with water flowing un-channelised over terraces (Figure 6c), factors such as flow directions, local slopes and terrain roughness may influence the results obtained. Furthermore, the Shields–Parker approach used in this study is notably simplified, as it was largely developed based on data obtained in laboratory experiments using straight flumes with a low width–depth ratio. In contrast, the geometry of the river analysed here exhibits a certain degree of sinuosity throughout the entire hill sector under investigation (see Figures 3 and 4). Regarding the overbank deposits located near bends, it is important to consider that complex, three-dimensional flow fields can arise at river bends, enhancing turbulence and further promoting sediment entrainment and transport (Blanckaert, 2018; Blanckaert & De Vriend, 2004; Engel & Rhoads, 2016; Ferguson et al., 2003). However, bends also result in greater energy dissipation, possibly leading to lower shear stress (Blanckaert, 2011). The effects of curvature-induced flow dynamics and related sediment transport processes are further complicated by overbank flows (Loveless et al., 2007), which played a critical role in driving the deposition of gravelly deposits in the study case at hand. In light of the above, it is important to acknowledge that the thresholds identified by Parker's approach and used in this study to distinguish between different transport mechanisms (Figure 6) carry a certain degree of uncertainty. Despite these limitations, we believe that the results of this pilot study are compelling and can serve as a basis for more refined analyses of these hitherto poorly recognised fluvial processes.
From a geomorphological perspective, it is beneficial to expand the analyses conducted thus far by providing a comprehensive characterisation of the case under consideration. This study exclusively focusses on the sector of the Misa River characterised by the presence of coarse overbank deposits, specifically targeting the study sites depicted in Figure 4. It would be valuable to broaden the spatial scope of the analyses by examining the headwater reach of the Misa River and the downstream sector extending beyond the confluence with the Nevola River (Figure 2). This expansion would likely enhance our understanding of the transport mechanisms and factors contributing to the formation of coarse overbank deposits in a specific section of the stream. Furthermore, a more comprehensive characterisation of all channel dynamics induced by the event would be beneficial, including a thorough definition of the widening processes and a detailed analysis of bank dynamics.
6 CONCLUSION
This pilot study builds on field evidence observed following the September 2022 flood event in the Misa River (Italy). Specifically, the discovery of gravelly deposits organised in lobes on terraces, several meters above the active riverbed, was considered potential evidence of unusual transport mechanisms impacting riverbed gravels during high-magnitude floods.
The combination of field evidence and results obtained through hydraulic calculations allows us to address the two main research objectives of this paper and draw conclusions. It appears that in response to high-magnitude floods, some of the gravel constituting bed material in gravel-bed streams may be transported in suspension within the water column. Such an unusual transport condition is probably relatively rare because it requires the occurrence of specific conditions to generate sufficient energy (i.e. shear stress) to maintain coarse sediment particles in suspension. Specifically, these conditions are the occurrence of (1) a high-magnitude flood laden with fine sediment, increasing fluid density and viscosity, affecting (2) an entrenched channel with erosion-resistant banks that limit widening in response to extreme floods.
If these processes coincide with the inundation of parts of the alluvial plain surrounding the channel, as observed in the Misa River, riverbed gravel material temporarily suspended may be transported and deposited on external surfaces, such as terraces, at significantly higher elevations than the riverbed. The morpho-sedimentary dynamics analysed and discussed here should be recognised as an important additional morphodynamic process and a potential hazard in gravel-bed rivers during intense flooding, with the capacity to (re)activate portions of the alluvial plain.
AUTHOR CONTRIBUTIONS
Andrea Brenna: conceptualisation, funding acquisition, methodology, investigation, writing—initial draft and writing—reviewing and editing. Vittoria Scorpio: conceptualisation, methodology, investigation and writing—reviewing and editing. Alvise Finotello: methodology, investigation and writing—reviewing and editing. Filippo Zarabara: methodology and investigation. Nicola Surian: conceptualisation, funding acquisition, methodology, supervision and writing—reviewing and editing.
ACKNOWLEDGEMENTS
This research was supported by funds from the Università degli Studi di Padova (DOR funds) and was undertaken as part of the Project ‘The Geosciences for Sustainable Development’ (CUP C93C23002690001). The authors thank Alessandro Di Marco for field survey assistance. We are grateful to the Editor, Associate Editor and reviewers whose comments improved the quality of the paper.
CONFLICT OF INTEREST STATEMENT
The authors declare that they have no known competing financial interests or personal relationships that could have appeared to influence the work reported in this paper.
Open Research
DATA AVAILABILITY STATEMENT
Most of the original data are included in the paper. Additional data will be made available by the authors on request.


