Parabolic dune distribution, morphology and activity during the last 20 000 years: A global overview
Abstract
Parabolic dunes form and migrate in almost every climate and geographic zones of the world, ranging from the tropical coastlines to the arid continental deserts. Despite their extensive distribution and their importance within the aeolian sediment landscape, the understanding of their morphological development, activity and link with climates remains somewhat limited to local or regional scales. A good understanding of the present climate conditions under which parabolic dunes are formed and/or reactivated would be significantly helpful to constrain past climate models. Similarly, an improved knowledge of parabolic dunes behaviour during past climatic episodes would provide some valuable long-term data to better predict their future activity. This review first aims at providing a non-exhaustive global database on parabolic dune morphology and the present wind regimes with which they are associated. To do so, the morphology of 750 dunes distributed worldwide was first analysed using a high-resolution global digital elevation model, suggesting an intrinsic relationship between the different measured morphoparameters. The analysis of the associated local wind regimes shows that parabolic dunes develop under strong unidirectional winds, which are more conspicuous in coastal than continental environments. Dunes of different ages are globally aligned with present prevailing winds, which suggests a prevalent control of long-term global atmospheric circulation on dune orientations. Finally, this study explores the link between parabolic dune activity and climates over the past 20 000 years by reviewing ages from the literature and combining them with the ones compiled in the INQUA Dunes Atlas Chronologic Database. Overall, it appears that changes towards drier conditions have triggered dunes migration during both warm and cold periods of the Last Glacial Maximum, Holocene Climate Optimum, Roman Climate Optimum, Medieval Climate Optimum and Little Ice Age. The present day aeolian activity is predominantly linked with deteriorating environmental conditions caused by human disturbances.
1 INTRODUCTION
Aeolian sediments represent a substantial part of the sedimentary accumulation in both continental and coastal environments. Parabolic dunes constitute an important sub-class of these aeolian deposits and develop over a wide range of climatic gradients (Goudie, 2011; Lancaster et al., 2016; Yan & Baas, 2015). They are defined by two trailing arms pointing upwind and enclosing a deflation basin that is terminated by a nose being the depositional lobe that points downwind (Hack, 1941; Jennings, 1957; Landsberg, 1956). The airflow is first channelled within the arms, resulting in an increase in shear stress and thus in sediment transport above the deflation basin (Figure 1; Hansen et al., 2009; Hesp & Hyde, 1996). It then reaches the stoss slope of the depositional lobe where it gets compressed and accelerated, passes over the crest of the nose where the flow expands and slows down, losing its transport capacity (Walker & Hesp, 2013; Walker & Nickling, 2002). The deceleration causes grainfall deposition on the lee slope of the nose, forming grainfall lamination (i.e., foresests), which alternates with sandflow cross-stratification forming when the angle of repose (~30°) is reached and sand avalanches on the dune slipface (Bagnold, 1936, 1941; Hunter, 1977, 1980, 1985).
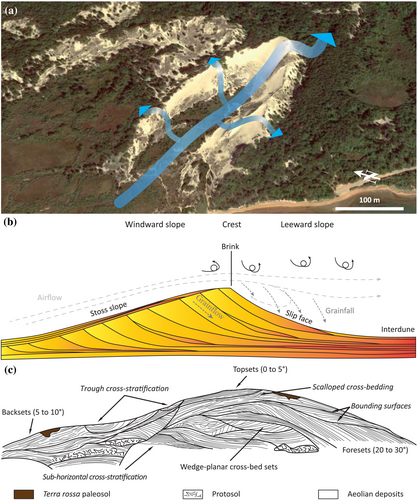
Contrary to other types of highly mobile dunes (e.g., barkhans), parabolic dunes often form localised dune fields arranged in belts along coastlines, inland rivers, and lakes shores (Yan & Baas, 2015). Anthropogenic activities (e.g., poor land use) and the projected increase in drought severity and loss of vegetation associated with climate change raises some concerns about the potential reactivation of dunes. A resumed migration of these landforms may exacerbate the desertification caused by modification of precipitation regimes together with a coeval rise of surface temperatures (Mirzabaev et al., 2019). Aridification is now known to cause systemic and abrupt changes in ecosystems (Berdugo et al., 2020), which makes the presently-stabilised state of parabolic dunes even more precarious. Like other types of dunes, they are known to be useful to humans in many ways. They perform their function of sand storage, sometimes contain large reserves of groundwater, and act as a shelter for wildlife and endemic plant species, favouring the general sustainability of ecosystems (Kellerlynn, 2012; Pye & Tsoar, 2008). The development of the Great Barrier Reef made possible by the formation of coastal parabolic dunes on Fraser Island is one striking example of their essential role (Ellerton et al., 2022). Coastal parabolic dunes are also natural and aesthetic recreation areas that provide protection against sea level rise, tsunamis, storm surges, and floods (Gares et al., 1979; Psuty & Rohr, 2000). These hazards are likely to grow stronger and more frequent under the influence of the current global warming (IPCC, 2013), hence the necessity to understand and preserve coastal dunes.
This study aims at providing a comprehensive review of parabolic dunes locations, physical characteristics, formation and evolution, as well as exploring the Late Pleistocene–Holocene (last 20 ka BP) climate and atmospheric processes controlling their long-term activity. Such contribution will hopefully provide an exploitable framework for future research on these landforms.
1.1 Morphology
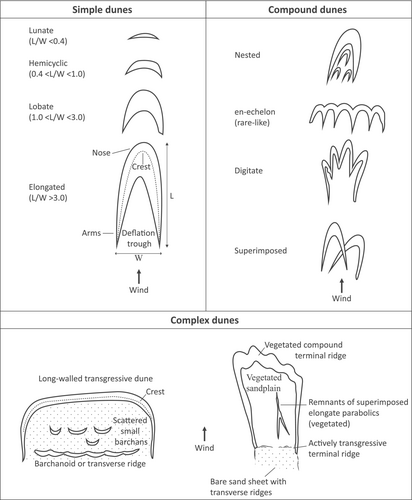
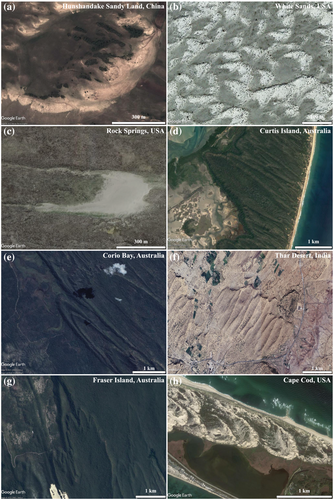
Parabolic dunes show a great diversity of morphologies (Goudie, 2011; Scheffers et al., 2008) that depend on wind regime, sediment supply, sediment availability, and local vegetation characteristics. Several attempts have been made to establish a classification that would be globally applicable. McKee (1979) recognised three main classes of dunes: simple, compound and complex (Figure 2). Simple dunes are defined as single and isolated forms that are subclassified in lunate, hemicyclic, lobate and elongated based on their length/width ratio (Figure 3a–d; Pye, 1993). The elongated parabolic dunes are the largest and can reach several kilometres in length. They are usually referred to as hairpin or U- to V-shaped dunes with long-walled arms and a prominent high nose that form under strong, unidirectional winds. Compound dunes consist of merged and/or superimposed smaller dunes that may occur in clusters. Their planform geometries go from simple nested and superimposed (Figure 3e,h) forms to rarer and more complex en echelon or digitate ones (Figure 3f,g). They usually develop under wind regimes that present a greater directional variability, or where a dense and resistant vegetation cover like woodlands has developed. The trees force the airflow to separate in divergent directions, resulting in digitate parabolic dunes for instance. Finally, complex dunes are composed by two or more different types of dunes. As a rule of thumb, reduced sediment supply will likely lead to the formation of rather low-lying, unfilled parabolic dunes with narrow heads (Hesp, 2011). On the contrary, elevated, long-walled parabolic dunes with large noses and partially-infilled deflation basins develop in areas of great sediment supply (Pye, 1982, 1983). The rate at which the depositional lobe is colonised by vegetation also seems to influence the shape of the dunes (Barchyn & Hugenholtz, 2012a, 2012b; Durán & Herrmann, 2006; Durán & Moore, 2013). Large, U-shaped noses are rapidly revegetated whereas narrow, V-shaped ones tend to be gradually fixated (Cooke et al., 1993). Long-term variations in wind directions may lead to a left- or right-handed asymmetry in dune morphology through time. Short-term changes such as seasonal directionality generally result in smaller and broader shapes with short trailing arms (e.g., hemicyclic). Some of these smaller dunes may be closed upwind by a back ridge such as the ones in the Canadian prairies of Saskatchewan (Wolfe & David, 1997; Wolfe & Hugenholtz, 2009).
1.2 Distribution
Parabolic dunes build up both in coastal and continental settings as soon as there is sufficient wind power, sand supply, and sand availability, the latest usually being associated with a moderate vegetation cover (Baas & Nield, 2007; Halfen et al., 2016). Parabolic dunes preferably develop along coastlines of sub-humid to humid zones where they are usually found adjacent to river mouths or estuaries, and in conjunction with foredunes (Hesp, 2011). It is believed that a great proportion evolve from blowouts initiating in such foredunes (Barchyn & Hugenholtz, 2012a, 2012b; Durán & Herrmann, 2006; Durán & Moore, 2013; Hanoch et al., 2018; Reitz et al., 2010), as simulated by the Extended Discrete Eco-geomorphic Aeolian Landscape (DECAL) model (Nield & Baas, 2008a). Blowout formation usually initiates when unidirectional onshore winds breach the vegetation cover (Barchyn & Hugenholtz, 2013a; Ellerton et al., 2018; Gutiérrez-Elorza et al., 2005; Hesp, 2002; Hesp & Hyde, 1996; McKenna, 2007; Smyth et al., 2014). Because of the high transport potential and the relative abondance of sediment, most of the largest (i.e., elongated) parabolic dunes are found in such costal environments. Some perennial or ephemeral lakes can sometimes flood the deflation basins within these elongated dunes such as the ones on the coast of Queensland in Australia (Levin, 2011; Pye, 1982).
Most of the inland parabolic dunes are distributed in the semi-arid to arid regions (Vimpere, Watkins, & Castelltort, 2021; Yan & Baas, 2015) of the Great Plains of North America, the Thar desert in India, and the northern part of mainland China (see Appendix S1 for references). The dunes are found in river valleys and along lake margins where they develop out of the fluvial and lacustrine sandy material, usually at the margin of dune fields (e.g., Kellerlynn, 2012; Marín et al., 2005; Muhs et al., 1996). Contrary to their coastal counterparts, these regions present a sparse, low-ling vegetation cover enabling dunes to migrate farther from their source of sediment. As such, transformation of barkhan or transverse dunes into parabolic dunes has been observed occurring mostly in continental settings when they start to migrate into a more densely vegetated area (Anthonsen et al., 1996; Barchyn & Hugenholtz, 2012b; Hanoch et al., 2018; Reitz et al., 2010; Tsoar & Blumberg, 2002). In the case of barkhan dunes, vegetation starts by colonising and anchoring the horns whilst the remaining bare lobe keeps on migrating (Durán et al., 2008; Durán & Herrmann, 2006), as simulated by a continuous model and the Extended Discrete Eco-geomorphic Aeolian Landscape model (i.e., Extended-DECAL; Baas & Nield, 2007; Nield & Baas, 2008a, 2008b; Yan & Baas, 2017). In general, both sediment supply and wind energy are lower in continental interiors with respect to coastal areas (https://globalwindatlas.info/fr). Consequently, inland parabolic dunes tend to be smaller with low-relief arms with respect to their coastal counterparts (Goudie, 2011). Some following migrating dunes usually override the arms of the dune ahead, thus preventing the formation of elongated dunes and favouring the development of compound forms (e.g., Hanford, WA, USA; Barchyn & Hugenholtz, 2015; Gaylord & Stetler, 1994; Stetler & Gaylord, 1996).
1.3 Favourable climate
Given their vegetated nature, parabolic dunes are strongly controlled by eco-geomorphic interactions (Baas & Nield, 2007; Durán et al., 2008; Durán & Herrmann, 2006; Durán & Moore, 2013; Nield & Baas, 2008a, 2008b; Yan & Baas, 2017). A low mobility and stabilisation of dunes occurs when climate conditions are favourable for the expansion of vegetation, whereas a high mobility ensues a change towards deteriorating vegetation conditions (Lancaster & Helm, 2000). This remains valid if there is sufficient sediment supply and wind energy to enable the transport of sand (Halfen et al., 2016). A complex framework of environmental factors controls the formation and development of parabolic dunes such as: lake or river water table level fluctuations (e.g., Lake Michigan, USA: Arbogast et al., 2010, Arbogast et al., 2002; Hansen et al., 2010; Lepczyk & Arbogast, 2005; Lichter, 1995; Snake River Plain, Idaho, USA: Forman & Pierson, 2003), groundwater level (e.g., Maputaland Coastal Plain, South Africa: Porat & Botha, 2008), variations of wind regime or sediment supply (e.g., Hesp, 2002; Central Sand Plain, Wisconsin, USA: Rawling et al., 2008; Ceará Stata, Brazil: Tsoar et al., 2009; São Francisco do Sul, Brazil: Zular et al., 2013), precipitation (e.g., St. Anthony Dune Field, Idaho, USA: Hoover, Gaylord, & Cooper, 2018; SW Kalahari, South Africa: Lancaster, 1988; Britain and Denmark: Landsberg, 1956; Hanford, Washington, USA: Stetler & Gaylord, 1996), temperature (e.g., Southern Canadian Prairies: Wolfe & Hugenholtz, 2009), wildfires (e.g., Hudson Bay, Québec, Canada: Filion & Morisset, 1983), droughts (e.g., Great Plains of North America: Forman et al., 2001, 2005; Western Pampas, Argentina: Tripaldi et al., 2013), and more recently anthropogenic factors. The latter include a reduction of the vegetation cover through trampling (e.g., La Mancha, Veracruz State, Mexico: Hesp et al., 2010), deforestation for charcoal production and slash-and-burn agriculture (e.g., Lake Alstern, Sweden: Alexanderson & Fabel, 2015; European Sand Belt: Lungershausen et al., 2018; Cooloola Sand Mass, Queensland, Australia: Ellerton et al., 2018), intense animal grazing (e.g., Sevier desert, Utah, USA: Barchyn & Hugenholtz, 2013b; Aquitain Basin, France: Bertran et al., 2011; Israel: Tsoar & Blumberg, 2002; Yizhaq et al., 2007; Thar desert, India: Srivastava et al., 2019; Northern China deserts: Mason et al., 2009), intensive agriculture (e.g., Western Pampas, Argentina: Tripaldi et al., 2013; Israel: Tsoar & Blumberg, 2002; Northern China deserts: Guo et al., 2018; Sun, 2000), and a combination of all of the aforementioned activities (e.g., Naikoon Peninsula, British Columbia, Canada: Wolfe et al., 2008; Elbow Sand Hills, Northern Great Plains, Canada: Wolfe, Hugenholtz, et al., 2007; Manawatu dune field, New Zealand: Hesp, 2001).
In coastal settings, more factors affect parabolic dune evolution and the associated stabilising vegetation. For instance, a transgressive sea level cuts through the vegetation cover and induces coastal erosion, which eventually supplies sediment for parabolic dunes to form (Mozambique Coastal Plain: Armitage et al., 2006; Belgian Coastal Plain: De Ceunynck, 1985; Ramsay Bay, Queensland, Australia: Pye & Rhodes, 1985; Cape Bedford and Flattery, Queensland, Australia: Pye & Switsur, 1981; Groote Eylandt, Northern Territory, Australia: Shulmeister & Lees, 1992; Cooloola, Queensland, Australia: Tejan-Kella et al., 1990; Naikoon Peninsula, British Columbia, Canada: Wolfe et al., 2008). Increased storminess is characterised by stronger winds, higher wind gust speeds, and a greater wave energy, which are all factors reducing the vegetation cover and thereby, potentially triggering the formation and migration of parabolic dunes (Denmark coast: Clemmensen et al., 2007, Clemmensen et al., 2001; Lake Michigan, USA: Hansen et al., 2010).
2 METHODS
2.1 Morphology
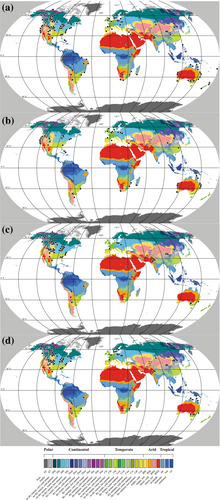
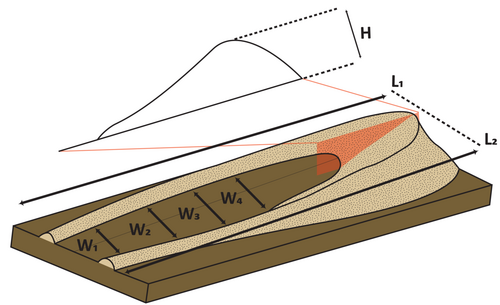
Parabolic dune fields were located by using satellite images and reviewing the literature on these bedforms whilst their geomorphological characteristics were measured using Digital Elevation Models (DEMs). The DEMs were collected either from national mapping agencies (e.g., AHN in the Netherlands) or from the Tandem-X WorldDEM (Wessel et al., 2018), and their absolute (i.e., fundamental) accuracy compiled in the Appendix S2. A total of 750 parabolic dunes located in 22 countries (Figure 4 and Appendix S3) were investigated, of which 362 and 388 classify as coastal and inland dunes, respectively. The length, width, and height were measured following the standardised method described by Yan and Baas (Yan & Baas, 2017; Figure 5) as follows: length (L) expresses the mean longitudinal distance between the front of the dune apex and the tips of the arms; width (W) is the average of at least four measurements from crest to crest between the tips of the arms and the lobe; and height (H) is defined as the difference of altitude between the highest point of the dune apex and the base of the dune. The latter represents the terrain surface that was generated by computing sample elevations along the perimeter of the dune. This method precludes potential bias from older reliefs forming dune substrates. A total of 1433 orientation measurements indicating the direction towards which the dune noses are pointing were compiled (Figure 4 and Appendix S4), of which 750 were measured for this study and 683 were retrieved from the INQUA Dunes Atlas Chronologic Database (Lancaster et al., 2016; https://www.dri.edu/inquadunesatlas/).
2.2 Wind regimes
The sand drift potential analysis was performed according to the method described by Kilibarda & Kilibarda (2016), which is a slightly modified version of the Fryberger method (Fryberger & Dean, 1979). The drift potential (DP), resultant drift potential (RDP), the resultant drift direction (RDD), and the ratio between the two (RDP/DP), were calculated according to this methodology (Appendices S3 and S4) and applied to the hourly wind speed and direction data at 10 m.a.s.l. provided with a grid cell size of 0.5°×0.5° by the NASA Prediction of Worldwide Energy Resource (POWER) Project database (https://power.larc.nasa.gov/), based upon a single assimilation model merging the MERRA-2 and the GEOS 5.12.4 products (Stackhouse et al., 2018). The data, which cover a period of 30 years between 1 January 1990 and 1 January 2020, enable statistical calculations to establish how often and by how much wind is blowing above the impact threshold shear velocity, set at 11 knots (Fryberger & Dean, 1979). This value represents the lower limit, under dry conditions, at which saltation of quartz grains initiates (Bagnold, 1936, 1941).
2.3 Dune accumulation chronology
The dune accumulation chronology database combines the parabolic dune ages retrieved from the 88 publications compiled in the INQUA Dunes Atlas Chronologic Database (Lancaster et al., 2016; https://www.dri.edu/inquadunesatlas/), and from 183 other publications reviewed for this study (see Appendix S1 for references). A total of 1145 ages were collected, 780 from the INQUA database and 365 gathered for this study, among which 181 14C ages and 963 luminescence ages. The latter include 123 thermoluminescence (TL), 129 infrared stimulated luminescence (IRSL), and 711 optically stimulated luminescence ages (OSL).
Ages interpreted by the authors as corresponding to a period of dune stabilisation were rejected, which left 762 ages from the INQUA database and 223 new ages for a total of 985 ages linked with a period of sand accumulation (i.e., dune build up or remobilisation; Figure 4). Among them, 92 are 14C ages and 893 are luminescence ages, which include 112 TL, 129 IRSL and 652 OSL ages. Because of the higher density of available ages and climate proxies for the Late Quaternary, 878 ages from the last 20 000 years BP were retained to discuss recent parabolic dune activity with respect to global climate trends (Figure 4 and Appendix S5). Among them, 668 were from the INQUA database and 210 were new ages collected for this study. These include 91 14C ages and 787 luminescence ages, of which 92 TL, 124 IRSL, and 572 OSL ages.
3 RESULTS
3.1 Morphology
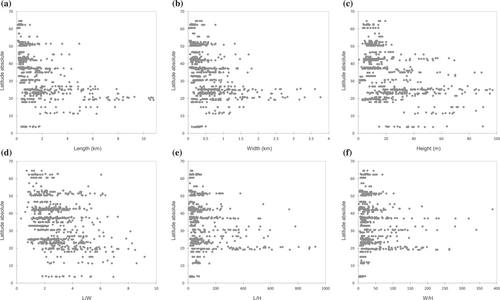
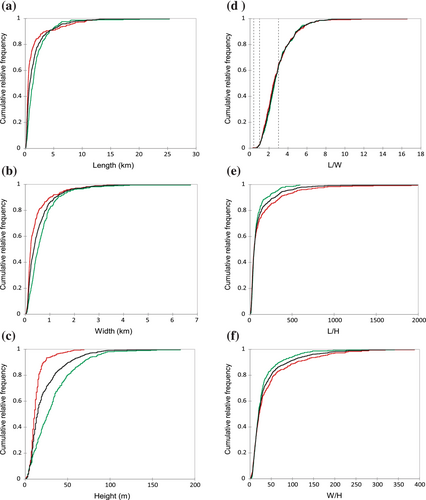
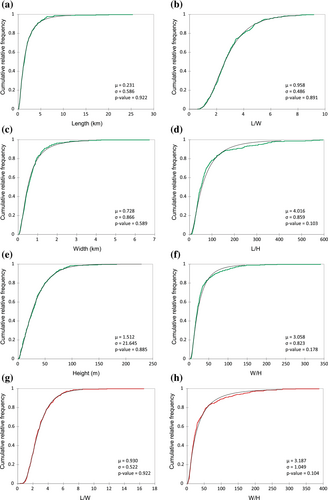
Overall, parabolic dunes tend to be smaller (i.e., lower L, W and H) and more compact (i.e., lower L/W, L/H and W/H) when located in higher latitudes (Figure 6). Size of parabolic dunes varies greatly from one location to the other and within the same area but are on average few hundred meters to few kilometres long, few hundred meters wide and a dozen meters high (Table 1). Cumulative frequency distributions of the different morphoparameters (Figure 7) show that coastal dunes tend to be longer, wider, and taller whereas inland dunes are generally flatter (i.e., higher L/H and W/H). However, both categories show the same distribution of elongation (i.e., L/W). Fourteen therotical distribution functions were computed for each parameter and their correlation with the empirical distributions assessed with a Kolmogorov–Smirnov test. Coastal dunes morphological characteristics can be described by log-normal distributions whereas it is only the case for the L/W and W/H ratios of inland dunes (Figure 8). The Kruskal–Wallis test indicates that coastal and inland parabolic dunes come from two distinct populations when comparing the variables L, W and H whereas no significant statistical difference in L/W, L/H, W/H can be observed between the two groups (supporting information). As such, the 90th percentiles of the variables (Table 1) are interlinked following linear relationships (Figure 9).
| Nbr. of observations | Min. | Max. | 1st Quartile | Median | 3rd Quartile | 90%tile | Mean | SD (n) | |
|---|---|---|---|---|---|---|---|---|---|
| L all (km) | 750 | 0.055 | 25.320 | 0.392 | 0.789 | 1.875 | 4.159 | 1.689 | 2.425 |
| L|coastal (km) | 362 | 0.097 | 25.320 | 0.653 | 1.372 | 2.363 | 4.216 | 1.976 | 2.419 |
| L|inland (km) | 388 | 0.055 | 13.874 | 0.325 | 0.517 | 1.133 | 3.354 | 1.422 | 2.399 |
| W all (km) | 750 | 0.029 | 6.725 | 0.169 | 0.350 | 0.711 | 1.224 | 0.554 | 0.626 |
| W|coastal (km) | 362 | 0.044 | 6.725 | 0.289 | 0.512 | 0.881 | 1.327 | 0.689 | 0.679 |
| W|inland (km) | 388 | 0.029 | 3.765 | 0.140 | 0.220 | 0.467 | 0.999 | 0.428 | 0.543 |
| H all (m) | 750 | 0.46 | 183.00 | 9.00 | 14.21 | 29.98 | 51.10 | 22.53 | 21.89 |
| H|coastal (m) | 362 | 1.00 | 183.00 | 13.00 | 27.00 | 44.75 | 67.95 | 32.51 | 26.49 |
| H|inland (m) | 388 | 0.46 | 69.37 | 8.00 | 11.00 | 15.00 | 21.24 | 13.23 | 9.58 |
| L/W all | 750 | 0.3 | 16.5 | 1.8 | 2.5 | 3.6 | 4.9 | 2.9 | 1.6 |
| L/W coastal | 362 | 0.6 | 9.2 | 1.9 | 2.6 | 3.5 | 4.8 | 2.9 | 1.5 |
| L/W| inland | 388 | 0.3 | 16.5 | 1.8 | 2.5 | 3.6 | 5.0 | 2.9 | 1.7 |
| L/H all | 750 | 3.5 | 2941.3 | 28.0 | 49.0 | 106.2 | 290.5 | 114.8 | 219.6 |
| L/H| coastal | 362 | 7.6 | 595.7 | 31.0 | 51.4 | 89.6 | 193.0 | 84.2 | 96.9 |
| L/H| inland | 388 | 3.5 | 2941.3 | 26.2 | 48.2 | 131.8 | 355.4 | 143.3 | 287.7 |
| W/H all | 750 | 1.3 | 387.8 | 11.8 | 20.4 | 40.4 | 88.7 | 37.2 | 47.1 |
| W/H| coastal | 362 | 3.1 | 341.0 | 12.1 | 19.9 | 33.0 | 67.6 | 31.2 | 35.5 |
| W/H| inland. | 388 | 1.3 | 387.8 | 11.6 | 21.7 | 48.2 | 108.5 | 42.9 | 55.2 |
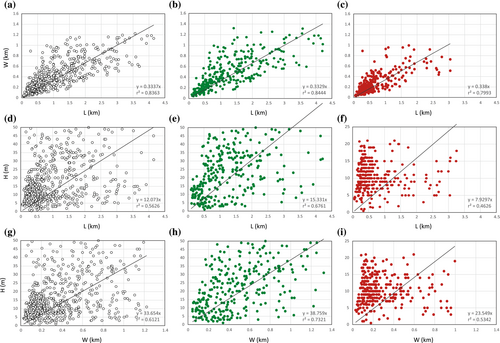
3.2 Wind regimes
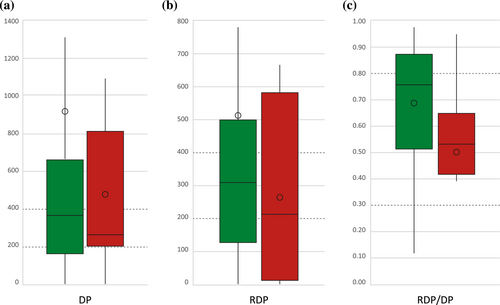
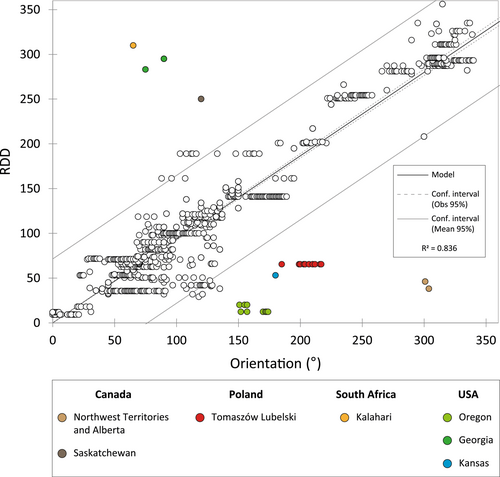
The sand drift potential analysis reveals that 74.8% of parabolic dunes lie in areas exposed to winds of intermediate/high energy whilst 87.8% of them form under winds with intermediate/low direction variability (Table 2). Overall, coastal parabolic dunes tend to develop under more unidirectional wind regimes presenting a higher RDP than in continental settings (Figure 10). Larger and flatter (i.e., more elongated and low-lying) dunes develop under winds with higher DP and RDP although it seems the latter has less influence on the overall morphology (Figure 11). Contrary, higher and hillier parabolic dunes are found where more unidirectional winds prevail although the direction variability of winds appears to have little to no influence on absolute dunes length and width. A linear relationship characterises the dunes orientation and the present day RDD (Figure 12), accounting for 83.6% of the data variability.
| All dunes | Coastal dunes | Inland dunes | |
|---|---|---|---|
| Wind energy | |||
| Low (DP < 200 vu) | 23.6 | 30.1 | 17.5 |
| Intermediate (200 < DP < 400 vu) | 30.8 | 23.5 | 37.6 |
| High (DP > 400 vu) | 44.0 | 46.4 | 41.8 |
| Wind direction variability | |||
| High (RDP/DP < 0.3) | 10.5 | 4.1 | 16.5 |
| Intermediate (0.3 < RDP/DP < 0.8) | 54.9 | 52.5 | 57.2 |
| Low (RDP/DP > 0.8) | 32.9 | 43.4 | 23.2 |

4 DISCUSSION
4.1 Parabolic dunes morphology and wind regimes
The distribution of morphoparameters and the correlation between them, expressed as the different ratios, reflect the boundary conditions for parabolic dunes to form and develop (Figures 7-9). These morphological thresholds are statistically even more relevant considering the broad variety of ages, sedimentological environments, and climate conditions under which the measured parabolic dunes developed. Larger bedforms are found in coastal environments (Figure 7) where a denser vegetation, stronger winds, and greater sediment supply constitute favourable conditions for parabolic dunes to form (Pye & Tsoar, 2008). Sand drift potential analysis indicates that present-day coastal wind regimes under which parabolic dunes develop tend to be more unidirectional and with a higher capacity to move sediments (i.e., RDP) than in a continental setting (Figure 10).
The interaction between dune morphology and wind characteristics has already been investigated in the past, such as the aspect ratio of dunes influencing wind flow pattern (i.e., H/L; Jackson & Hunt, 1975; Lancaster, 1994; Walker & Nickling, 2002) or the erodibility of coastal foredunes when exposed to storms (i.e., H/W; Itzkin et al., 2020). In this case, the sand drift potential analysis ties parabolic dunes to environments with highly energetic unidirectional winds (Table 2). However, the Spearman correlation analysis shows no statistically significant relationship between the measured morphoparameters and the Fryberger variables (supporting information). This supports the idea of a somewhat interdependence between morphological attributes (Figure 9) with no or little influence of the environment as soon as it presents the necessary boundary conditions for parabolic dunes to form. Nonetheless, the general trends shown by box plots suggest an empirical relationship between wind regime characteristics and the dunes roughness (Figure 11). Where multidirectional strong winds prevail, parabolic dunes are smoother although the absence of a stochastic relationship precludes any causal link between the two.
In reality, a complex framework of interrelated factors influence parabolic dunes morphology such as temperature, precipitation amount and annual distribution, groundwater level variations, wind regime, snow cover, plant colonisation velocity, vegetation roughness, climate changes amplitudes and rates, the nature and number of re-activation phases or cycles (e.g., Baas & Nield, 2010; David et al., 1999; Durán & Herrmann, 2006; García-Romero et al., 2019; Guan et al., 2017; Hanoch et al., 2018; Hesp & Smyth, 2019; Hesp & Walker, 2013; Hoover et al., 2018; Hugenholtz & Wolfe, 2005; Pye, 1993). Some authors also suggested a correlation between grain size and dune shape/size, with coarse and poorly sorted sand tendentially constituting the broad and low forms (Anton & Vincent, 1986; Arens et al., 2004; Pye & Tsoar, 2008; Yan & Baas, 2015). This study could not account for all these variables at a global scale but rather attempts at contributing to the quantification of simple relationships easily and quickly applicable to most of parabolic dunes.
4.2 Dune orientations and global atmospheric circulation patterns
Most of the measured dunes are aligned with the resultant drift direction (i.e., RDD) of present-day winds despite varying in age (Figure 12), which either suggest that winds have not significantly changed since the formation of the oldest dunes, or that they constantly realign with dominant wind direction during episodes of sand transport. In both cases, dunes showing orientations diverging from present winds RDD can be used to reconstruct palaeowinds prevailing direction given a good and consistent dating of the periods of activity (e.g., Arbogast et al., 2015; Carver & Brook, 1989; Gavrilov et al., 2018; Mackenzie, 1964; Markewich et al., 2009; Mason et al., 2011; Wolfe et al., 2004). This assumption remains valid if uncertainties related to wind regime analysis, resulting from orographic effects or data bias induced by wind speed and direction sampling (Pearce & Walker, 2005; Yizhaq, Xu, & Ashkenazy, 2020; Zurański, 1992), are negligible. For example, a different prevailing wind direction at the time of deposition is suspected to be the source of the bias observed for some dunes in Canada (e.g., Stokes et al., 1997; Wolfe et al., 2004); Georgia, USA (e.g., Carver & Brook, 1989); and Poland (Figure 12). The dune orientations diverhing from the local RDD of present-day winds in Oregon, USA, could be due to either the proximity of mountains with the shoreline and the subsequent topographic influence on wind, or a data bias due to greater uncertainties within the models or the algorithms used to process wind speed and direction. In such areas with a strong orographic effect, the resolution the 0.5°×0.5° grid of the POWER Release-8 database may be insufficient for representative local wind modelling.
Atmospheric circulation is defined as the large-scale movement of air within the atmosphere resulting from the combination of the Coriolis effect, caused by the rotation of the Earth, and the inequal distribution of surficial thermal energy. As a result, westerlies and easterlies blow within the mid-latitude Ferrel cells and low-latitude Hadley cells, respectively (Lutgens & Tarbuck, 2001). In general, dunes align with the present global circulation pattern, regardless of their age (Figure 13), which likely suggests a prevalent control of long-term atmospheric circulation on parabolic dunes orientations over short-term variations in local wind direction. As such, parabolic dunes can potentially entomb cyclic changes in atmospheric cells if no substantial remobilisation occurs afterwards (e.g., Rendall et al., 2022; Vimpere et al., 2022). Indeed, the different atmospheric cells are known to contract or expand and shift position in response to interglacial/glacial cycles. During warmer periods for instance, the Hadley cell is believed to broaden whilst shifting poleward (Gastineau et al., 2009; Lu et al., 2007; Vallis et al., 2015).

4.3 Parabolic dune activity during the last 20 000 years
4.3.1 North America
On the North American continent, the earliest period of major aeolian activity recorded by OSL ages occurred during the Late Pleistocene (e.g., Halfen et al., 2016), more specifically during the cold/arid LGM, Younger Dryas, and the associated deglaciation stages. Aeolian landforms mostly built up from glaciofluvial and glaciolacustrine sediments in high latitudes (e.g., David, 1977; David et al., 1999; Miao et al., 2010; Rawling et al., 2008; Wolfe et al., 2000, 2006) whereas sediment supply in the central and southern part of the continent mostly originated from fluvial sources (e.g., Ivester et al., 2001; Leigh et al., 2004).
In the Canadian prairies and in Alaska (Figure 14a), parabolic dunes first developed at 16 ka BP under an ice-proximal tundra setting along the southern margins of the Laurentide and Cordilleran ice sheets (Figure 15) that gave way to a grassland setting as ice sheets were melting and sediment supply/availability increased (Dyke et al., 2003; Reuther et al., 2016; Wolfe et al., 2004). Dunes orientation and location record the progressive northward migration of the ice sheets southern limit and the evolution of associated wind regimes (Wolfe, Paulen, et al., 2007). Winds first blew from the WNW under the influence of the Pacific air mass (16–11 ka BP) and then changed into anticyclonic and katabatic winds towards the SE over and along the margins of the retreating Laurentide Ice Sheet (11–9 ka BP), which corresponds to progressive termination of parabolic dune activity. The period after 9 ka BP marks the latest stabilisation of dunes with the change towards a boreal forest setting and a reduced transport capacity of wind (Wolfe et al., 2004).
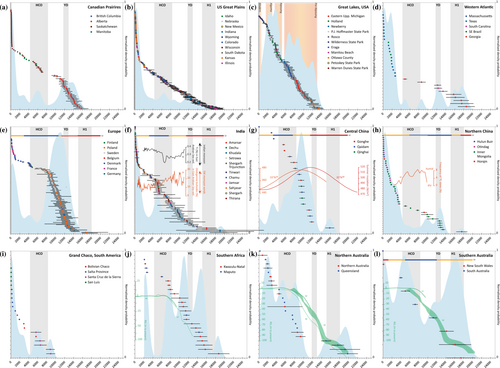
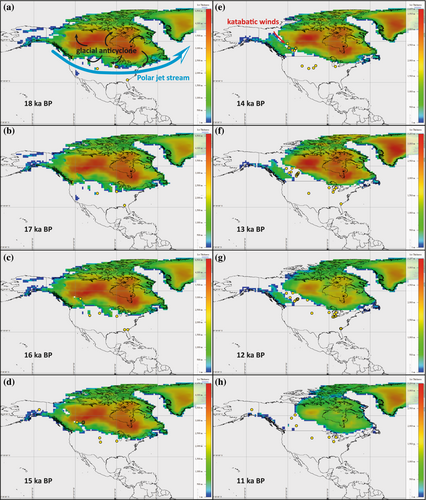
In the Great Plains of the USA (Figure 14b), a combination of lower temperature, growing season length, diminished precipitation, and lower atmospheric CO2 is likely to have triggered the Late Pleistocene (16–11 ka BP) aeolian activity (Mason et al., 2011). Climatic modelling indicates that the LGM was cold and dry (e.g., Bartlein et al., 1998; Bromwich et al., 2004; Kim et al., 2008; Kutzbach & Guetter, 1986; Shinn et al., 2003) whilst the moisture stress induced by low atmospheric CO2 favoured open vegetation and low tree cover, which is supported by pollen data (Cowling & Sykes, 1999; Loehle, 2007; Prentice & Harrison, 2009; Williams, 2003; Williams et al., 2000). Dune orientations advocate for a resultant wind direction from the NW with a protracted dominant influence of the Pacific air mass over the anticyclonic circulation over the Laurentide ice sheet in the north (Mason et al., 2011). Similar interpretations on the aridity, vegetation and wind regimes have been made for the southern latitudes and the eastern coastal plains of the USA (Figure 14d) to explain Late Pleistocene extensive parabolic dunes development (Ivester et al., 2001; Leigh et al., 2004; Markewich et al., 2009; Swezey et al., 2013). The cold climate during the LGM, together with a less dense vegetation and strengthened winds caused by the southward displacement of the Polar Jet Stream (Bartlein et al., 1998; COHMAP Members, 1988), likely provided the ideal conditions for parabolic dune build up. Such conditions were reinforced by a lower sea level and cooler sea surface temperatures, which would have hindered moisture transport (i.e., precipitation) towards the distant dune fields (Bartlein et al., 1998; Forman et al., 1995). Although peaks of parabolic dune activity coincides with enhanced sediment supply from rivers linked with the melting Heinrich event 1 (H1), or the abrupt return towards dry and cold conditions during the Younger Dryas (YD), it appears to be limited to few isolated dune fields (Swezey et al., 2013).
In the Great Lakes region of the USA, parabolic dune formation and reactivation correlate with the successive transgressions of the various lakes in the Lake Michigan basin (Hansen et al., 2010 and references herein). The first records indicate an initial phase of dune development (i.e., Pre-Nipissing) around 13.5 BP (Figure 14c), which coincides with the melting of the Laurentide ice sheet (Figure 15). It corresponds to a low-water stage following the merging of Glacial Lake Chicago with Glacial Lake Algonquin (Colgan et al., 2017; Tague, 1946) as ice retreated north, thus exposing glaciolacustrine sediments to strong winds in a region with a scarce vegetation cover. A short period of stabilisation or reduced aeolian activity occurred at the end of the YD when climate shift from cool/dry to warmer/wetter conditions (Colgan et al., 2017).
The subsequent episodes of aeolian sedimentation over North America during the Holocene are much reduced and concentrate over the Holocene Climate Optimum (HCO; ~8–4.5 ka BP) arid interval and successive late Holocene (>3.5 ka BP) droughts (e.g., Arbogast, 1996; Arbogast et al., 2010; Arbogast & Packman, 2004; Baldauf et al., 2019; Carcaillet et al., 2006; Forman et al., 2008; Forman et al., 1992; Forman & Maat, 1990; Forman et al., 2001; Forman & Pierson, 2003; Halfen et al., 2012; Halfen et al., 2010; Halfen et al., 2016; Madole, 1995; Mason et al., 2011; Miao et al., 2007; Stokes & Gaylord, 1993; Wolfe et al., 2001; Wolfe, Huntley, & Ollerhead, 2002; Wolfe, Ollerhead, & Lian, 2002).
In both the Canadian Prairies and the US Great Plains (Figure 14a,b), the parabolic dune activity resumed during the HCO, which was characterised by an increased aridity over the continent (Braconnot et al., 2007; Harrison et al., 2003; Kohfeld & Harrison, 2000; Wanner et al., 2008). In Canada, the boreal forest biomes from the deglacial period were replaced by parkland and grassland during the HCO (Dyke, 2007; Prentice & Webb, 1998; Vance et al., 2007), hence lowering the surface roughness and triggering dune migration (Wolfe, Huntley, & Ollerhead, 2002; Wolfe, Ollerhead, & Lian, 2002). Subsequent late Holocene episodes of parabolic dune remobilisation occurred during the Medieval Climate Optimum (MCO; Wolfe, Ollerhead, & Lian, 2002) but mostly concentrate over the Little Ice Age (LIA; Figure 16a). The LIA climate was arid and marked by pronounced droughts from 250 to 70 years BP (Wolfe et al., 2000). The activity cluster at the end of drought conditions (Figure 16a) when highly mobile barkhans were stabilised and transformed into parabolic dunes by returning vegetation cover (Wolfe et al., 2001; Wolfe & Hugenholtz, 2009). Aboriginal occupation of the region probably contributed to dune mobility through fire and tree cutting for bison procurement activities as well as the resulting trampling (Wolfe, Hugenholtz, et al., 2007).
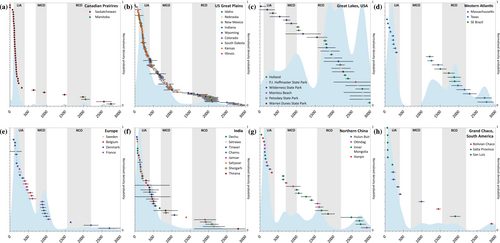
Although temporal and spatial gaps in chronological data may challenge palaeoclimatic significance of dune activity (Halfen & Johnson, 2013; Halfen et al., 2016), substantial parabolic dune mobilisation in the US Great Plains occurred during the warm and dry HCO, Roman Climatic Optimum (RCO), MCO and LIA (Figure 16b; Halfen et al., 2010, 2012, 2016; Halfen & Johnson, 2013; Hanson et al., 2010; Miao et al., 2007). The RCO and MCO were warm and dry period marked by droughts and fires in Europe, particularly in the circum-Mediterranean territories (Hass, 1996; Margaritelli et al., 2020; Scheidel, 2018), and in North America (Bradley, 2003; Bradley et al., 2003; Gunn & Adams, 1981; Jansen et al., 2007; Ladd et al., 2018; Mann et al., 2009) whilst the LIA corresponds to a brief return of cold and dry conditions in the Northern Hemisphere (Mann, 2002; Miller et al., 2012). These intervals have been associated with dune activity in North America (Great Lakes region: Arbogast et al., 2023; US Atlantic coast: Forman, 2015; Livsey et al., 2016; Northern Great Basin, western US: Weppner, Pierce, & Betancourt, 2013) suggesting climate changes occurring at a regional scale at least (Figure 16; Great Plains: Baldauf et al., 2019; Halfen et al., 2012; Mayer & Mahan, 2004; Miao et al., 2007; Schmeisser McKean et al., 2015; Alaska: Wiles et al., 2003; Canada: Wolfe et al., 2008; Wolfe, Hugenholtz, et al., 2007). Changes in atmospheric circulation have also been evoked to explain dune migration in some sites of the Great Plains, for example an easterly shift of the Bermuda High that resulted in the aridification of Colorado (Forman et al., 1995). In the Great Lakes region, the HCO, RCO and MCO coincide with lake transgressions which have long been interpreted as the main trigger for dune activity, hence suggesting a response to external climate forcings such as the dune fields in the Great Plains (Arbogast et al., 2023; Loope et al., 2010). Only few rare studies have reported ages from other mid-latitude and southern locations in the USA (Ivester et al., 2001; Smith & McFaul, 1997; Stokes et al., 1997), which can be explained by a northward migration of the ITCZ (Vimpere, Watkins, & Castelltort, 2021) that resulted in an enhanced effective moisture regime (e.g., permanent lakes and rivers set-up) providing a source of sediment for late Holocene aeolian sediment supply (Halfen et al., 2016). Although the occurrence of decadal to centennial megadroughts during the late Holocene is attested by many proxies (Cook, 2004; Cook et al., 2016), a lot remain to unravel regarding the forcing mechanisms causing them. The significance of parabolic dune activity for palaeoclimate is further challenged by anthropogenic activities generating noise in the signal (Forman, 2015; Forman et al., 2008; Kilibarda & Blockland, 2011; Miao et al., 2010; Wolfe, Hugenholtz, et al., 2007; Wolfe et al., 2008).
4.3.2 Europe
The late Pleistocene climate conditions on the European continent were closely analogous to the ones prevailing over North America. As such, parabolic dunes formation in the central part of the European Sand Belt (e.g., Germany and Poland) initiated during the onset of the post-LGM deglaciation (~17 ka BP; Figure 14e) when strong winds reworked periglacial sediments newly exposed (Andrzejewski & Weckwerth, 2010; Fedorowicz & Zieliński, 2009; Hilgers, 2007; Zieliński et al., 2008, 2011) over an open vegetation cover (De Klerk, 2008; De Klerk et al., 2001). The apparent absence of aeolian deposits before 18 ka BP in the already ice-free proglacial river floodplains could be attributable to permafrost minimising sediment availability (Hilgers, 2007). As ice sheets retreated north, the same conditions prevailed later in Scandinavia (Alexanderson & Bernhardson, 2016; Alexanderson & Fabel, 2015; Bernhardson, 2018; Bernhardson et al., 2019; Bernhardson & Alexanderson, 2018), resulting in a younger phase of parabolic dune build up (~11–7.5 ka BP; Figure 14e).
The remobilisation of parabolic dunes on the European continent during the late Holocene (Figure 16e) has essentially been attributed to increased storminess during the LIA, Bronze Age, and Late Neolithic (Alexanderson & Bernhardson, 2016; Bernhardson, 2018; Bertran et al., 2011; Clemmensen et al., 2001, 2007; De Ceunynck, 1985; Depuydt, 1967; Mäkelä & Illmer, 1990; Tastet, 1998), which were characterised by the expansion of the Polar climate belt and a southward shift of the North Atlantic cyclone track (Borzenkova et al., 2015). Duration and amplitude of these aeolian episodes was probably extended due to increased human pressure on land such as charcoal production and slash-and-burn agriculture in Sweden (Alexanderson & Fabel, 2015; Bernhardson & Alexanderson, 2018), or tree-cutting and cattle breeding in Denmark (Clemmensen et al., 2001). Successive droughts and intensification of both deforestation and agriculture in the northern European Sand Belt caused the reactivation of parabolic dunes during the MCO (Figure 16e; Bertran et al., 2011; Lungershausen et al., 2018; Tastet, 1998; Tolksdorf & Kaiser, 2012).
4.3.3 Asia
Contrary to the aforementioned regions, the LGM in the Thar desert in India was characterised by insufficient strength of both summer and winter winds to trigger dune formation (Figure 14f; Singhvi & Kar, 2004). It is commonly accepted that the Indian Summer Monsoon (ISM) is one of the major drivers for dune accumulation in the region (Kar, 1993; Singhvi & Kar, 2004; Srivastava et al., 2019, 2020; Wasson et al., 1983), which experienced a strong monsoon circulation from ~14 ka BP (Deplazes et al., 2014; Kaushal et al., 2018; Roy & Singhvi, 2016) linked with forced changes in insolation (Berger & Loutre, 1991, 1999). Variability in SW ISM winds has been inferred from a core (ODP-723) retrieved offshore the coast of Oman in the Arabian Sea because the upwelling in the region is driven by the monsoon system (Gupta et al., 2003). Overall, past studies suggested a late Pleistocene-early Holocene strengthening of the ISM and associated winds followed by a progressive decrease until 2 ka BP, when winds strengthened again (Figure 14f). These interpretations agree well with a sustained parabolic dune activity between 14 and 4.5 ka BP followed by a quiescent period (4.5–1.5 ka BP) before a reaction of the dunes during the last millennium (Figures 14f and 16f). Nonetheless, it is noteworthy to mention the complex, non-linear relationship between climate forcing factors and dune activity in the Thar desert during the second half of the humid middle Holocene when parabolic dune activity resumed despite intensified monsoon precipitation regime associated with perennial lakes (Figure 14f; Fuhrmann et al., 2019; Roy & Singhvi, 2016).
In Central China, a similarly contradictive enhanced aeolian activity during the early to middle Holocene coincide with increased monsoonal precipitation caused by a greater summer insolation (Figure 14g; Berger & Loutre, 1991, 1999; Ji et al., 2005). However, it has been inferred that greater insolation increased surface temperatures, leading to a decrease in effective moisture and consequently vegetation cover (Qiang et al., 2013). This interpretation is supported by the multi-proxy based reconstruction of aridity in the region proposed by Fuhrmann et al. (2019). In accordance, studies in central and NE China evoked a period of extensive dune mobilisation (25–13 ka BP), transition from mobilisation to stabilisation (~13–8 ka BP) and substantial stabilisation (~8–4 ka BP) before a succession of multiple episodes of stabilisation/mobilisation (< ~4 ka BP; Guo et al., 2018; Lu et al., 2011; Xu et al., 2015; Yang et al., 2012; Yu & Lai, 2012, 2014). The parabolic dune activity centred between 12 and 8 ka BP (Figure 14g) is consistent with a period of partial stabilisation of other types of dunes after a period of intense mobilisation, thus transforming into parabolic dunes through a partial anchorage by vegetation (Barchyn & Hugenholtz, 2012b; Hanoch et al., 2018; Reitz et al., 2010; Tsoar & Blumberg, 2002; Yan & Baas, 2017). Such transformation would have occurred contemporary to a decrease in wind strength (Qiang et al., 2010) correlating with a weakened Asian monsoon circulation in central China (e.g., Wang et al., 2001). In NE China (Figure 14h), this period translates into a ‘cessation’ of dune activity between 12 and 4 ka BP due to the northwestwards migration of the East Asian monsoon rainfall belt (Yang et al., 2015). One consequence of this shift was the expansion of C4 vegetation in the northeastern deserts, which has largely contributed to parabolic dune stabilisation (Guo et al., 2018). The distribution of luminescence ages for this region suggests a correlation between aeolian activity and global climate events (Figure 14h). Indeed, a marked activity links with the dry/cold YD (Figure 14h) whilst dune stabilisation ensued during the humid HCO, which correlates with an increased humidity in Africa (Bubenzer et al., 2007; Guo et al., 2000) and a northward migration of the Intertropical Convergence Zone (Vimpere, Watkins, & Castelltort, 2021). Late Holocene dune activity in India and China (Figure 16f,g) is principally linked with diminished precipitation and increased human pressure through poor land use (Guo et al., 2018; Han et al., 2022; Li et al., 2002; Li & Yang, 2016; Mason et al., 2009; Singhvi & Kar, 2004; Srivastava et al., 2019; Sun, 2000; Yang et al., 2012, 2013; Yu & Lai, 2014).
4.3.4 South America
In South America, the HCO has been reported to be warm and dry with a noticeable expansion of savanna type vegetation and frequent forest fires (Barboza et al., 2000; de Freitas et al., 2001; Marlon et al., 2016; Mayle et al., 2000; Mourguiart & Ledru, 2003; Pessenda et al., 1998; Power et al., 2008; Servant et al., 1981). The insufficient density of ages during the HCO (Figure 14i) has been attributed to a period of high aeolian activity with a full remobilisation of sediment, thus preventing the preservation of a luminescence signal (May, 2013). In Bolivia, a high sediment supply from intense fluvial sand deposition (Latrubesse et al., 2012; May, Argollo, & Veit, 2008; May, Zech, & Veit, 2008; Servant et al., 1981) would have acted as a source for parabolic dunes under HCO arid climate conditions (Clapperton, 1993; Iriondo, 1993, 1999; Kruck et al., 2011; May, 2013; Tripaldi & Zárate, 2016). Such interpretations imply that the cluster of OSL ages during the LIA (Figure 16h) rather reflects the stabilisation of dunes by increased vegetation cover as shown by pollen records (Burbridge et al., 2004; Chase, 2009; Lancaster, 2002; Mayle et al., 2000; Tsoar, 2005; Whitney & Evans, 2010). A contrary reading is suggested for dune fields in Argentina and Brazil where climate conditions during the arid late Holocene and recent droughts played a significant role in parabolic dune activity (De Oliveira et al., 1999; Peña-Monné et al., 2015; Tripaldi et al., 2013). Natural influences on parabolic dune activity have most probably been aggravated by human activities such as wheat cultivation and overgrazing during the settling of Europeans in Argentina (Peña-Monné et al., 2015; Rodríguez, 2008; Tripaldi et al., 2013).
4.3.5 Southern Africa and Australia
Parabolic dune ages in southern Africa and Australia, due to their coastal position, are mostly influenced by sea level variations (Figure 14j–l). Increased sand supply through coastal erosion (i.e., transgression) is crucial for dune development in humid environments as stabilisation by vegetation would occur rapidly during marine regression. Transgressions thus improved sediment mobility and triggered parabolic dune activity in southern Africa (Armitage, 2003; Armitage et al., 2006; Botha et al., 2003; Porat & Botha, 2008), Madagascar (Battistini, 1964), and in Australia (Dutkiewicz & Prescott, 1997; Ellerton et al., 2020; Patton et al., 2022; Pye & Rhodes, 1985). In southern Africa, parabolic dune activity during the LGM coincided with intensified westerly circulation and diminished precipitation reducing recharge and lowering the water table (Porat & Botha, 2008). The water table itself adjusts to sea level in coastal environments (Kocurek, Robinson, & Sharp, 2001) and is thought to greatly influence the vegetation cover and structure in the region (Matthews et al., 2001). Stabilisation of parabolic dunes followed the HCO highstand (Figure 14j) as implied by significant peat accumulation in interdunes after ~7 ka BP (Ramsay, 1995, 1996). The late Holocene cluster (Figure 14j) has been correlated to a late stage of sea level rise (Armitage, 2003; Armitage et al., 2006) and could correspond to a partial remobilisation during the onset of the RCO of parabolic dunes formed during the Pleistocene–Holocene transition.
In Australia (Figure 14k,l), the LGM low sea level exposed most of the Sahul Shelf (e.g., Williams et al., 2018) and its sedimentary cover to wind action and parabolic dune build up (20–15 ka BP; Lees et al., 1990; Thom et al., 1981, 1994). The ensuing large shoreline advance and poor sediment transfer at the modern coast has been hypothesised to explain the scarce preservation of LGM dunes (Ellerton et al., 2020). The second phase of activity (9.5–4.5 ka BP) coincided with the early Holocene transgression and associated shoreline erosion, destruction of foreshore vegetation, and resulting initiation of transgressive dunes (Ellerton et al., 2020; Lees et al., 1990; Pye, 1993; Pye & Bowman, 1984; Pye & Rhodes, 1985; Pye & Switsur, 1981; Shulmeister & Lees, 1992; Thom et al., 1981; Walker et al., 2018). It also occurred concomitantly with the HCO, characterised by frequent fires and increased storminess (Gontz et al., 2013; Lees, 2006; Mariani et al., 2019; Stewart, 2017) and is separated from the late Holocene last pulse (3–1.5 ka BP) by a wetter period of stabilisation (Donders et al., 2006; Marx et al., 2009; Shulmeister & Lees, 1995). The last peak of activity coincided with reduced vegetation cover during the RCO (Ellerton et al., 2020; Lees et al., 1990), which was probably amplified by fires of anthropogenic origin (Ellerton et al., 2018) or other human activities (Pye, 1993), before a recovery of effective precipitation in the last 2000 years (Shulmeister & Lees, 1995).
4.3.6 Summary
Based on a luminescence-age database spanning the last 20 000 years, the relationship between parabolic dune activity and climates is rather complex, non-linear, and defined by regional conditions. Overall, most parabolic dunes presently observable formed during the LGM and were subsequently reactivated during the Holocene, either partially or completely. Aeolian activity correlates with periods of marked aridity and changes towards more arid or wetter conditions, which can occur during both warm and cold cycles. Some challenges lie within the definition of ‘wetting’ and ‘drying’ when hydrologic and/or photosynthesis proxies are used for palaeoclimate interpretations. Nonetheless, the LGM is globally characterised by cold and dry climate conditions associated with a ubiquitously lower and scarcer vegetation cover likely driven by low CO2 levels (Scheff et al., 2017).
In North America and Europe, parabolic dunes built up during deglaciation and subsequent retreat of ice sheets, which did not take place before the end of the LGM (31–17 ka BP; Bowen, 2009; Figure 14a–c). This period corresponds to periglacial and glaciolacustrine sediments being exposed to ice sheet margin winds in northern regions whereas it coincides with increases sediment transport in rivers in southern locations. Intensified fluvial regimes in combination with favourable climate conditions over the western Atlantic (i.e., sea level and sea surface temperature) led to the somewhat limited dune activity along the eastern coastal plains of the Americas. Overall, glacio-hydrological conditions of the LGM resulted in a high sediment supply and transport capacity by strong winds whilst low and scarce vegetation cover increased sediment availability.
Parabolic dune activity during the recent period of the Holocene arises from a complex interaction between anthropogenic disturbances and climatic forcing. Although a more robust and complete age database would be necessary to avoid any bias, dune remobilisation tend to be synchronous during the different stages of the Holocene (Figures 14 and 16). It is more evident in continental interiors of the northern hemisphere where rather homogeneous changes occurred (Carlson, 2017; Ljungqvist, 2010), even if some spatiotemporal incoherence could lead to slightly asynchronous dune activity in response to heterogeneous regional climate forcings (Neukom et al., 2019). So far, the database is too incomplete for southern hemisphere continental dunes to allow speculative interpretations at a global scale but a clear relationship has been inferred between coastal parabolic dunes activity and sea level changes in southern Africa and Australia (Armitage et al., 2006; Lees, 2006).
The pronounced and globalised activity during the LIA and later probably resulted from a combination between human disturbances and climate conditions favourable for aeolian transport. The anthropogenic impact on vegetation and climate, influencing recent dune mobilisation, and the nonlinear relationship between climate, vegetation and dune activity is to take into consideration when studying recent times (Barchyn & Hugenholtz, 2012a; Durán & Herrmann, 2006; Durán & Moore, 2013; Gao et al., 2020; Hesse et al., 2017). However, a recent worldwide trend of dune stabilisation has been observed and linked with an increase in vegetation cover, urbanisation expansion, changes in land-use practices, lower windiness and increased precipitation (Gao et al., 2020; Jackson et al., 2019).
4.3.7 Common challenges of the luminescence database
Spatial and temporal gaps in the dataset, especially for the southern hemisphere and Asia, complicates the attempts to retrieve a global signal (Lancaster et al., 2016). The lack of geomorphic data such as the sampling sites (i.e., crest, body, arms) or sampling depth, especially in older publications, leads to further inadequate interpretations regarding the magnitude of aeolian activity (i.e., build up, complete, or partial remobilisation). Consequently, dune ‘activity’ is an often-debated definition among the aeolian community, especially when it is defined by luminescence dating (Telfer & Thomas, 2007; Thomas & Bailey, 2017). Since the year 2000, significant advancements were made in the field of luminescence dating techniques, with the introduction of more reliable and effective dating protocols. As a result, it is advised to approach ages reported prior to this date, especially TL and IRSL ages, without fading corrections with caution, thus raising some issue for age comparison (Halfen et al., 2016). The uncertainties associated with the different methods, the nature of the grains (Lamothe, 2016), and the decreasing precision with age (Knight et al., 2004) makes it difficult to interpret aeolian activity, especially at different temporal scales. The nature of luminescence dating induces a natural bias towards young ages because the signal is reset every time the sediment is exposed, which overwrites signal of past activities (Halfen et al., 2016). Contrary, very recent ages are under-represented, which could result from the constant reset of the signal for presently active dunes as well as a sampling bias avoiding the upper 1–2 m of dune profiles (Hesse, 2016). All the aforementioned biases affect the probability density function (PDF) plots as they rely on age frequency, which could represent a higher probability of sampling or preservation of aeolian bodies (Galbraith, 1998; Thomas & Burrough, 2016). Thomas & Bailey (2017) developed the Accumulation Intensity calculation method to identify aeolian activity in an environmentally meaningful way, although it cannot be applied on ages coming from a geographical and stratigraphic scattered context. The authors presented the advantages and limitations of this method when applied to dune fields in Asia (Thomas & Bailey, 2019). Therefore, the PDFs in Figures 14 and 16 are used as indicators but the discussion on past aeolian activity is based on individual ages and past interpretations published in the literature. Nonetheless, PDFs often coincide with climate periods interpreted as favouring dune activity, notably for the late Holocene as a higher uncertainty is expected for older time frames. One reason could be the consequent number of ages available for certain regions (i.e., North America and Europe) or the close link between parabolic dunes and vegetation making them more responsive to climate forcings than other types of dunes.
5 CONCLUSION
Despite the challenges and uncertainties that arise from studying parabolic dunes at a global scale, the holistic approach used in this study has revealed important insights about these bedforms. The morphology of 750 dunes located in 22 countries first indicate that parabolic dunes are progressively smaller at high latitudes and in continental settings. Morphoparameters ratios follow linear relationships, thus defining morphological ranges to predict future dunes size evolution. This also suggests a partial independence of the general morphology of dunes from environmental conditions although an empirical relationship with wind characteristics could be observed by analysing local wind regimes. The global atmospheric circulation appears to have a strong control on dunes orientations, which could be used as a proxy for past atmospheric changes if the signal is preserved by stabilised dunes. Finally, dune activity in the last 20 000 years has been attributed to changes towards dryer climates during both warm and cold periods. In recent times however, a global greening has led to dunes stabilisation and their activity has mostly been linked with human activities such as deforestation, intensive monoculture farming, slash-and-burn agriculture, overgrazing, mining, and urbanisation.
This observation brings to light the importance of establishing suitable coastal and inland management programmes also in temperate and humid territories. Recent studies indicate that drought frequency and severity are strongly correlated to temperature, which will become even more pivotal for drought projections with increasing global warming level (UNDRR et al., 2021). The central parts of the Americas, the Mediterranean, Africa, central Asia, and South Australia are the regions currently affected by an increase in drought frequency and severity and are much likely to be the most strongly affected in the future whilst increased precipitation in high latitude regions will reduce the occurrence and the impact of droughts.
ACKNOWLEDGEMENTS
This project was funded by the Department of Earth Sciences of the University of Geneva. My gratitude goes to Prof. Nicholas Lancaster for generously providing the luminescence ages of parabolic dunes from the INQUA Digital Atlas of Quaternary Dune Fields and Sand Seas Database. Constructive comments from Prof. Patrick Hesp and three anonymous reviewers helped to significantly improve the quality of the work. Open access funding provided by Universite de Geneve.
Open Research
DATA AVAILABILITY STATEMENT
The data that support the findings of this study are available from the corresponding author upon reasonable request.


