Minimum loads of coal-fired power plants and the potential suitability for energy storage using the example of Germany
Funding information: Bundesministerium für Wirtschaft und Energie, Grant/Award Number: 03ET7068F; Ruhr-Universitat Bochum
Summary
Fluctuating residual loads force lignite- and hard-coal-fired power plants to operate at technical and economical limitations. Energy storage systems (ESS) could resolve the plant-design restrictions and enlarge the overall bandwidth of operation. Therefore, the electricity during minimum load can be stored and later fed into the grid. For this, the occurrence of minimum loads which could enable the periodic charging of ESS is analyzed at the example of lignite- and hard-coal-fired power plants in Germany. The durations of the minimum loads show marginal deviations within the considered years, as the median varies between 3 and 4 hours. The median of hard coal is 4 hours and for lignite, between 2 and 3 hours, respectively. In contrast to hard coal, the number of minimum loads of lignite increases slightly from 2016 to 2018. In total, the number and duration of minimum loads of both generation types are aligning within all transmission system areas. This is an indication that lignite power plants are increasingly affected by the merit-order and are gradually being forced to operate more flexibly. Based on the analysis, a rough estimate of a suitable storage size for the integration of an ESS technology was derived for an exemplary power plant.
1 INTRODUCTION
Due to the increasing amount of renewable energies in Germany and worldwide, the short- and long-term demand for flexible power generation technologies is on the rise. The need for improved flexibility1, 2 is mainly caused by weather-dependent generation technologies whose grid integration brings new challenges,3 resulting in steeper and more variable residual loads4, 5 This leads to an increasing amount of low and negative prices at the wholesale markets, which results from nonresponding conventional power plants, especially coal-fired power plants, during low residual loads causing an irreducible minimum of conventional feed-in.6 The reasons for the nonresponding behavior are technical,7 economical, or stability limitations. As a result, the flexibility requirements1, 8 increase regarding the demand and the supply side, requiring more complex considerations of the challenging fluctuations from the demand, the residual load and the renewable energy infeed9 by different market participants.4 As optimization for short start-up times10 and high ramp rates,11* of coal-fired power plants is technically limited, lower minimum loads and higher maximum loads12 and thus an expansion of the overall bandwidth of the operation can contribute to increasing the flexibility of existing coal-fired power plants. As an example, for an energy system with a high share of fluctuating renewable energies, the occurring number and durations of minimum loads of selected hard coal and lignite-fired power plants in Germany from 2016 to 2018 are studied in this publication to analyze the trends of minimum loads of successive years. On the basis of this data, the possible increase in flexibility by combining storage technologies with conventional power plants,13† to take advantage of occurring minimum loads is shortly analyzed.
In countries with a high installed capacity of renewable energies, the measures by the Transmission System Operators (TSO) to maintain network and system security and therefore the resulting costs can vary exceptionally depending on the weather conditions during the observed period. In Germany, for instance, the costs for redispatching (with countertrading), feed-in management, and grid reserve power plants14 (see Table 1) in 2017 (EUR 1511 million, 26 103 GWh)15 increased by 69% compared to 2016 (EUR 894 million, 16 427 GWh),15 mainly caused by delays in transmission grid expansion plus weak winds in 201616, 17 and strong winds in 2017.16, 18 Nearly 28% (EUR 421 million, excluding grid reserve power plants) of the total amount in 2017 were costs for redispatching through market power plants,15 whereas this only involves conventional power plants on account of the priority dispatch rules.19 This is an increase by around 80% compared to 2016 (EUR 235 million).15 The costs for the feed-in management amounts to around 40% (EUR 610 million)15 and increased by around 64% compared to 2016 (EUR 373 million).15 In contrast to the redispatching, feed-in management only takes into account renewable energy and combined heat and power (CHP) installations.14 The remaining 32% (EUR 480 million)15 is made up of the costs of maintaining and using grid reserve power plants, which increased by nearly 68% (EUR 286 million in 2016).15 More detailed information of costs and energies regarding the redispatch (with countertrading), feed-in management, and grid reserve power plants for the considered years 2016 to 2018 is shown in Table 2.
| Redispatching14 | Reducing and increasing electricity feed-in from power plants according to a contractual arrangement with a network operator or with a statutory obligation toward the network operator with costs being reimbursed. |
| Feed-in management14 | Curtailing feed-in from renewable energy and combined heat and power (CHP) installations at the network operator's request with compensation being paid. |
| Grid reserve power plants14 | Deploying grid reserve plant capacity to compensate for a deficit of redispatch capacity according to a contractual arrangement with costs being reimbursed. |
| Network and system security measures in Germany15 | 2016 | 2017 | 2018 |
|---|---|---|---|
| Redispatching | |||
| Total volume of operational plants (GWh) | 11 475 | 18 456 | 14 875 |
| Cost estimate for redispatching (million EUR) | 223 | 392 | 352 |
| Cost estimate for countertrading (million EUR) | 12 | 29 | 36 |
| Grid reserve power plants | |||
| Volume (GWh) | 1209 | 2129 | 904 |
| Cost estimate for activation (million EUR) | 103 | 184 | 85 |
| Capacity (MW) | 8383 | 11 430 | 6598 |
| Annual costs of holding in reserve (million EUR) | 183 | 296 | 330 |
| Feed-in management | |||
| Volume of curtailed energy (GWh) | 3743 | 5518 | 5403 |
| Estimated compensation (million EUR) | 373 | 610 | 635 |
| Feed-in adjustments | |||
| Volume (GWh) | 4 | 35 | 8 |
The measures taken due to the massive weather-dependent fluctuations of the renewable energy feed-in clarify the demand for flexible and permanent adjustable power generation technologies. Thereby, network and system security can be maintained while the associated costs are stabilized. Various established conventional technologies are currently partially able to fulfil the required flexibility options. Using these existing conventional capacities20 during the aimed exit from nuclear and fossil-fuel energy in Germany could enable the integration of larger renewable energy capacities21 in the supply system.9, 22 Meanwhile, the conventional technologies can progressively be replaced by nonpolluting solutions that provide power when the wind and sun are short23 (eg, storage technologies).24, 25 As shown as an example in Figure 1, retrofitted and state-of-the-art lignite-, hard coal– and gas-fired power plants are three kinds of conventional technologies in the German power system, which can match the stated requirements. Moreover, these fuels are available in sufficient quantities in various countries.
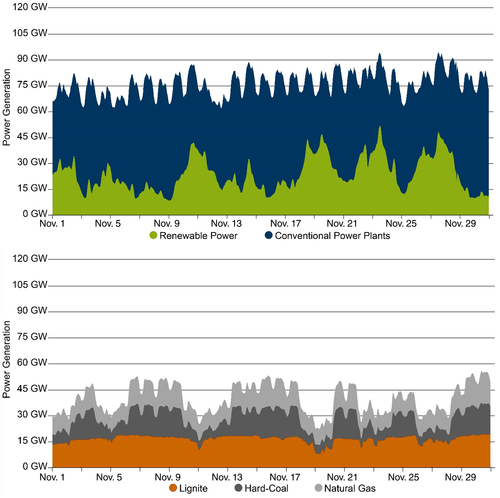
The increasing share of renewable power generation is leading to a reduction of the operating time of conventional power plants.27 Depending on the demand and renewables feed-in, the power generation of all three conventional technologies declines and increases several times a day to enable the integration of renewables.1, 21 Compared to the ramp-rates and start-up times of gas-fired generation units,‡ the lignite- and hard coal–fired power plants are less flexible in most cases.1, 20 In contrast and regarding the reviewed years 2016 to 2018, their levelized costs of electricity (LCOE) in Germany are significantly lower than the LCOE of gas.28 However, this may change with fluctuating gas prices and more expensive CO2 Emission Certificates, but overall the three technologies and especially hard coal– and gas-fired generation units29 suffer from the merit-order effect30, 31 on the wholesale markets1 and the rising specific generation costs due to the reduced average utilisation.1, 28 But unlike the gas-fired generation units which are often designed for mid-merit and peak load, the coal-fired power plants currently face the shift20 from base-load to more fluctuating loads.1, 32 Due to the advantage of the gas-fired generation units toward coal-fired power plants regarding the ramp-rates and start-up times, this article do not take gas-fired generation units into account. Although nuclear power plants also have a disadvantage compared to gas-fired power plants in terms of flexibility, this technology is not taken into account as well as this analysis is obsolete due to the aimed exit from nuclear energy in Germany in 2022.33 Instead, the focus will be the expanding of the overall bandwidth of operation of coal-fired power plants. In terms of these two technologies (hard-coal and lignite), the further reduction of the minimum load levels has proven to bring the most benefits, as it helps to integrate higher shares of renewables into the power system.1 Mainly, the expansion of the overall bandwidth can be accomplished by reducing the minimum load or by increasing the maximum load of the coal-fired power plants. As the maximum load is restricted by the plant design, the improvement of the minimum load appears more reasonable1 as it is limited by the boiler fire stability and the allowable thermal stress on components.34 If both ways of expansion reach their technical limitations, the integration of energy storage systems (ESS) could possibly resolve the plant-design restrictions35 and enlarge the overall minimum and maximum bandwidth of operation.36, 37 Therefore, the electricity produced in minimum load can be stored within the ESS to further decrease conventional feed-in into the supply system while maintaining the boiler stability and avoiding short-term shutdowns of the power plant. This relative feed-in decrease of conventional capacity enables a higher integration of renewables into the supply system. At the same time, it increases the system security by providing immediate frequency and voltage maintaining measures22 by the continuously operating power plant. Simultaneously it enables the possibility of increasing grid feed-in beyond the coal-fired power plant maximum capacity without starting-up further power plants by using the ESS during the weather-dependent decline of renewables or occurring peak loads.
Given the technical requirements and benefits for power plant plus energy storage systems, it is necessary to analyze the incidence of occurrence of the minimum load cases, which could enable the periodic charging of the storage. Therefore, it is necessary to investigate a larger variety of coal-fired power plants within the same market area to determine whether this is a specific approach for selected plants or has the potential for broad application. In the current literature, there is a focus on quantifying the occurrence of periods with high and short renewable feed-in in the supply system and the impact on the residual load. As a low residual load is the main trigger to reduce capacity and to remain in minimum load of a coal-fired power plant,20 it seems possible to quantify minimum load periods based on the residual load. But as mentioned in,6 the conventional feed-in during low residual loads is limited by technical, economic, and stability factors.38 Thus, the actual feed-in of a specific coal-fired power plant during low residual loads is influenced by its own technical and economic limitations as well as the demanded feed-in for grid-stabilizing measures according to the specific TSO. This is why the quantification of the occurrence of minimal load periods for a specific coal-fired power plant based on the residual load is insufficient as it is influenced by a variety of uncertainties.
Other literature like37 and39 focus on energy or thermal storage combinations for a specific plant, which is necessary to study the feasibility of this approach, but does not provide sufficient information on whether this is needed for a wide range of power plants. This is important to gain knowledge about how various power plants of one or more generation technologies within the same market area are affected by minimum load periods. This article addresses this gap by studying various load profiles of several kinds of coal-fired power plants in different transmission system areas using the example of Germany.
- How do the occurring number and durations of minimum load periods of selected hard coal– and lignite-fired power plants in various transmission system areas in Germany differ?
- Is it possible to determine a rough estimation of a reasonable energy storage system capacity to expand the overall bandwidth of operation of a specific coal-fired power plant based on the analysis of the occurring minimum loads?
The article is structured in the following way: Section 2 introduces the used data, the methodology, and the assumptions for analyzing the load profiles of energy generation technologies. Section 3 describes the cases studied in Germany. The results obtained by applying the method to the described cases are presented and discussed in Section 4. Section 5 shows a small exemplary use case how the results of Section 4 can be used for further energy storage analysis. Finally, Section 6 summarizes the most significant results and presents conclusions.
2 ASSUMPTIONS, DATA, AND METHODS
In order to investigate the number and duration of minimum load periods of selected coal-fired power plants, temporal highly resolved data of the different plant units are essential to achieve reliable results. To ensure consistent quality of the data for different European countries, the transparency data sets provided by the European Energy Exchange AG (EEX) are used for the studies.,40, 41§ Although this study focuses on plants in Germany, European datasets are used as the method not limited to the German market. The actual generation per plant and unit is available for every generation unit participating in the wholesale market with a resolution of one hour for a whole year. Highly resolved datasets are also provided by the European Network of Transmission System Operators for Electricity (ENTSO-E)42 for more countries than the EEX, offering via its transparency data. However, due to the increased occurrence of data gaps in several countries during the sighting of the ENTSO-E data sets, this source is not used for the studies.
To be able to analyze the minimum load periods, load profiles of selected generation units need to be created based on the EEX transparency data sets. The selection of suitable coal-fired generation units for the introduced case is set by the initial operation of the units. To make the integration of ESS to increase the bandwidth of operation of the power plant a reasonable option, amortization of the investment has to be possible. Therefore, only units with a potential remaining term of at least 10 years are considered. This means, only generation units with an initial operation in 1989 or later are considered, as a lifetime of at least 40 years for coal-fired power plants is assumed.43 Furthermore, especially for the exemplary German market, a generation unit with a scheduled final or temporary shutdown as well as a planned transfer to a seasonal mothballing, a grid reserve or a standby mode for backup purposes needs to be excluded in this study (see Table 3).43, 44 Heat-operated CHP plants whose load is mainly aligned with the required heat demand and differ significantly from power-operated load profiles, as well as generation units with a maximum net-load below 100 MW, are also excluded.40, 43
| Initial operation | ≥1989 |
| Expected lifetime | 40 a |
| Reasons for excluding generation units | Temporarily shutdown Final shutdown Seasonal mothballing Grid reserve Standby mode for backup purposes Heat-operated CHP Maximum net-load below 100 MW |
2.1 Load profile creation and definition of the specific minimum load
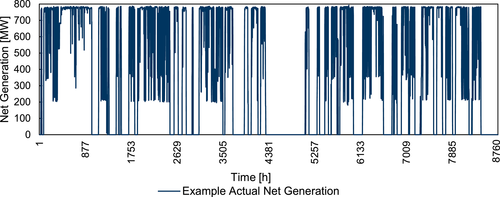
The creation of hourly dissolved load profiles of the selected generation units is done using the EEX-specific generation unit identification and the respective EEX “end-of-day” files for the actual unit power generation of the considered year.40 The automated search and consolidation of the data result in a final load profile with 8760 actual power generation values (resp. 8784 in a leap year) for each generation unit. It is important to note that these values are single measurement points of the current load and no averages of the aggregated specific hour, which can lead to deviations (see Section 2.2).45 An exemplary resulting net generation profile is given in Figure 2.
The potential minimum load of each generation unit is determined from an analysis of the created load profile and improved by literature data of the specific generation unit if available. A classification of the “actual net generation” into nominal capacity (maximum load), partial load, and shutdown is possible according to Figure 3, whereas the definition of minimum load is not explicitly clear. As the power output of the generation units is influenced by boiler stability and grid-stabilizing measures according to the specific TSO, an upper (UMP) and lower (LMP) minimum load point is defined to cover a minimum load range. To restrict this range, the difference of the two load points is 10% of the nominal capacity of the specific unit (see Figure 3). Normally, for each generation unit to be analyzed, a specific range should be derived from the data to take the respective technical design and modifications into consideration. Depending on the number of studied generation units, this may lead to a strong increase in workload for data preparation. In order to standardize this range to a certain extent and to reduce the workload, the range of 10% is chosen as it is determined from the analyzed load profiles, which cover all minimum loads of the coal-fired generation units under consideration (see Table 5).
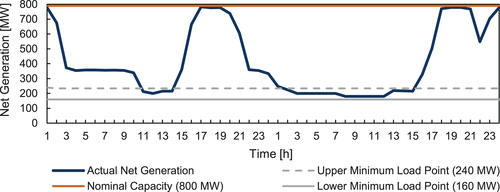
The position of the resulting upper and lower minimum load points is determined in such a way that the minimum load range covers the majority of the occurring minimum loads of the respective load profiles. As shown in Figure 3, the values of the load profile inside this range are interpreted as minimum load. Accordingly, a minimum load range of a specific power plant is determined on the basis of the respective created load profile and is not restricted by a single average value20 of the considered power generation technology. This approach is chosen as the respective generation units and their average values can often differ depending on the respective modifications, even if they are based on the same generation technology. Therefore, using average values to define the minimum load of a specific generation unit may lead to incorrect detections of minimum loads.
Particular techniques enabling an additional but temporarily limited reduction of the minimum load are not considered. Only unrestrictedly stable operating points are set out as lower minimum load points. Also, external factors as weather or ambient temperature with possible effects on the plant efficiency and therefore on the feasible lower minimum load point are not taken into account. For the exemplary study of Germany, the defined minimum load range of every selected generation unit can be seen in Table 5.
2.2 Detection of minimum load periods
 (1)
(1)| Pt ≤ | Upper minimum load point |
| Pt ≥ | Lower minimum load point |
| Pt − 1 ≥ | |
| Pt − 2 ≥ | |
| Pt + 1 ≥ |
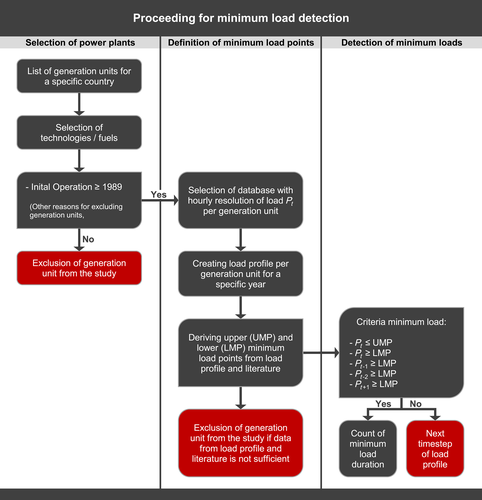
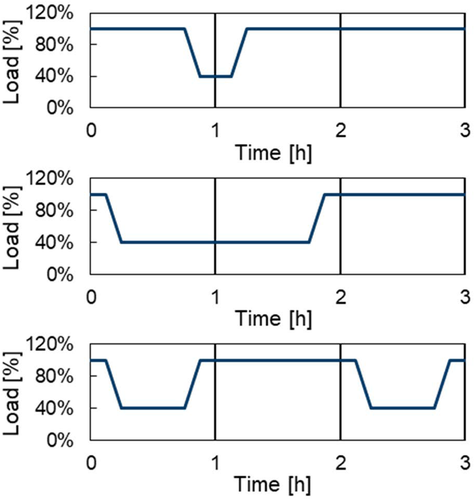
As long as the values fulfil the boundary conditions, the algorithm assumes a progressive minimum load period of the generation unit and records the duration. As soon as the minimum load range is left or any condition is violated, it is assumed that the minimum load period ends. However, one has to take into account that due to the hourly resolution of the data, a wrong detection or interruption of a minimum load period is still possible, as the actual power generation value of the generation unit is recorded once every hour as a single measurement point of the current load by the EEX. Thus, interim changes of the generation unit within this hour are not recorded and can lead to a significant variation of the actual power generation (Pt) compared to the values one hour before (Pt − 1) and after (Pt + 1) which may have an impact on the detection. Figure 5 illustrates possible false detections of minimum load periods to give an example for potential deviations and errors. However, even if this problem is known, no quantitative statement can be given about the occurrence of these deviations, as values with a higher resolution are not available for a comparison for the considered years.
The recorded periods are sectioned according to their duration from 1 to 24 hours and greater than 24 hours, respectively. Based on this partition, the occurrence of different minimum load periods can be analyzed and compared between several generation units. Finally, it should be noted that this methodology is not limited to coal-fired generation units but applies to all generation units for which the required data sets are available.
3 STUDIED CASES OF COAL-FIRED POWER PLANTS IN GERMANY
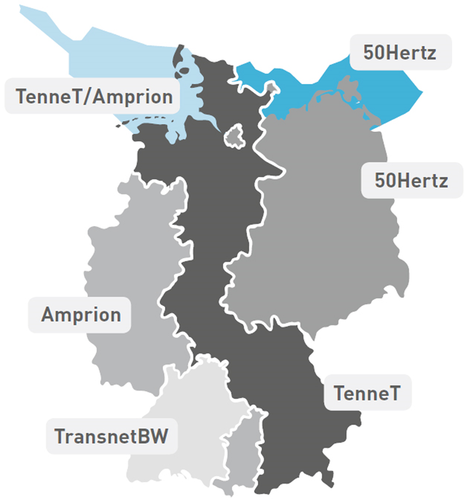
As described in Section 2, the selection of suitable coal-fired generation units for the integration of ESS to increases the bandwidth of operation of the power plant is done by various criteria. The application of the criteria to the German coal-fired power plants opens up a consideration of 8 hard coal– and 11 lignite-fired power plants in various transmission system areas (see Figure 6) and is shown in Table 5. The reference net unit power of each selected power plant varies between 119 MW and 800 MW for hard coal and 450 to 1060 MW for lignite. Accordingly, around 23% (approx. 5000 MW) of all hard coal–fired generation capacities (21 363 MW)43 and 46% (approx. 8700 MW) of all lignite-fired generation capacities (18 940 MW)43 are considered. These power plant shares are representative for the chosen scope of the study considering the assumptions. The defined upper and lower minimum load points to cover a minimum load range of 10% of the respective reference net unit power are derived depending on the respective load profiles of the considered years and are shown in Table 5.
| Plant40, 43 | Block-unit40, 43 | Grid operator43 | Commercial operation date40, 43 | Reference net unit power (MW)40 | Technical minimum load range (%) |
|---|---|---|---|---|---|
| Hard-Coal | |||||
| KW Herne | Herne 4 | Amprion | 1989 | 470 | 14-24 |
| Trianel Kraftwerk Lünen | - | Amprion | 2013 | 746 | 15-25 |
| KW Walsum | Walsum 10 | Amprion | 2013 | 725 | 32-42 |
| Westfalen | E | Amprion | 2014 | 780 | 20-30 |
| KW Hastedt | Block 15 | TenneT | 2014 | 119 | 50-60 |
| KNG Kraftwerk Rostock | Rostock | 50Hertz | 1994 | 514 | 45-55 |
| Moorburg A | A | 50Hertz | 2015 | 800 | 18-28 |
| Moorburg B | B | 50Hertz | 2015 | 800 | 18-28 |
| Lignite | |||||
| Niederaußem | K | Amprion | 2002 | 924 | 38-48 |
| BoA 2 | Neurath F | Amprion | 2012 | 1060 | 40-50 |
| BoA 3 | Neurath G | Amprion | 2012 | 1060 | 40-50 |
| Schkopau | A | 50Hertz | 1996 | 450 | 35-45 |
| Schkopau | B | 50Hertz | 1996 | 450 | 30-40 |
| Schwarze Pumpe | A | 50Hertz | 1997 | 755 | 28-38 |
| Schwarze Pumpe | B | 50Hertz | 1998 | 755 | 28-38 |
| Lippendorf | LIP S | 50Hertz | 1999 | 891 | 30-40 |
| Lippendorf | R | 50Hertz | 2000 | 891 | 30-40 |
| Boxberg | Q | 50Hertz | 2000 | 840 | 24-34 |
| Boxberg | R | 50Hertz | 2012 | 630 | 26-36 |
According to the criteria, the selection of suitable coal-fired generation units for the integration of ESS does not include plants within the TransnetBW control area and only one single generation unit within the TenneT control area. For this reason, only two of the four transmission system areas are comparable to each other for analysis, whereas the representativeness and thus the comparability of the TenneT control area are limited. This is important to consider, as the 50Hertz Transmission GmbH and the TenneT TSO GmbH are also responsible for the grid connections and the energy transmission of the offshore wind power from the Baltic Sea and the North Sea. These grid-specific infrastructural characteristics in combination with grid-stabilizing measures by the specific TSO, as shown by the exemplary redispatching measures in Table 6, can have a strong influence on the operation of the power plants. This indicates that these effects, although not examined in detail in this analysis, need to be taken into account when evaluating the results in Section 6.
| Redispatching measures14-16 | Total volume (GWh) | Total volume (GWh) | Total volume (GWh) |
|---|---|---|---|
| Control area | 2016 | 2017 | 2018 |
| TenneT | 6271 | 8743 | 9030 |
| 50Hertz | 4663 | 3246 | 343 |
| Transnet BW | 158 | 556 | 458 |
| Amprion | 383 | 1869 | 1023 |
| Total | 11 475 | 14 414 | 10 854 |
- Note: Breakdown of redispatching measures changed from 2017 compared to 2016. For details see Reference 15.
4 RESULTS
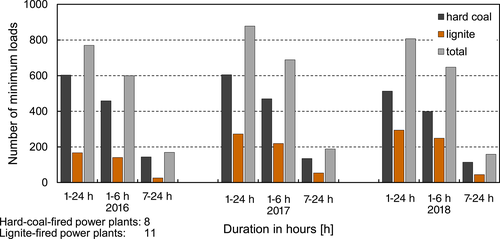
This section will consider the 19 cases defined in Section 3 and illustrate the results based on the years in review 2016, 2017, and 2018. As seen in Figure 7, the results are subdivided by numbers in total and for the respective fuel of the coal-fired power plants. Furthermore, for each year, an additional distinction of the results is made based on the respective transmission system areas to address possible differences in numbers and duration of minimum loads within these areas.
4.1 Number of minimum loads of the studied cases
The numbers of minimum loads from 1 to 24 hours in Figure 7 are subdivided according to the respective period of duration for 1 to 6 hours and 7 to 24 hours. This subdivision results from the data analysis, as most of the minimum loads do not exceed a duration of 6 hours and only a limited number have a duration of more than 6 hours (see Figure 7). The numbers of minimum loads from 1 to 24 hours for hard-coal-fired power plants in 2017 remain steady compared to 2016, whereas the numbers for lignite-fired power plants increase by around 60%, leading to a total rise of around 14%. In detail, the numbers for minimum loads within a duration of 1 to 6 hours for lignite increase by 55% and double by 107% within 7 to 24 hours. In 2018, the numbers for lignite within 1 to 6 hours keep rising slightly by 16%, while the numbers for hard coal decrease by nearly the same value. For a duration between 7 and 24 hours, the numbers for both fuels decline by around 16%, leading to a total reduction of 8% toward 2017. Concerning the changes between the years 2016 and 2018, it is noticeable that the increase of minimum load numbers is limited to lignite-fired power plants, while hard coal tends to decline slightly and the number of minimum loads of both technologies approximate.
The numbers of minimum loads concerning the various transmission system areas may differ in part from the total results for Germany in Figure 7 depending on the respective TSO. As seen in Figure 8 (top), the numbers of minimum loads for 1 to 24 hours within the Amprion control area increase for hard coal and lignite by 30% and 63% in 2017 compared to 2016, resulting in a total rise of 36%. At the same time, the numbers for 1 to 24 hours for hard coal–fired power plants in the TenneT¶ and the 50Hertz control area decrease by 21% (Figure 8 center) and 34% (Figure 8 bottom), while the numbers for lignite within the 50Hertz control area increase by 64% (Figure 8 bottom).
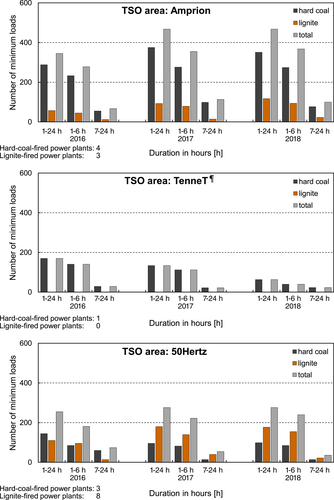
Compared to each other, the growth for lignite in the 50Hertz control area is twice as large as in the Amprion control area. However, the total rise is only one-quarter of the Amprion control area due to the decrease in the 50Hertz and increase in the Amprion area of hard coal minimum load numbers. In 2018, the total number within the Amprion control area remains steady, while the number for hard coal declines by 6% and keeps increasing by 26% for lignite. The number regarding the TenneT control area follows the 2017 trend and decreases again by 53% in 2018. Within the 50Hertz control area, there is no change compared to 2017. Compared with Figure 7, the decrease in minimum load numbers for 1 to 24 hours for hard-coal-fired power plants between the years 2016 and 2018 is mainly caused by declines within the TenneT and 50Hertz control area and only slightly influenced by the Amprion control area. For lignite, both relevant control areas Amprion and 50Hertz follow the same trend and feature a significant increase in the number of minimum loads by 105% and 61% between 2016 and 2018.
As shown in Table 7, the maximum average number of minimum loads per generation unit and year for 2016 and 2017 is found within the TenneT control area. However, due to the criteria for selecting suitable power plants for this analysis, this area is only represented by one hard coal–fired generation unit, which is a reason for strong variations. Therefore, the representativeness and validity for the whole TenneT control area are limited. Comparing the other control areas, the average number within the Amprion control area is 1.5 to 3 times higher than within the 50Hertz control area, especially for hard coal. Furthermore, the previously mentioned decline of hard coal within the 50Hertz control area and the increase within the Amprion control area can be found in Table 7 again, leading to an almost steady average of minimum loads per generation unit of 62 to 67 for the combined areas. The increase of minimum loads for lignite-fired power plants turns out greater within the Amprion than in the 50Hertz control area. This nearly doubles the average number from 15 in 2016 to 27 in 2018 for the combination of both areas. In total, there is an increase within the Amprion control area from 49 to 67 minimum loads per generation unit, while the number remains steady at 23 to 25 within the 50Hertz control area. For the TenneT control area, in total, there is no difference compared to the hard-coal statistics as there is no lignite-fired power plant within this area. Overall, there is an average range of 32 to 170 minimum loads for hard coal–fired generation units, 14 to 39 for lignite, and 23 to 170 in total including the questionable numbers of the TenneT control area. Excluding this area, the average changes to a range from 23 to 67 in total and cuts the maximum by 2.5 times. This leads to a more representative range, allowing more specific interpretations regarding the defined questions of this article.
| TSO control area43 | Average number of minimum loads per generation unit | ||
|---|---|---|---|
| 2016 | 2017 | 2018 | |
| Hard coal | |||
| Amprion | 72 | 94 | 88 |
| 50Hertz | 49 | 32 | 33 |
| TenneT | 170 | 134 | 63 |
| Amprion + 50Hertz | 62 | 67 | 64 |
| Amprion + 50Hertz + TenneTb | 76 | 76 | 64 |
| Lignite | |||
| Amprion | 19 | 31 | 39 |
| 50Hertz | 14 | 23 | 22 |
| TenneTb | - | - | - |
| Amprion + 50Hertz | 15 | 25 | 27 |
| Amprion + 50Hertz + TenneTb | 15 | 25 | 27 |
| Total | |||
| Amprion | 49 | 67 | 67 |
| 50Hertz | 23 | 25 | 25 |
| TenneTb | 170 | 134 | 63 |
| Amprion + 50Hertz | 33 | 41 | 41 |
| Amprion + 50Hertz + TenneTb | 41 | 46 | 43 |
- a When speaking of “average” the arithmetic average is meant for subsequent pages.
- b TenneT is only represented by one hard-coal-fired generation unit so that the representativeness is limited.
4.2 Duration of minimum loads of the studied cases
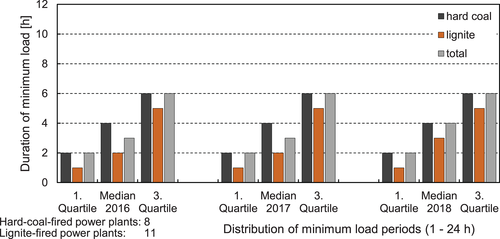
The duration of minimum loads in Figure 9 is plotted as median and first and third quartiles for the respective year. The calculated key Figures contain every minimum load period lasting inside 1 and 24 hours. Concerning the hard coal–fired power plants, neither the median with 4 hours duration nor the quartiles with 2 and 6 hours vary within the years 2016 to 2018 and remain steady. For the lignite-fired power plants, there is also almost no variation but a small increase of the median by 1 hour in 2018 compared to 2017 and 2016. Overall, the small increase repeats, leading to a total median duration of 3 hours in 2016 and 2017 and 4 hours in 2018.
Similar to the previous Section 4.1, the duration also may partly differ from the total results for Germany in Figure 9 depending on the respective TSO. As seen in Figure 10 (top), there is almost no variation concerning the durations of the minimum loads within the Amprion control area. The median and the first and third quartile for hard coal–fired power plants remain constant by 4 hours as well as 2 and 6 hours, respectively, for all considered years. They show no difference to the overall results in Figure 9. For lignite-fired power plants, there is a small increase of 1 hour in 2018 regarding the third quartile. Compared to the durations in Figure 9, the periods of the median and first quartile are slightly increased by 1 hour for 2016 and 2017 and partly for 2018. In total, the durations remain constant and show only small variations regarding the median toward the results in Figure 9 in 2016 and 2017.
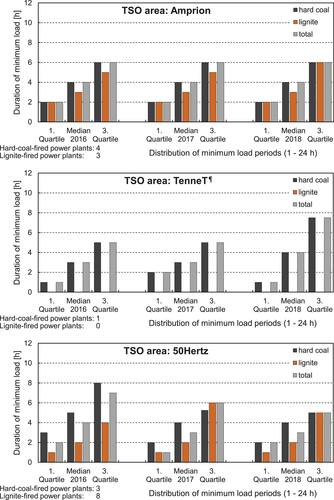
Within the TenneT control area shown in Figure 10 (center), there is a temporary increase in the first quartile in 2017. The median and the third quartile remain steady for 2016 and 2017 and increase slightly by 1 hour and 2.5 hours in 2018, respectively. Similar to the Amprion control area, the durations within the TenneT control area only differ on a small scale to the overall results in Figure 9. Unlike the other areas, the minimum load durations of all quartiles and medians within the 50Hertz control area for hard coal–fired power plants in Figure 10 (bottom) decrease by 1 to 3 hours in 2017 and 2018 compared to 2016. In contrast, the third quartile of the lignite-fired power plants increases a little, while the median and first quartile remain constant over the years. The decrease of the hard coal durations leads to a decline of the total results for the 50Hertz control area, which contrasts with the overall results in Figure 9 and the control areas of Amprion and TenneT. However, the occurring deviations within the 50Hertz control area only vary by 1 to 2 hours above or below the other results, so that the results are in a similar range and appear coherent, bearing in mind that the TenneT control area is only represented by one hard coal–fired generation unit so that the representativeness for this specific area is limited.
4.3 Discussion of the minimum load data
For an exemplary analysis of 8 hard-coal-fired and 11 lignite-fired power plants in various transmission system areas in Germany, the methodology used shows that the average annual number of minimum loads per generation unit in 2016 to 2018 varies between 41 and 46. Due to the number of considered plants per area, only the two transmission system areas of Amprion and 50Hertz are usable for comparison. The average number of the 50Hertz area varies between 23 and 25, whereas the average number of the Amprion area exceeds these values with a factor of two to three by varying between 49 and 67 (details per generation technology, see Table 7). Although not further analyzed and out of scope in this study, this allows the interpretation that the penetration of renewable energies within the specific transmission system area has a major influence on the minimum load periods by causing more volatile residual loads. This presumption is backed by the increasing volumes of redispatching, grid reserve power plants, and feed-in management from 2016 to 2017 and the following decrease from 2017 to 2018 (see Table 2). The variation of the total number of minimum loads shown in Figure 7 changes in similar proportions to the shown network and system security measures. The durations of all analyzed minimum loads show marginal deviations within the considered years of 2016 to 2018, as the median varies between 3 and 4 hours. Separately regarding the power plants, the median of hard coal is approx. 4 hours and for lignite between 2 (50Hertz) and 3 (Amprion) hours, whereas the number of minimum loads of lignite increases slightly from 2016 to 2018. In detail, the durations for hard coal are longer as for lignite, and the number of minimum loads is greater as well. Both characteristics are probably attributable to the merit order. Due to the higher generation costs,28 the hard-coal-fired generation units are forced to minimum load at an earlier point in time than the lignite-fired generation units and leave it later for the same reason, probably leading to an increase of the duration. In parallel, the integration of renewable energy capacities proceeds during the considered years, and in addition, there is diverse weather with weak winds in 2016,16, 17 strong winds in 2017,16, 18 and a sun-rich year in 2018.47 Within this period, the number and the duration of minimum loads of hard coal– and lignite-fired generation units are aligning within all transmission system areas. This leads to the presumption that the lignite-fired generation units are increasingly affected by the market price-driven merit-order and are gradually being forced to operate more flexibly, such as hard-coal-fired power plants. Furthermore, with increasing integration of renewable energies, the number and duration of minimum loads could be expected to rise as seen in Table 5 and Figure 7 from 2016 to 2017. But according to the analysis, this is only slightly the case. A possible reason could be the forced decommissioning of inflexible nuclear power plants and old coal-fired power plants leading to an increase of more flexible coal-fired capacities within the transmission system. These remaining capacities might counter the increase in residual load volatility, which is probably triggered by the ongoing integration of renewable energies.33, 44 As this study does only provide statistical data of the number and the duration of minimum loads and not the evidence for the supposed reasons formulated, further analysis with reference to the presumptions is needed.
In addition to these discussions, grid-specific infrastructural characteristics in combination with grid-stabilizing measures by the Transmission System Operators also influence the operation of the power plants. For the TenneT and 50Hertz control areas, the grid connections of offshore wind energy in the North Sea and Baltic Sea as well as the onshore wind energy in the coastal regions and the energy transmission to the more southern areas of the grid can be a strong influencing factor for diverse minimum load numbers and durations. This presumption can also be derived from the redispatch measures in Table 6. Also, North Rhine-Westphalia and especially the Ruhr area with a high density of population and industry probably have a strong influence on the operation of power plants. Together with the feed-in of renewable energy, a different regional residual load and redispatch in the Amprion control area than in the 50Hertz control area is supposable (see Table 6), requiring modified operation modes. This might be a reason why the Amprion control area has a much higher average number of minimum loads for hard coal and lignite-fired generation units compared to the 50Hertz control area.
5 EXEMPLARY USE CASE
To show how the analysis of minimum loads can potentially support the determination of a reasonable energy storage capacity an example based on the hard-coal-fired power plant Westfalen Block-Unit E (see Table 5) is given below for the year 2018. The electricity produced in minimum load can be stored within the ESS to further decrease conventional feed-in into the supply system while maintaining the boiler stability and avoiding short-term shutdowns of the power plant. Furthermore, it enables the possibility of increasing grid feed-in beyond the coal-fired power plant maximum capacity without starting-up further power plants by using the energy storage system during the weather-dependent decline of renewables or occurring peak loads. Therefore, Figure 11 shows the various durations of the minimum loads and the number of times they occur for the specific power plant. Beside the other power plants, this one was chosen due to the suitable data to illustrate an exemplary use case with various durations of minimum loads.
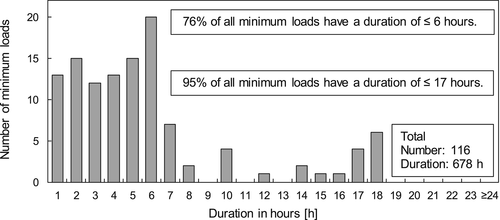
In this example, 88 of 116 minimum loads in 2018 (76%) have a duration of 6 hours or less. The remaining 28 minimum loads (24%) have a duration of 7 to 18 hours (see Figure 11 and Table 8). This is a first indicator for a suitable energy storage capacity, as a large part of the available hours within the minimum loads can be stored with a capacity of 6 hours. However, the storage of the remaining 24% of the available hours requires a tripling of the capacity (see Tables 8, 17 hours of ESS capacity). Depending on the technology used, this can lead to a sharp increase in investment with relatively low added value. From the derived capacity of 6 hours results that 494 hours (73%) of the available 678 hours can be used for storage, whereas 184 hours (27%) are not taken into account because of the storage capacity chosen (see Table 8). This case is equal to 82 full equivalent cycles (FEC)48 for a storage technology with unrestricted use of 6 hours capacity. Accordingly, this information can be used to narrow down suitable storage technologies, carry out initial dimensioning estimates, and make an application-specific material and technology selection, for example, to define the electrode materials for an electrochemical storage device in terms of cyclic lifetime.
| Maximum duration of minimum load [h] | Minimum loads ≤ maximum duration [number] | Usable minimum loads [number] | Share, number of min. loads [%] | Derived ESS capacity [h] | Available hours used for storage [h] | Available hours not used for storage [h] | FEC48 [number] |
|---|---|---|---|---|---|---|---|
| 6 | 88 | 116 | 76 | 6 | 494 (73%) | 184 (27%) | 82 (494/6) |
| 17 | 110 | 116 | 95 | 17 | 672 (99%) | 6 (1%) | 39 (672/17) |
| Example for battery energy storage system with 4 hours of capacity | |||||||
| 4 | 53 | 116 | 46 | 4 | 383 (56%) | 295 (44%) | 95 (383/4) |
In order to relate the data in this exemplary use case to a practical application and a specific technology, an established storage technology on international energy market should be used. Therefore, lithium-ion battery energy storage systems (BESS) as a certain example is a reasonable choice. As different sources49 and projects indicate50, 51 the current maximum storage capacity of BESS installed and in operation is usually 4 hours, with occasional projects with up to 6 hours.50, 52 As Table 8 shows, 53 (46%) of the available minimum loads have a duration of 4 hours or less. With this storage capacity 383 hours (56%) of the available 678 hours can be used for storage, which leads to 95 FEC for the considered year 2018. According to this information, for example, an electrode composition of nickel manganese cobalt oxide/lithium manganese oxide (NMC/LMO) or nickel cobalt aluminium oxide (NCA) would be sufficient for a period of 10 years and 950 cycles.24 Compared to lithium titanate (LTO), NMC/LMO and NCA have a significantly lower cycle lifetime but are also much cheaper in terms of investment.24
The exemplary use case can be expanded by further analyses that point out which storage technology fulfils the requirements for the case shown while being the most cost-effective. Furthermore, it is possible to roughly analyse the suitability of a preferred storage technology for the combination with a conventional power plant as in35 or other technical concepts that result in lower minimum loads and higher maximum loads as in.53
Additionally, it has to be mentioned that avoiding power plant shutdowns by using ESS for time shifting of energy can also be a potential business case. But as shown as an example in Figure 2, most of the considered power plants in this publication show downtimes greater than 20 hours and up to several hundred hours. Identical to long minimum load durations, these long downtimes would require a massive increase in storage capacity, which could lead to a sharp increase in investment with relatively low added value depending on the used technology. For this reason, the shutdowns were not considered further, although this does not exclude potential business cases but requires further analysis than has been done in this example.
6 CONCLUSION
This article provides statistical data of minimum load periods for an exemplary respective number of coal-fired power plants in Germany between 2016 and 2018 by using a methodology that is also applicable for other countries and generation technologies. Based on a specific load profile of 8760 hours, it is possible to identify the occurring number of minimum load periods and their respective duration by using upper and lower minimum load points for defining the minimum load range of the respective power generation unit.
When viewing the prepared load profiles, a significant share of hour-long minimum load periods was noticed. Their occurrence is not to be rated as inconsistent, but due to the hourly resolution and the possible reasons for the detection as shown in Figure 5 (top and center), it has to be interpreted. With a very high share of incorrect detections, this can influence the statistics significantly regarding the average numbers of minimum loads as well as the quartiles and the median. A higher resolution** of the actual power generation data of the specific generation units would lower the possible error rate of minimum load detections and increase the quality of the methodology. As this resolution is not available for the considered years, no quantitative statement can be made about the occurrence of these deviations.
Regarding the first question to be answered in this work from Section 1, the occurring number of minimum loads within the respective TSO area differs up to a factor of two to three (details per generation technology, see Table 7). Due to the quantity of considered plants per area, only the two transmission system areas of Amprion and 50Hertz are usable for comparison. In contrast to the number of minimum loads, the durations of all analyzed minimum loads show marginal deviations within the considered years. Regarding the areas, the durations for hard coal are longer as for lignite and the number of minimum loads is greater as well. Nevertheless, the number and the duration of minimum loads of hard coal– and lignite-fired generation units are aligning within all transmission system areas within this period. The analysis of the possible reasons for the difference in number and the slight divergence in duration are not in the scope of this work. For further research, presumptions based on meteorological, locational, and economic factors to explain the probable reasons for the differences were given in Section 4.3.
On behalf of the second question to be answered, a rough energy storage capacity was derived to enable an expanding of the overall bandwidth of operation by using the hard coal–fired power plant Westfalen Block-Unit E as an example. With a derived energy storage capacity of 6 hours around 494 hours (73%) of the 678 hours minimum load hours could be stored and shifted. This is equal to 82 full cycles for a storage technology with unrestricted use of 6 hours capacity.
The shown methodology and data are not limited to a single framework of coal-fired power plants in Germany but is suitable for comparing a larger number of generation technologies and control areas. Accordingly, further studies of various kinds of technologies in different countries would enable the comparison of minimum load behavior in diverse power generation mixes of the European integrated network. To discuss the presumptions which may lead to the differences of the minimum loads shown in Section 4.3 in more detail, the consideration of renewable energy feed-in and the use of grid simulations with a 15-minute resolution for the different control areas would be desirable in future studies.
ACKNOWLEDGEMENTS
This work was supported by the Federal Ministry for Economic Affairs and Energy of Germany (BMWi) under grant no. 03ET7068F (Kryolens). Open access funding enabled and organized by Projekt DEAL.
AUTHOR CONTRIBUTIONS
Marc Fiebrandt: Conceptualization, methodology, software, validation, formal analysis, investigation, resources, data curation, writing–original draft, writing—review and editing, visualization, and project administration.
Julian Röder: Conceptualization, methodology, validation, investigation, resources, writing—review and editing, supervision, and funding acquisition.
Hermann-Josef Wagner: Supervision and funding acquisition.


