Intrinsic brain network stability during kainic acid-induced epileptogenesis
Nastaran Jafari, Lingna He, contributed equally.
Abstract
Objective
Altered intrinsic brain networks have been revealed in patients with epilepsy and are strongly associated with network reorganization in the latent period. However, the development and reliability of intrinsic brain networks in the early period of epileptogenesis are not well understood. The current study aims to fill this gap by investigating the test–retest reliability of intrinsic brain networks in the early stage of epileptogenesis.
Methods
We used the rat intrahippocampal kainic acid model of mesial temporal lobe epilepsy. Three sessions of resting-state functional magnetic resonance imaging (rs-fMRI) data were acquired over a 2-week period from 9 sham control rats and 12 rats that later developed spontaneous epilepsy (KA). A group independent component analysis (GICA) approach was used to identify the intrinsic brain networks. Both within and between networks were identified, and test–retest reliability was assessed using the intraclass correlation coefficient (ICC).
Results
Our results showed good-to-excellent within-network stability of resting-state functional brain connectivity in most intrinsic brain networks in sham control rats and in the KA group, except for frontal cortex (FCN) and hippocampal networks (HPN). Further analysis of the between networks showed an increase in variation in the KA brain compared to the sham controls.
Significance
Overall, our study demonstrated a “moderately stable” phase of the intrinsic brain network in a 2-week latent period window, with an altered between- and within-network connectome feature.
Plain Language Summary
This fMRI study explored how brain connectivity changes in healthy animals compared to animals in the latent period of epilepsy. We found that functional connectivity increased during the latent period compared to the control group, and this increase persisted across all tested sessions. Additionally, brain networks became less stable in the epilepsy group, particularly in the frontal cortex and hippocampus. These observations provide further insight into how brain networks change and persist during the early stages of epileptogenesis.
Key points
- This study investigated the test–retest reliability of intrinsic brain networks in the early stage of epileptogenesis.
- Decreased stability of brain networks is spotted at the early stages of epilepsy development and could be a marker of epileptogenesis.
- An increase in connectivity within specific brain networks and a decrease in between-network connections were observed during the latent period.
1 INTRODUCTION
Temporal lobe epilepsy (TLE) is the primary form of focal epilepsy, often resistant to medication.1 It is linked with structural abnormalities in the temporal lobe and hippocampus. Recent functional MRI studies indicate seizures originating in the temporal lobe affect broader neural networks and connectivity.2-4 Advanced neuroimaging and electrophysiological methods have unveiled the impact of focal lesions on connected brain areas.5 Understanding changes in resting-state networks (RSNs) is crucial in clinical and animal models of TLE.4, 6 Three key questions persist: the properties of intrinsic brain network, their emergence timeline, and their stability over time.
Pre-clinical research using animal models provides important opportunities to explore the intrinsic brain network focusing on the latent period. The commonly utilized kainic acid (KA) model is considered a prominent animal model for refractory epilepsy. KA has the ability to interact with receptors on the postsynaptic membrane, leading to the initiation of excitatory postsynaptic electrical potential and the subsequent onset of seizure attacks.7 KA-treated animals showed enhanced global connectivity and a complete loss of hippocampal hubs, with new hubs emerging in the prefrontal cortex in the early period of epileptogenesis. Conversely, animals without epilepsy displayed reduced hubness in the hippocampus.5 A study with intraperitoneal KA (IPKA) rat model of TLE also found less connectivity, segregation, and integration than controls, as well as a correlation of seizure frequencies with high connectivity states and frequent transitions.8 Furthermore, changes in spatial and temporal functional connectivity patterns were observed in a posttraumatic epilepsy (PTE) mouse model7 with a reduction in connectivity strength in the dentate gyrus, thalamus, and other regions compared to sham animals.9 The persistent deficits were found in functional connectivity in areas with structural alterations, alongside unexpected widespread increases in connection strength.10
Test–retest reliability, assessed by the intraclass correlation coefficient (ICC), indicates measurement stability across repeated trials.11 Concerns exist regarding neuroimaging technique reliability, particularly in RSNs, which show lower reliability in TLE patients.12, 13 Recent studies highlight the effectiveness of test–retest designs in enhancing neuromodulation for neuropsychiatric disorders using MRI14 and enhancement in the reliability of resting-state functional magnetic resonance imaging (rs-fMRI) metrics in the anesthetized state.11
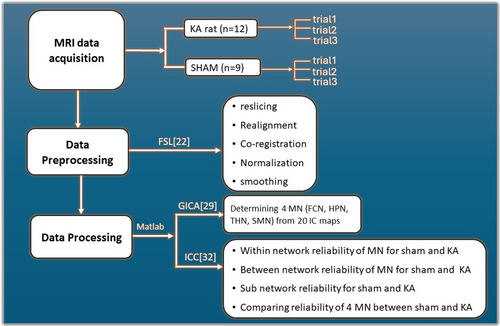
However, limited studies have investigated the stability of RSNs during epileptogenesis. To address this issue, we implemented a three-trial repeated test–retest design to investigate the reproducibility of resting-state brain networks in epileptogenesis by an animal model of intrahippocampal KA-induced TLE. The loss of neurons and gliosis triggered by glutamate excitotoxicity of KA lesions provides a promising model for simulating hippocampal sclerosis of TLE.15-17 The network analysis method, named group independent component analysis (GICA),18, 19 was implemented to identify the between- and within-network connectivity at the global and sub-network level. Based on recent research on epileptogenesis using different modalities such as diffusion tensor imaging (DTI)20 and electroencephalography (EEG),21 we hypothesize that KA-induced brain lesions will result in alternation of resting-state functional connections, both within and between networks, leading to instability throughout the latent period of epileptogenesis. The pipeline is structured into three main steps: (1) MRI data acquisition, (2) MRI data preprocessing, and (3) MRI data processing (Figure 1).
2 MATERIALS AND METHODS
2.1 MRI data acquisition
Twenty-one male Sprague–Dawley rats (200–350 g) were used to examine test–retest reliability. To assess the stability and reorganization of functional brain connectivity, sham control rats (n = 9) and rats that developed spontaneous epilepsy after KA treatment (n = 12) were selected. All experimental procedures were approved by the Institutional Animal Care and Use Committee (IACUC) of the University of California Los Angeles. Detailed KA treatment is described in Data S1.
Animal MRI experiments were performed at the UCLA Ahmanson-Lovelace Brain Research Institute using a Bruker Biospin 7 Tesla spectrometer on a console running Paravision 5.1 software (Bruker Corp., Billerica, MA). To assess functional brain network stability and reliability, we designed a protocol that included three trials of repeated scans for all animals with the same setup as described above. The first trial was performed 10 days after KA injection and was referred to as “trial1.” The second trial was performed between 0 h and 48 h after the first trial and was referred to as “trial2.” The third trial was performed between 48 h and 96 h after the first trial and was referred to as “trial3.” Each of the 21 rats had 3 scans for a total of 63 fMRI scans collected for this study. Sham control rats underwent the same procedure as KA rats, except for receiving the KA injection. Detailed information about rats' MRI data acquisition is described in Data S1.
2.2 MRI data preprocessing
Bruker raw data were first transformed and converted to the compressed Neuroimaging Informatics Technology Initiative (NIFTI) format. Preprocessing of the rs-fMRI data, including reslicing, realignment, co-registration, normalization, and smoothing, was performed using the FMRIB Software Library (FSL)22 and Data Processing Assistant for Resting-State FMRI (DPARSF)23, 24 in MATLAB (MathWorks) platform. Specifically, the first images within each session were resliced (slice time correction) and realigned (motion correction) to the initial image. Second, blood oxygenation level–dependent (BOLD) data were co-registered to the subject-specific anatomical T2-weighted image and normalized to a rat brain template based on25, 26 (bounding box = [−85 –112.5 −63.75; 83.75 111.25 62.5], unit in voxel) and resampled to 1.25 mm isotropic voxels. Third, the data were smoothed with a Gaussian kernel (full width at maximum = 6 mm), and all rs-fMRI data were band-pass filtered between 0.01 and 0.1 Hz to focus on spontaneous low-frequency BOLD signal fluctuations.27, 28
2.3 MRI data processing
2.3.1 Identification of main network (MN) using group ICA
Group-level BOLD-fMRI data were analyzed using GICA in the Group ICA of FMRI Toolbox (GIFT) Matlab software to identify MNs during brain resting state.29 This involved setting 20 independent components (ICs), conducting a two-step principal component analysis (PCA) reduction, and using the Infomax algorithm with ICASSO for component analysis.30 After ICA decomposition, manual signal, and noise identification, post-ICA decomposition further denoised the data.31 MNs were determined by reviewing ICA intensity maps (z-maps) for each component within a brain mask. ICs were classified based on spatial, temporal, and spectral features. Spatially, ICs localized in gray matter with patterns resembling known RSNs were classified as signals, while those overlapping ventricles, veins, or susceptibility artifacts were deemed noise. Temporally, components exhibiting sudden jumps, irregular oscillations, or high correlations with motion parameters were identified as noise. Spectrally, ICs dominated by low-frequency power (0.01–0.1 Hz) were retained as signal, while those with high-frequency or pan-spectral power were categorized as noise. Components not clearly aligning with standard RSNs were conservatively retained unless spatial, temporal, and spectral features strongly indicated noise. This process aimed to minimize signal loss while adhering to systematic and established practices to reduce subjectivity.
2.3.2 Identification of anatomical sub-networks within MNs
To compare between-network stability in sham control and KA rats, we identified anatomical sub-networks within the MNs. Regions of interest (ROIs) were chosen by overlaying the rat brain atlas with previously defined MNs.26 Normalized areas of coverage (AOCs) were computed by measuring overlap between atlas regions and MNs, divided by region volume. ROIs were identified based on AOC rankings, with those having >25% normalized AOC considered associated sub-networks of the MNs.
2.4 Statistics
The average functional connectivity strength (ICA intensity value) within each MN and its sub-networks was extracted from each rat for within-network stability analysis. Group-level means, and standard deviations of each MN and its sub-networks were computed. One-way analysis of variance (ANOVA) with Tukey's correction compared differences between trials within each group, while two-way ANOVA with Fisher's least significant difference (LSD) test examined group-level differences (sham control vs. epilepsy rats). For each MNs and sub-networks, statistical significance was set at p < 0.05.
To assess within-network test–retest reliability across trials, the ICC was utilized.32 The ICC values were influenced by group-level inter-trial and inter-subject variations, reflecting within-network stability. In this study, a three-trial one-way ANOVA under the ICC (1,k) model was optimal for assessing the within-network test–retest reliability, considering rats in each group as independent. Areas of significance were quantified using a threshold ICA value >1.0, and ICC values were calculated for each MN in both sham control and KA groups. The ICCs were computed using ICC = (MSB-MSW)/MSB, where MSB is the between-subject mean square and MSW is the within-subject (error) mean square. ICC values were classified as follows: <0.4 (low reliability), 0.4–0.6 (moderate reliability), 0.6–0.75 (good reliability), and 0.75–1.0 (excellent reliability).33
In addition, an unpaired t-test was used to compare the connectivity strength between the sham and epilepsy groups across trials. Statistical significance was set at p < 0.05.
3 RESULTS
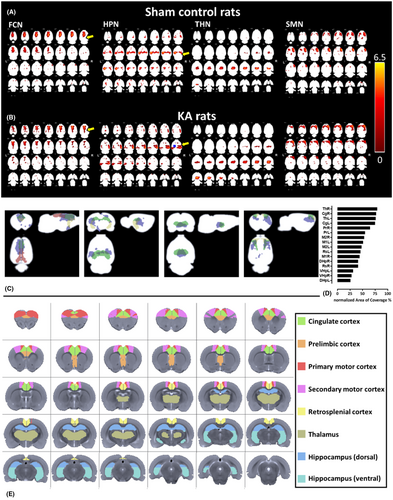
Brain imaging data were analyzed from 9 sham control rats and 12 KA rats that were later confirmed to have developed spontaneous seizures (epilepsy) (Figure 2). Despite successful acquisition of all MRI data from these animals, data with poor-quality image (two rats, ghost image artifacts) were visually identified and excluded from the database. The final database included 9 sham controls (n = 9) and 10 epilepsy rats (n = 10). The same analysis was performed on both groups.
3.1 Identification of MNs by GICA
Following the ICA classification criteria,31 we removed the noise and overlapping components in the group ICA results. To identify the MNs from the GICA result, we selected the brain areas that have been described in the normal rat resting-state brain,34 as well as in mesial TLE with hippocampal sclerosis (mTLE-HS).35 As a result, among all detected ICs (Figure S2) four MNs were identified (Figure 2), namely: (1) the frontal cortex network (FCN), which included the orbital, dorsal, middle, and ventral areas of the frontal lobe, as well as the retrosplenial cortex; (2) the hippocampal network (HPN), which included the dorsal and ventral hippocampus and the parahippocampal regions; (3) the thalamic network (THN), which includes the thalamus and hypothalamus; and (4) the sensorimotor network (SMN), which includes the primary and secondary motor cortex. These networks were either within the default mode network (DMN)34 or were major components of the thalamocortical network and/or hippocampal–prefrontal networks36 described in study of TLE.37
3.2 Identifications of sub-networks within each MN
To test for differences over smaller anatomical regions, we used ICA as a mask and combined a rat atlas26 to identify the sub-networks of MNs. The major sub-networks within the FCN were the cingulate cortex (Cg), prelimbic cortex (Pr), and retrosplenial cortex (Rs) (Figure 2C1). The major superimposed sub-networks within HPN were dorsal and ventral hippocampus (DHp, VHp) (Figure 2C2). The THN included portions of the thalamus (Th) (Figure 2C3). Finally, the main sub-networks within SMN were primary and secondary motor cortex (M1, M2) (Figure 2C4).
To identify the ROIs, we further quantified the AOC in the superimposed sub-networks. By ranking the AOCs in all sub-networks, the right thalamus (ThR) showed the highest AOC within the MNs (79%) (Figure 2D). AOCs in the following 15 selected sub-networks were as follows: CgR (77%), ThL (76%), CgL (75%), PrR (65%), PrL (55%), M2R (53%), M1L (51%), M2L (48%), RsL (46%), M1R (44%), DHpR (41%), RsR (41%), VHpL (31%), VHpR (28%), and DHpL (25%). The summarized atlas-based network sub-networks are presented in Figure 2E. Note that some sub-networks cover more than one MN, such as M1L.
3.3 MNs stability in sham and KA groups
For each network, the voxel-wise ICA intensity was used to compute the one-way random-effect model ICC (1, k) to assess the within-network test–retest reliability over three experimental trials. The group-level ICC results (with 95% confidence level) are presented in Table 1. Based on the classification criteria of ICC values,33 the sham control rats showed high test–retest reliability in all four MNs: FCN (ICC = 0.83), HPN (ICC = 0.61), THN (ICC = 0.73) and SMN (ICC = 0.69), indicating stable within-network connectivity within 1 week of the testing period. The KA rats showed moderate-to-good test–retest reliability on FCN (ICC = 0.46) and HPN (ICC = 0.34) and high test–retest reliability on THN (ICC = 0.84) and SMN (ICC = 0.64). None of the networks in KA rats showed low test–retest reliability. These results suggest that within-network connectivity in KA rats remains relatively stable across trials. However, ICC values in FCN and HPN were lower in the KA group compared to sham controls, suggesting that there is reduced stability in certain networks in KA rats (Figure 3C). As reported in our previous study,38 this could be due to (a) high inter-trial variations, (b) inter-subject variations, or both, within the KA group. We carefully investigated this issue in the following sections.
| Main network | FCN | HPN | THN | SMN | |
|---|---|---|---|---|---|
| SHAM (n = 9) | ICA | F (2, 18) = 0.48, p = 0.63 | F (2, 18) = 0.68, p = 0.52 | F (2, 18) = 0.40, p = 0.68 | F (2, 18) = 0.51, p = 0.61 |
| ICC | 0.83 | 0.61 | 0.73 | 0.69 | |
| KA (n = 12) | ICA | F (2, 27) = 0. 39, p = 0.68 | F (2, 27) = 0.29, p = 0.75 | F (2, 27) = 0.32, p = 0.73 | F (2, 27) = 0.16, p = 0.85 |
| ICC | 0.46 | 0.34 | 0.84 | 0.64 | |
| Sub-network | CgL | CgR | PrL | PrR | RSL | RSR | M1L | M1R | M2L | M2R | DHpL | DHpR | VHpL | VHpR | ThL | ThR | |
|---|---|---|---|---|---|---|---|---|---|---|---|---|---|---|---|---|---|
| SHAM (n = 9) | ICA |
F (2, 18) = 1.5 p = 0.24 |
F (2, 18) = 0.50 p = 0.61 |
F (2, 18) = 0.46 p = 0.63 |
F (2, 18) = 0.42 p = 0.66 |
F (2, 18) = 0.25 p = 0.78 |
F (2, 18) = 0.14 p = 0.86 |
F (2, 18) = 0.067 p = .93 |
F (2, 18) = 0.12 p = 0.89 |
F (2, 18) = 1.5 p = 0.26 |
F (2, 18) = 0.96 p = 0.40 |
F (2, 18) = 0.08 p = 0.91 |
F (2, 18) = 0.44 p = 0.65 |
F (2, 18) = 0.03 p = 0.96 |
F (2, 18) = 0.05 p = 0.94 |
F (2, 18) = 0.54 p = 0.59 |
F (2, 18) = 0.18 p = 0.83 |
| ICC | 0.45 | 1.01 | 0.27 | 0.56 | 0.17 | 0.36 | 0.85 | 0.54 | 0.25 | 0.89 | 0.40 | 0.27 | 0.25 | 0.28 | 0.49 | 0.66 | |
| KA (n = 12) | ICA |
F (2, 27) = 0.81 p = 0.45 |
F (2, 27) = 0.08 p = 0.91 |
F (2, 27) = 0.08 p = 0.91 |
F (2, 27) = 0.76 p = 0.47 |
F (2, 27) = 1.5 p = 0.23 |
F (2, 27) = 0.34 p = 0.71 |
F (2, 27) = 0.19 p = 0.82 |
F (2, 27) = 0.19 p = 0.83 |
F (2, 27) = 0.15 p = 0.85 |
F (2, 27) = 0.08 p = 0.92 |
F (2, 27) = 1.4 p = 0.27 |
F (2, 27) = 4.1 p = 0.02 |
F (2, 27) = 0.62 p = 0.54 |
F (2, 27) = 0.66 p = 0.52 |
F (2, 27) = 0.14 p = 0.87 |
F (2, 27) = 0.58 p = 0.56 |
| ICC | 0.67 | 0.42 | 0.45 | 0.25 | 0.47 | 0.41 | 0.19 | 0.18 | 0.3 | 0.50 | 0.49 | 0.23 | 0.32 | 0.49 | 0.11 | 0.29 | |
- ICC range: 0–0.4 (low reliability), 0.4–0.6 (moderate reliability), 0.6–0.75 (good reliability), and 0.75–1.0 (excellent reliability).
- Abbreviations: F, Statistic in the F test; p, p-value.

3.4 Sub-networks stability in sham and KA group
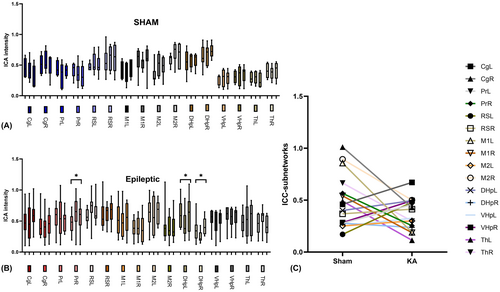
For each sub-network, the voxel-wise ICA intensity was used to compute the one-way random-effect model ICC (1, k) to assess the sub-networks test–retest reliability over three experimental trials. The group-level ICC results (with 95% confidence level) are presented in Table 1. The ROI-based ICA intensity study can provide a more detailed estimate of sub-network variations. There were no differences across trials with sub-network data in the sham control group (Figure 4A), which is consistent with the result of test–retest reliability (Figure 4C,A). Detailed analysis of KA group in sub-network ROI intensity across trials indicated that Trial 2 versus Trial 1 in the PrR, Trial 2 versus Trial 1 in the DHpL, and Trial 3 versus Trial 2 in the DHpR were significant (p = 0.06, p = 0.07, p = 0.08 respectively, Figure 4B) at the 90% confidence level.
3.5 Inter-trial variations in functional brain networks
Since the group-level variation analysis (as measured by group ICA analysis, Table 1) did not explain the decrease in reliability in the KA group, we further performed a trial-wise z-map analysis on the two networks (FCN and HPN) with low ICC values. We found identical spatial ICA patterns across trials, with no significant changes (p = 0.15) in either the FCN or the HPN (Figure 5A).
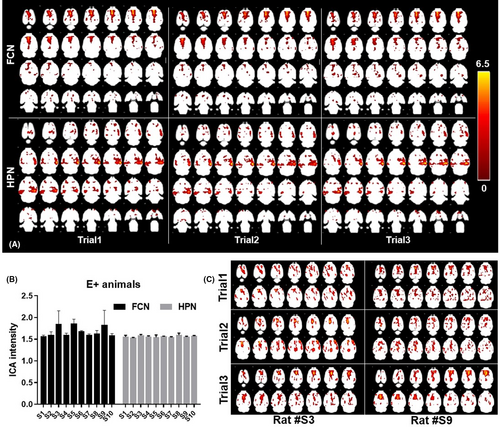
Based on the above finding, we then investigated the result stability focusing on the FCN and HPN in the KA group. There were no significant differences in across-trial, averaged ICA intensity within the FCN and HPN (Figure 5B). However, the individual examination showed a large inter-trial variation in rats S3 and S9. Imaging of the FCN ICA patterns in these two rats (Figure 5C) showed a diffuse ICA pattern in the first trial in rat S3 and the second trial in rat S9. After careful examination, we opted out of motion artifacts, as all motion correction curves were within acceptable limits (Figure S3).
3.6 Functional brain connectivity between groups
Further analysis was done to illustrate the functional connectivity dynamics across three trials in sham and epilepsy groups, providing insights into connectivity patterns, strength, and variability influenced by the experimental conditions.
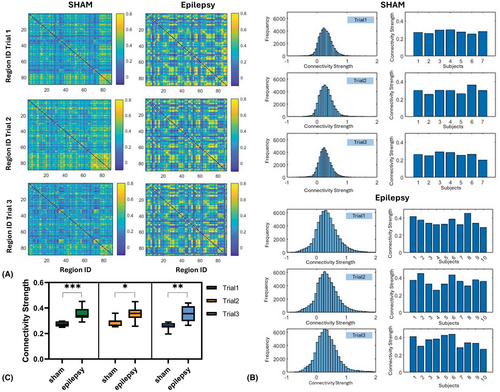
The connectivity matrixes (Figure 6A) highlight region-to-region connectivity strength across three trials in sham and epilepsy groups. In the sham group, connectivity remains relatively stable over the three trials, with lower connectivity observed. In contrast, the epilepsy group shows increased connectivity strength and more heterogeneous patterns across trials. Figure 6B illustrates the distribution of connectivity strength values and individual subject-level distributions of connectivity strength across Trials 1–3 for both sham and epilepsy groups. In the sham group, the distributions are narrower and symmetric, indicating lower variability and relatively stable connectivity strength across trials. In the epilepsy group, the histograms shift toward higher connectivity strength values and exhibit broader distributions, suggesting enhanced functional connectivity and increased variability in epileptic rats. The box plot in Figure 6C illustrates the connectivity strength for both groups across trials, showing significantly higher values in the epilepsy group compared to the sham group across all trials (Trial 1: p < 0.001, Trial 2: p = 0.023, and Trial 3: p = 0.001). These findings highlight the marked differences in neural dynamics and connectivity patterns during early epileptogenesis.
4 DISCUSSION
4.1 Identified functional brain networks in health and epileptic brain
Our data identified four consistently active networks during minimum effective dose (MED) sedation in both cortical and subcortical regions. Of 20 ICs, 4 remained consistent across subjects, termed “main networks” or “intrinsic brain networks.” The DMN,34 for instance, fragmented into several components included in the FCN, HPN, and parietal region of the SMN (Figure 2A,B), but we presented the original pattern without combining them. Notably, the DMN was further segmented into the prelimbic cortex, anterior cingulate cortex, retrosplenial cortex, and a segment of the CA1 hippocampus,34 all of which were evident in our MN subnetworks. Our data under MED sedation exhibited different network configurations compared to those under isoflurane anesthesia.34
The GICA z-map revealed a reduction in size within the retrosplenial cortex in KA brains (Figure 2, FCN, yellow arrow). A similar discrepancy was observed in the HPN, revealing a shift from a symmetric connectivity pattern to an asymmetric one, with a decrease in size on the lesion side and an increase on the contralateral side of the lesion (Figure 2, HPN, yellow arrow).
Our findings suggest that during the early stages of epileptogenesis, MNs in the frontal cortex and hippocampus exhibit greater sensitivity, as indicated by z-map size and color representing significantly connected regions and connectivity strength. Although similar animal studies are rare, a research group using intrinsic optical signal imaging (IOSI) in a rat model of epilepsy revealed reduced interhemispheric resting-state functional connectivity (rsFC) in frontal and temporal regions during the latent period.39 This finding supports the idea that disruption of intrinsic brain networks is an essential feature of epileptogenesis.
4.2 Assessing network stability in health and epileptic brain
In sham control animals, stable RSNs were observed at the main MN level, its sub-networks, and across the entire brain, consistent with findings in human40 and animal34 studies. To increase the scientific rigor of our evaluations, we implemented a three-trial protocol instead of the two-trial approach used in previous research.41 Inspired by recent advancements in 7 T MRI study42 examining temporal lobe subfields to identify different subfields of TLE, we investigated sub-networks within the MNs. Our findings confirmed that utilizing rs-fMRI with MED sedation is a reliable and effective method for conducting longitudinal experiments.
In the KA group, there is reduced inter-trial reliability of MNs (Figure 3C), particularly in the FCN and HPN networks, with ICC dropping to 0.4–0.6, contrasting with good-to-excellent ICC values >0.6 in the sham control group. These two networks showed significant alterations in their z-maps. The ICC analysis averages the mean ICA intensity across all voxels within the entire MN, potentially impacted by subdivision size.43 We were aware of this concern during the visual comparison of FCN and HPN within the KA group. We carefully assessed inter-trial individual variations, noting no apparent change at the z-map level or in mean ICA intensities across the three experimental trials.
4.3 Inter-trial variations of MNs in the epileptogenesis
Distinct variations in MNs within the KA brain were observed, corresponding to the simultaneous changes in network configuration depicted by the topographic representation of MNs (Figure 2). Minimal motion artifacts (Figure S3), allowed focus on inter-trial individual variations, revealing increased standard deviations in ICA intensity (Figures 3B and 4B). While not statistically significant, these variances collectively suggest reduced stability in KA brain MNs. Notably, our data did not exhibit the same level of instability seen in patients with mesial TLE (mTLE) compared to healthy subjects.44
Differences in data acquisition and analysis, such as longer scan durations in our study, 15 min scan duration repeated three times over a period of 1 week compared to a 5 min scan in theirs,45 may contribute to variations. Additionally, our focus on early epileptogenesis differs from their study on recurrent epilepsy. While variations in intrinsic brain networks were observed during the initial phase, they did not reach statistical significance. We have termed this phase as “moderately stable,” with the expectation that the network will eventually transition to an “unstable” phase44 as the intrinsic brain network evolves. This evolution is also one of the objectives of our further research.
Our findings of reduced inter-trial stability in the FCN and HPN networks within the KA group align with clinical studies that have identified disruptions in functional connectivity as potential biomarkers for seizure prediction. For instance, a study by Scheid et al. demonstrated that the strength and stability of EEG functional connectivity could predict seizure likelihood in patients with epilepsy.46 Additionally, recent research by Karoly et al. found that HPN activity could forecast epileptic seizures, highlighting the critical role of hippocampal connectivity in seizure prediction.47 These clinical insights suggest that monitoring the stability of specific networks, such as the FCN and HPN, may enhance our ability to predict and potentially mitigate seizure occurrences.
4.4 Insights of between group functional connectivity dynamics across trials
The observed differences in connectivity patterns and distributions between sham and epilepsy groups in Figure 6 provide important insights into the effects of the epilepsy intervention. Our data align with earlier findings that show an increased overall connectivity strength in the animals that later developed epilepsy.5, 48, 49 The increased connectivity strength and broader distributions in the epilepsy group suggest enhanced functional connectivity, likely driven by the epileptic condition and the epilepsy intervention. Interestingly, this high connectivity strength in the epilepsy group was preserved across all tested trials, suggesting that within a certain time window (e.g., at least 2 weeks) for the diagnosis of epileptogenesis, even as early as the weeks following the initial insult.
5 SUMMARY
This study examined the stability and reliability of resting-state functional brain networks in sham control animals and those developing epilepsy. Our results suggest a decrease in network stability during early epilepsy stages, transitioning to a “moderately stable” phase. Changes in network connectivity were noted during the latent period, with increased connections within specific networks and decreased between-network connections. These findings offer new insights into brain network characteristics and reliability in early epilepsy development.
ACKNOWLEDGMENTS
This study was supported by the National Institute of Neurological Disorders & Stroke R01NS065877 (A.B), R01NS116383 (N.H), 2RF1NS033310-27 (J.E), and 1R16-NS131108-01 (L.L).
CONFLICT OF INTEREST STATEMENT
The authors report no conflicts of interest. We confirm that we have read the Journal's position on issues involved in ethical publication and affirm that this report is consistent with those guidelines.
Open Research
DATA AVAILABILITY STATEMENT
The data that support the findings of this study are available from the corresponding author upon reasonable request.


