Effect of Treatment Voltage and Duration of Cold Plasma on the Oxidation Stability of Herring Oil and the Use of Vitamin E as Antioxidant
Funding: This work was supported by National Natural Science Foundation of China (No. 3207161197), General Projects of Key Industrial Chains in Shaanxi Province (2021NY-166, 2022ZDLNY04-02, 2023-ZDLNY-41), and Shaanxi Provincial Innovation Capacity Support Project (2022KJXX-79), and Processing and Demonstration Project of Weinan Special Agricultural Products (2022GD–TSLD–58-3,4).
ABSTRACT
Effects of cold plasma (CP) treatment voltage and duration on the oxidation properties of fish oil were investigated, and the protective role vitamin E (VE) in this process was evaluated. The results indicated that as the voltage and treatment duration of CP increased, the unsaturated fatty acids, particularly polyunsaturated fatty acids, in fish oil were degraded, leading to increased peroxide value, acid value, p-anisidine value, and malondialdehyde level. However, fish oil supplemented with VE exhibited strong antioxidant protection, particularly under high voltage and extended treatment conditions. VE effectively scavenged reactive oxygen species and free radicals, thereby mitigating oxidative degradation of the oil. This study provides new insights into the application of CP technology in high-fat foods and demonstrates the potential of VE as a natural antioxidant for enhancing oil stability.
Practical Applications: Cold plasma, with its effective surface disinfection capabilities, has shown significant potential in improving food safety, particularly in the processing of meat products and fats. However, excessive use of cold plasma may disrupt unsaturated fatty acids in oils, leading to the formation of harmful oxidation by-products that can negatively affect the quality and nutritional value of the oil. The various oxidation indicators of fish oil, color, fatty acid composition, and thermal properties were selected in this study to analyze the mechanisms by which oxidation is induced in fish oil by cold plasma. Additionally, the antioxidant effect of vitamin E as an additive during the cold plasma treatment process was also investigated in the study. Looking ahead, the combination of cold plasma technology and antioxidants is expected to enhance the safety of fat-based foods, extend shelf life, and preserve nutritional content, providing the food industry with more efficient, safe, and sustainable processing methods.
1 Introduction
Cold plasma (CP) is an environmentally friendly and sustainable technology that utilizes high-energy substances—such as free radicals, excited species, charged particles, and photons—to achieve its effects [1]. Its low-temperature characteristics, combined with high-efficiency microbial inactivation, make CP technology particularly suitable for applications in the food industry, effectively extending the shelf life of food products [2]. CP offers various advantages in food processing, including surface decontamination of food and related materials [3], modification of surface properties [4], and enhancement of mass transfer [5]. It is applied to the surface treatment of various foods, including meat, dairy products, fresh horticultural products, and granular foods like grains, herbs, and spices [6]. Additionally, CP is used for dry disinfection of germinated seeds [7]. The effectiveness of plasma treatment is affected by several factors, including the type of gas used, applied voltage, plasma generation method, the nature of the food material, and interactions with the food [8].
Fish oil, abundant in omega-3 polyunsaturated fatty acids (PUFA), such as eicosapentaenoic acid (EPA) and docosahexaenoic acid (DHA), is known for its potential to prevent stroke, depression, diabetes, cancer, and Alzheimer's disease [9]. However, due to the high degree of unsaturation in EPA and DHA, these fatty acids are susceptible to oxidation, which can lead to off-flavors and diminish the nutritional quality and safety of fat-containing foods [10]. Lipids are the main components of most foods, and hydrolysis and oxidative rancidity are the primary factors leading to lipid deterioration. Increased hydrolysis causes the breakdown of triglycerides, which lowers the smoke point and oxidative stability. However, lipid oxidation products (such as free radicals, polar compounds, flavor-producing compounds, long-chain fatty acids, organic acids, and various volatile compounds) may affect both the nutritional and technological properties and could potentially threaten consumer health [11].
In the food industry, the use of CP technology for sterilization or other treatments of high-fat foods presents a challenge as it can affect lipids. Research has explored the impact of CP on oils and high-fat foods. For example, Kim et al. [12] observed that dielectric barrier discharge treatment of pork loin inhibited microbial growth but also led to increased lipid oxidation, as indicated by higher TBARS values. Amanpour et al. [13] found that non-thermal plasma reduced lipoxygenase activity, aroma, and phenolic compounds in olive oil by 42.9%. Albertos et al. [14] reported that atmospheric pressure plasma treatment of herring reduced microbial growth but caused lipid oxidation and color changes. Ren et al. [15] studied the effect of atmospheric argon plasma on peanut oil quality, revealing alterations in peroxide value (PV), iodine value, acid value (AV), and brightness, with decreased levels of oleic and linoleic acids. Thus, although CP can be effective for surface decontamination and pathogen inactivation in high-fat products, it is essential to manage lipid oxidation to maintain product quality and safety.
Adding antioxidants is an effective way to prevent lipid oxidation. As discussed in the study by López [16], the effect of Minthostachys mollis essential oil and its combination with tert-butylhydroquinone (TBHQ) on lipid oxidation mechanisms was explored. It was shown that their combination influences the secondary reactions of lipid oxidation, resulting in a reduced formation of oxidation volatile compounds. Natural antioxidants, due to their higher safety, have broader application prospects in food. Essential oils of oregano and hops have been proven to improve the stability of high-oleic frying oils as natural antioxidants [17]. Vitamin E (VE), a selected antioxidant in this study, is a phenolic compound widely used in oils [18]. It is primarily sourced from common edible oils, such as corn oil, olive oil, palm oil, rice bran oil, and peanut oil [19]. VE can be classified into two forms: tocopherol and tocotrienol, with tocopherol containing a phytanyl side chain, whereas tocotrienol has an unsaturated side chain. The antioxidant effects of VE include quenching singlet oxygen as an oxygen scavenger and acting as a free radical scavenger to eliminate free radicals in the system, thus blocking the initiation and propagation stages of the lipid oxidation cycle [20]. As summarized by Shahidi [21], α-tocopherol exhibits the greatest ability to inhibit hydrogen peroxide formation at 100 ppm. Additionally, α-tocopherol inhibits hexanal formation in a concentration-dependent manner. Dolde et al. [22] studied the antioxidant capacity of α- and δ-tocopherol, as well as α-, δ-, and γ-tocotrienol (100–5000 ppm) in stripped corn oil. It was found that lower concentrations of α-tocopherol and α-tocotrienol were more effective in preventing hydrogen peroxide formation than higher concentrations, with pro-oxidant effects observed at concentrations >700 ppm. In contrast, δ-tocopherol, δ-tocotrienol, and γ-tocotrienol showed no pro-oxidant effects and exhibited antioxidant activity in a concentration-dependent manner.
However, the impact of CP on the oxidation stability of high-fat foods, especially fish oil, remains underexplored. Most studies on CP have focused on its antimicrobial effects, whereas the influence of CP on lipid oxidation, particularly in the presence of antioxidants, has not been thoroughly investigated. Additionally, although VE is a well-known antioxidant, its interaction with CP treatment to enhance the stability of fish oil has not been systematically studied [23]. Therefore, the effects of CP treatment voltage and duration on the oxidation stability of fish oil were aimed to be investigated in this study, and the potential protective role of VE in mitigating oxidation under varying CP conditions was evaluated. The impact of CP treatment conditions on the protective effect of VE is further analyzed. A deeper understanding of the complex interactions between CP, lipids, and antioxidants will be provided by this study, with new insights being offered for the future application of CP technology in preserving high-fat food products.
2 Materials and Methods
2.1 Materials
Herring fish oil (Sigma-Aldrich, 8002-50-4), with an initial PV of 0.65 mmol/kg and an initial AV of 0.44 mg/g, had the following fatty acid content: PUFA: 116.74 mg/mL, monounsaturated fatty acids (MUFA): 5.15 mg/mL, saturated fatty acids (SFA): 32.25 mg/mL. The natural tocopherol is primarily composed of α-tocopherol, with a content of 83.51 µg/mL. VE (50%) was purchased from Yuanye Biotechnology (Shanghai, China), it is a mixture primarily composed of four tocopherol isoforms: α, γ, β, and δ, with the remaining 50% consisting of a stabilizing filler (octenyl succinic anhydride-modified starch sodium) to stabilize the VE. Chemicals trichloromethane (≥99.0%), trichloroacetic acid, anhydrous ether(≥99.0%), 1,1,3,3-tetraethoxypropane, methanol (≥99.5%), 5,5-dimethyl-1-pyridine oxide (DMPO, 97%, Aladin), 14% boron trifluoride methanol solution (Aladin), 37 fatty acid methyl ester mixed in n-heptane (TM standard), all-cis-4,7,10,13,16,19-DHA methyl ester (TM standard), deuterated chloroform (D, 99.8% + 0.03% tetramethylsilane [TMS]).
2.2 Plasma Treatment
Herring fish oil and fish oil with added VE were subjected to CP (CTP-2000K, Nanjing Suman Plasma Technology) treatment, with varying voltages (30, 40, 50, 60, and 70 V) for 3 min, and different treatment durations (1, 3, 5, 7, and 9 min) at a constant voltage of 50 V. In this study, the amount of VE added was 0.2% of the fish oil's mass, with approximately 3.0 g of oil sample treated per trial. The samples were directly subjected to parameter testing after treatment, with untreated fish oil serving as the control group. Additionally, the effects of different voltages and treatment durations on both the directly treated fish oil and the fish oil treated with added VE were analyzed.
2.3 Physicochemical Indexes
The color of the fish oil was measured using a colorimeter (Colorimeter Ci7600, X-Rite, USA). The color analysis was represented by the parameters L* (lightness), a* (red-green intensity), b* (yellow-blue intensity), and c* (color saturation). The PV was determined using the titration method specified in GB 5009.227-2016. The AV was measured according to the procedure outlined in GB 5009.229-2016. The p-anisidine value (p-AV) was determined following the guidelines of GB/T 24304-2009. The malondialdehyde (MDA) content was assessed using the method described in GB 5009.181-2016. The integral oxidation value (INTOX) value was determined according to the method of Juncos [24].
2.4 Fatty Acid Composition
The fatty acid composition of fish oil was determined using gas chromatography (GC-2014C, Shimadzu, Japan). The fatty acid methylation of fish oil samples was carried out as follows: 0.1 g of fish oil was weighed into a test tube, followed by the addition of 2 mL of sodium hydroxide methanol solution (0.5 mol/L). The mixture was heated in a water bath at 65°C for 30 min. After cooling naturally, 2 mL of boron trifluoride methanol solution (14%) was added, and the mixture was heated again in the water bath at the same temperature for 3 min. After cooling, 2 mL of n-heptane and 2 mL of saturated sodium chloride solution were added, and the mixture was allowed to stand for phase separation. The supernatant was collected and dried with anhydrous sodium sulfate. The resulting methylated sample was then filtered through a 0.22 µm organic phase filter membrane [25].
The gas chromatography conditions were as follows: a DB-17 column (30 m × 0.25 mm, 0.25 µm) was used with a flame ionization detector (FID). High-purity nitrogen served as the carrier gas at a flow rate of 1 mL/min. The injection volume was 1 µL. The inlet and detector temperatures were set to 26°C and 275°C, respectively. The temperature program started at an initial column temperature of 60°C, held for 1 min, then increased to 180°C at a rate of 20°C/min, and finally increased to 240°C at a rate of 4°C/min, holding for 18 min.
2.5 1H NMR Spectroscopy
Approximately 100 mg of fish oil sample was thoroughly mixed with 600 µL of deuterated chloroform solution. The resulting solution was transferred to a 5 mm NMR tube. After sealing the tube with a cap, proton nuclear magnetic resonance (NMR) spectroscopy experiments were conducted using an NMR spectrometer (Avance neo 400 MHz, iProbes HR-liquids probe, SampleCase Sampler, Bruker Switzerland AG) following the method of Zhu et al. [26].
The experimental parameters were as follows: the scan temperature was set to 25°C, the spectral width was 8196.722 Hz, the number of scans was 16, the acquisition time was 3.9977 s, and the pulse sequence used was zg30.
2.6 Acquisition of Raman Spectra
A handheld Raman spectrometer (ATR6500, Aopu Tiancheng Optoelectronics, Xiamen, China) was used for the analysis, with a laser wavelength of 785 nm, power ≤350 mW, a scanning range of 200–4200 cm−1, and a scanning time of 10 s [27].
2.7 Analysis on Electron Paramagnetic Resonance (EPR) Spectrum
DMPO (500 mmol/L) was used as a spin trap agent. The oil sample was mixed with DMPO at a ratio of 5:2. After treatment with CP, the mixture was transferred to an EPR tube and placed in the resonance cavity of an EPR instrument (EMXmicro, Bruker BIAS, Germany) for testing [28]. Preparation of DMPO solution: DMPO was dissolved in toluene to a concentration of 500 mmol/L, and the prepared solution was placed in a brown bottle, sealed, and stored in a −20°C freezer away from light.
The measurement conditions were as follows: the center magnetic field was 3500.00 G, the scan width was 200.00 G, the scan time was 20.0 s, the microwave power was 6.325 mW, the modulation amplitude was 1.000 G, and the conversion time was 14.31 ms.
2.8 VE Content Analysis
The VE content in fish oil was determined using high-performance liquid chromatography (HPLC), following the method of Salama et al. [29] with slight modifications.
Sample preparation: A 1 mL fish oil sample is accurately weighed into a 2 mL brown vial, diluted with chromatography-grade n-hexane to a final volume of 2 mL, vortex-mixed, and filtered through a 0.22 µm organic membrane filter. The filtrate was used for HPLC analysis.
Instrumental conditions: CNW Athena Silica column (120A, 4.6 × 250 mm2, 5 µm); mobile phase consisted of n-hexane/isopropanol (chromatography grade, 98.5:1.5, v/v), flow rate: 1 mL/min; injection volume: 10 µL; isocratic elution; column temperature 25°C; UV detector wavelength at 295 nm. The total tocopherol content (µg(mL)) in herring fish oil was quantitatively analyzed using the external standard method [29].
2.9 Statistical Analysis
Statistical analyses were performed using IBM SPSS 17.0. The experiments were conducted in triplicate, and the mean values and standard deviations were calculated. Duncan's test (p < 0.05) was used to determine the mean differences between different experiments, and one-way analysis of variance (ANOVA) was employed for comparisons. Charts and graphs were generated using Origin 2018 software.
3 Results and Discussion
3.1 Physicochemical Indexes Analysis
Tables 1 and 2 present the variations in color parameters of fish oil under various processing conditions. As treatment time and voltage increased, the a* and b* values significantly rose, indicating a pronounced yellowing of the fish oil after treatment. Concurrently, the L* value decreased substantially, reflecting a gradual darkening of the oil. This color change is likely linked to the oxidation of the fish oil, where the oxidative degradation of free fatty acids and triglycerides results in the formation of stable carbonyl compounds. These compounds enhance the fish oil's absorption of visible light, leading to the observed color shift [30]. After adding VE to fish oil and subjecting it to further processing, the overall color change still exhibited a trend of yellowing and darkening. However, the L* of the oil samples with added VE was noticeably higher compared to those without VE under the same conditions. This indicates that the addition of VE effectively inhibited the action of reactive oxygen species (ROS) during the CP treatment. This effect is likely due to the presence of hydroxyl groups on the benzene ring of VE, which can donate single electrons and exhibit reductive properties [31].
| NAdd VE | Add VE | |||||||
|---|---|---|---|---|---|---|---|---|
| L* | a* | b* | c* | L* | a* | b* | c* | |
| CK | 97.05 ± 0.01a | −6.31 ± 0.02c | 18.99 ± 0.02a | 20.01 ± 0.02a | — | — | — | — |
| 30 V 3 min | 94.57 ± 0.08b | −6.48 ± 0.02a | 58.85 ± 0.12b | 59.21 ± 0.12b | 96.63 ± 0.55b | −5.57 ± 0.82a | 17.48 ± 0.01a | 18.50 ± 0.01a |
| 40 V 3 min | 93.96 ± 0.01c | −6.37 ± 0.02b | 59.83 ± 0.04c | 60.18 ± 0.04c | 97.37 ± 0.24c | −6.34 ± 0.32bc | 18.96 ± 0.83b | 20.00 ± 0.88b |
| 50 V 3 min | 93.05 ± 0.05d | −5.60 ± 0.02d | 62.35 ± 0.03d | 62.60 ± 0.03d | 98.87 ± 0.01d | −6.74 ± 0.01cd | 23.77 ± 0.02c | 24.71 ± 0.02c |
| 60 V 3 min | 90.64 ± 0.01e | −2.75 ± 0.01e | 87.82 ± 0.04e | 87.86 ± 0.04e | 96.79 ± 0.01b | −7.06 ± 0.01d | 33.49 ± 0.02d | 34.23 ± 0.02d |
| 70 V 3 min | 88.27 ± 0.19f | 3.57 ± 0.02f | 93.69 ± 0.04f | 93.76 ± 0.04f | 94.24 ± 0.01a | −5.78 ± 0.01ab | 59.24 ± 0.03e | 59.52 ± 0.03e |
- Note: “NAdd VE” refers to fish oil without added VE, whereas “Add” refers to fish oil with VE added before treatment. Differences between values with different letters (a–f) in the same column are statistically significant (p < 0.05).
- Abbreviation: VE, vitamin E.
| NAdd VE | Add VE | |||||||
|---|---|---|---|---|---|---|---|---|
| L* | a* | b* | c* | L* | a* | b* | c* | |
| CK | 97.05 ± 0.01a | −6.31 ± 0.02b | 18.99 ± 0.02a | 20.01 ± 0.02a | — | — | — | — |
| 50 V 1 min | 94.01 ± 0.02b | −6.47 ± 0.02a | 52.74 ± 0.03b | 53.14 ± 0.03b | 98.41 ± 0.01b | −6.36 ± 0.01b | 19.62 ± 0.02b | 20.62 ± 0.01b |
| 50 V 3 min | 93.05 ± 0.05c | −5.60 ± 0.02c | 62.35 ± 0.03d | 62.60 ± 0.03d | 98.87 ± 0.01a | −6.74 ± 0.01c | 23.77 ± 0.02c | 24.71 ± 0.02c |
| 50 V 5 min | 91.88 ± 0.01d | −4.97 ± 0.02d | 62.04 ± 0.05c | 62.04 ± 0.05c | 97.89 ± 0.02c | −7.01 ± 0.01f | 27.97 ± 0.03d | 28.83 ± 0.03d |
| 50 V 7 min | 90.58 ± 0.02f | −5.60 ± 0.03c | 72.59 ± 0.02e | 72.59 ± 0.02e | 97.00 ± 0.04e | −6.93 ± 0.01d | 28.13 ± 0.01e | 28.97 ± 0.01e |
| 50 V 9 min | 90.74 ± 0.03e | −3.17 ± 0.02e | 83.77 ± 0.14f | 83.77 ± 0.14f | 96.01 ± 0.04f | −6.95 ± 0.01e | 37.63 ± 0.02f | 38.26 ± 0.02f |
- Note: “NAdd VE” refers to fish oil without added VE, whereas “Add” refers to fish oil with VE added before treatment. Differences between values with different letters (a–f) in the same column are statistically significant (p < 0.05).
- Abbreviation: VE, vitamin E.
The PV, AV, anisidine value (p-AV), and MDA content are all indicators of lipid oxidation. Figure 1 shows the changes in these physicochemical parameters of fish oil under varying treatment voltages and durations. The results revealed a general upward trend in the PV, AV, p-AV, and MDA content as both voltage and treatment time increased. This increase can be attributed to the generation of reactive species, such as free radicals and high-energy electrons, during treatment, which react with oxygen in the oil, thereby accelerating oxidation [15]. Notably, when the voltage reached 60–70 V and the treatment time extended to 7–9 min, there was a pronounced increase in the AV and p-AV. This may be due to the intensified CP treatment, which likely caused lipid molecules to fragment and reorganize, releasing more free radicals and accelerating the oxidation of the fish oil [32].
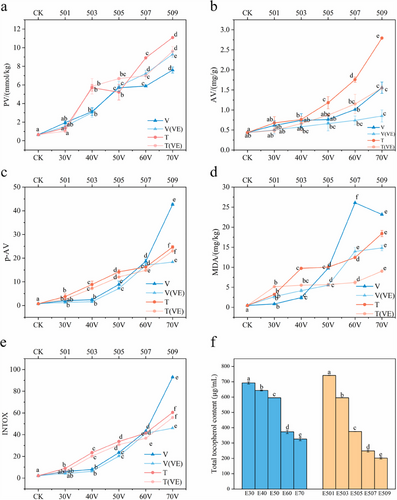
The physicochemical indices of fish oil with added VE were generally lower than those of fish oil without antioxidants before treatment. This protective effect of VE became more pronounced as the treatment voltage and duration increased. However, it is worth noting that, as shown in Figure 1a, with the increase in treatment voltage, the PV of fish oil with added VE gradually exceeded that of fish oil without VE. This is due to excessive deterioration in the control group [24]. To more accurately reflect the oxidation level of fish oil during the treatment process, the INTOX value can be further analyzed, as it is useful for determining advanced oxidation processes. From Figure 1e, it can be seen that as the treatment level increases, oxidation products in the fish oil gradually accumulate, and the presence of VE plays an effective antioxidant role. Additionally, a decrease in the MDA content was observed in the later stages of treatment, which may be due to the decomposition of MDA under prolonged treatment conditions, resulting in a reduction in its concentration.
The VE content in the fish oil after CP treatment is shown in Figure 1f. With the increase in treatment voltage and time, the VE content in the fish oil samples decreased from 692.02 and 740.71 µg/mL to 326.07 and 201.78 µg/mL, respectively. This decrease is primarily due to the reaction between VE and reactive species such as hydroxyl radicals (•OH), ozone (O3), and superoxide anion (O2−) generated by the CP equipment during treatment [33]. Additionally, PUFA in the fish oil generate lipid radicals (L·) during plasma treatment, and VE, as an antioxidant, is preferentially consumed [34].
3.2 Fatty Acid Composition Analysis
The fatty acid composition of the fish oil after CP treatment is detailed in Tables S1–S4, whereas the contents of SFA, MUFA, and PUFA are illustrated in Figure 2. The data in Figure 2 indicate that with the increase in CP treatment voltage and time, the content of SFA in fish oil gradually increased, particularly for palmitic acid (C16:0) and stearic acid (C18:0) (Tables S1 and S2). Conversely. The PUFA content, especially linoleic acid (C18:2), significantly decreased. With the increase in treatment voltage and time, the significant reduction in PUFA content indicates that the stability of these PUFAs gradually decreases under the conditions of increasing CP treatment. This is similar to the findings of López et al., where the PUFA content gradually decreased with increasing treatment conditions [35]. This is because the hydrogen atoms at the diene positions in PUFAs are easily attacked by free radicals, leading to the formation of aldehydes. Therefore, as the voltage and treatment time for the fish oil increase, more free radicals are generated, which attack the conjugated dienyl groups in the unsaturated fatty acids of the fish oil samples [36]. In addition, during the treatment process, the cleavage of C═C bonds in long-chain fatty acids releases low-boiling-point fatty acids and forms primary and secondary oxidation products, thereby reducing the concentrations of PUFA, MUFA, and SFA per unit volume of fish oil [37], which is consistent with the experimental results. It further demonstrates that with the increase in treatment time and voltage, the values of PV, AV, p-AV, and MDA in fish oil show a significant increasing trend.
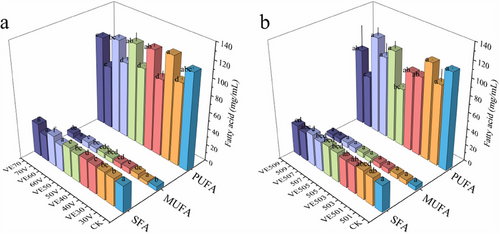
During the CP treatment process, the addition of VE to fish oil exhibited significant antioxidant protective effects. As shown in Figure 2, VE, through its phenolic hydroxyl group, acts as an efficient hydrogen donor, preferentially scavenging ROS (such as •OH, O2−), and forming stable phenoxyl radicals (VE-O•), thereby blocking the lipid oxidation chain reaction [38]. The decrease in VE content further supports this observation. Therefore, the presence of VE helps fish oil maintain higher levels of PUFA under increased low-temperature plasma treatment conditions.
3.3 1H NMR Spectroscopic Analysis
The use of proton NMR (1H NMR) allows for the determination of chemical shifts of different proton types in fatty acids. By establishing a correspondence between various protons and their respective fatty acids, this technique enables the rapid and accurate quantification of the content of each type of proton in oil samples. This study was based on the method outlined by Tan et al. [39]; the 1H NMR spectra of the fish oil samples were analyzed, and the peaks were labeled from A to M. Peak B, observed at 0.97 ppm, corresponds to the terminal methyl group of omega-3 fatty acids. Peak J, within the range of 2.64–3.00 ppm, represents the allylic hydrogens, whereas Peak L, at 5.20–5.27 ppm, denotes the sn-2 hydrogens on the triglyceride backbone. Using the approach described by Tan et al. [39], we calculated the ratios RBAG and RO3TG. RBAG is defined as the ratio of the signal intensity of allylic hydrogens to that of sn-2 glycerol hydrogens, whereas RO3TG is the ratio of the signal intensity of omega-3 terminal methyl hydrogens to sn-2 glycerol hydrogens.
Figure 3 shows that as the CP treatment voltage and time increase, the RBAG and RO3TG values of the fish oil exhibit a downward trend. Under conditions of lower treatment voltage and shorter treatment time, the RBAG and RO3TG values decrease rapidly at first, and then the decline slows down in the later stages of treatment. This decrease can be attributed to the selective extraction of hydrogen in lipid molecules, particularly at the allylic C─H bonds, such as those in diene-allylic C─H bonds. These C─H bonds are highly reactive and easily replaced by free radicals. The loss of allylic hydrogen leads to the disruption of the cis-double bond structure in PUFA, which in turn triggers lipid radical chain reactions. Moreover, the terminal methyl hydrogens of omega-3 PUFA do not directly participate in the oxidation process; their levels only decrease when the fatty acid structure is damaged, which leads to the formation of complex secondary or tertiary oxidation products [37].
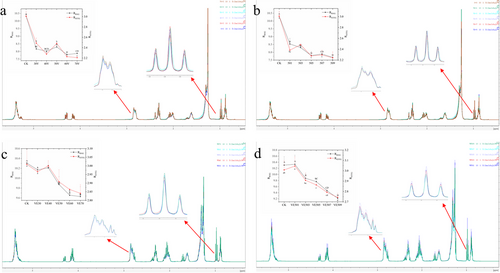
In contrast, with the increase in CP treatment voltage and duration, fish oil supplemented with VE also showed a decline in RBAG and RO3TG values, but the decrease was relatively smaller. This observation indicates that VE plays a protective role during CP treatment by supplying hydrogen atoms. Under the same treatment uconditions, the RBAG and RO3TG values of VE-supplemented fish oil were higher, further confirming the antioxidant effect of VE. Therefore, VE helps preserve the hydrogen atoms in the fatty acids of fish oil, maintaining its structural integrity and reducing significant damage.
3.4 Raman Spectra Analysis
Raman scattering lines are independent of the incident light wavelength and are only related to the vibrational and rotational energy levels of the sample. Therefore, studying Raman spectra can provide information about the relevant molecular vibrations or rotations. The Raman spectrum of the fish oil sample is shown in Figure 4. It can be observed that as the sample treatment conditions change, the Raman intensity of the fish oil varies. The characteristic Raman spectral regions of the sample include the stretching vibration peak of the ─(CH2)n─ group (865 cm−1); the bending vibration peak of the cis double bond (═C─H) (970 cm−1); the bending vibration peak of the trans double bond (═C─H) (1265 cm−1); the bending vibration peaks of the methylene (─CH2─) group (1300 and 1442 cm−1); the stretching vibration peak of the cis double bond (C═C) (1655 cm−1); and the stretching vibration peak of the ester bond (─C═O) (1747 cm−1) [40]. As the treatment level increased, the Raman signal intensity of the trans double bonds in the unsaturated fatty acids of fish oil at 970 cm−1 decreased, whereas the signal intensity of the cis double bonds at 1265 cm−1 also gradually weakened. These changes were attributed to the increased degree of oxidation during the processing of fish oil, which led to the degradation of unsaturated fatty acid molecules, particularly the reduction of cis double bonds. The cis double bonds tended to rearrange into more stable trans double bond structures [41]. This observation was further supported by the gas chromatography results, which indicated a decline in the unsaturated fatty acid content of the fish oil as the treatment level increased.
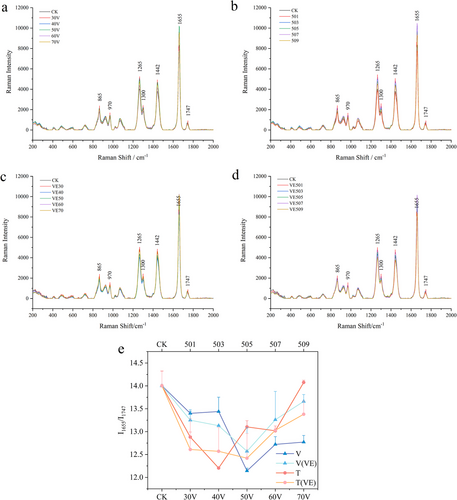
In this study, the Raman signal at 1655 cm−1 (corresponding to the cis double bond C═C) was selected as the characteristic signal, whereas the ester bond signal at 1747 cm−1 served as the reference signal. The degree of oxidation of the fish oil was represented by the ratio I1655/I1747. As shown in Figure 4e, with the increase in treatment voltage and time, the overall trend of I1655/I1747 first decreased and then increased, indicating a reduction in the total unsaturated fatty acid content, which is consistent with the results of the fatty acid composition analysis. Furthermore, the I1655/I1747 value of the fish oil samples showed a turning point at a voltage of 50 V and a treatment time of 3 min, after which it started to increase, suggesting that the ester bonds may have begun to break at this point. For the fish oil samples with added VE, the trend of I1655/I1747 remained unchanged. However, it was observed that VE began to show its effect in the later stages of treatment, especially when the voltage exceeded 50 V. VE effectively reduced the continuation of lipid chain reactions during the oxidation process of fish oil [41].
3.5 Radical Species Analysis
EPR spectroscopy is a highly effective and direct method for detecting free radicals, which are chemical substances with unpaired electrons [42]. In this study, DMPO was employed as a trapping agent to capture free radicals. DMPO reacts with free radicals at the α-carbon position of its nitrogen atom, forming a stable DMPO-free radical adduct. Key parameters for identifying the types of free radicals include the nitrogen (a-N), β-hydrogen (a-H β), and γ-hydrogen (a-H γ) atoms [28]. Figure 5a,b shows that the peak height represents the signal intensity of the captured free radicals. The shape of the peak indicates that the captured free radical is singlet oxygen (DMPO-1O2), and this shape remains consistent throughout the measurements. As the CP treatment voltage and time increased, the peak intensity continued to rise, and the peak area continued to expand, indirectly reflecting an increase in the amount of DMPO-1O2. This suggests that high-energy electrons generated during the CP treatment interacted with molecules in the fish oil sample, leading to the progressive breakdown of fat side chains and oxygen-containing functional groups [43]. However, when the voltage reached 70 V and the treatment time extended to 9 min, a decline in DMPO-1O2 levels was observed. This decrease may be attributed to interactions between newly generated free radicals and existing DMPO free radical adducts, which could lead to terminal reactions among the radicals. In addition, as the treatment voltage and time continued to increase, the ongoing formation of oxidation products such as aldehydes and ketones may have increased the viscosity of the oil, thereby reducing the efficiency of DMPO capture [44].
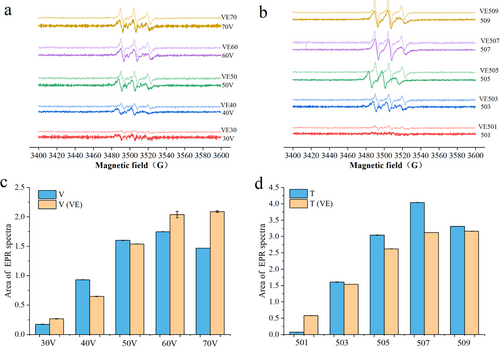
As shown in Figure 5c,d, under the same treatment conditions, the DMPO-1O2 content in fish oil samples with added VE was lower than that in fish oil samples without VE. This result suggests that VE exhibits antioxidant properties during the CP treatment, further confirming that it delays the oxidation of the oil by slowing down the free radical chain reactions. Meanwhile, as the treatment voltage and time increased, the DMPO-1O2 content in the fish oil with added VE showed an overall upward trend, with little decrease in the later stages of the treatment. This indicates that VE continues to play a role in scavenging free radicals under high voltage and long treatment conditions, resulting in lower levels of oxidation products such as aldehydes and ketones, and allowing the sample to maintain a lower concentration and continue to capture free radicals. Additionally, it is possible that as the treatment time and voltage increased, VE reacted with the generated singlet oxygen to form additional free radicals. High voltage may also have damaged the structure of VE, leading to higher levels of free radicals detected in the EPR analysis [45]. This observation was consistent with previous finding.
4 Conclusions
This study investigated the effects of increasing CP treatment voltage and duration on the oxidation level of fish oil, while also analyzing the impact of voltage and time on the protective effects of VE. Experimental data showed that as the CP treatment voltage and time increased, the color of the fish oil gradually darkened, and the L* value decreased. EPR analysis clearly demonstrated an increase in the concentration of singlet oxygen in the fish oil, which accelerated the degradation of unsaturated fatty acids, particularly long-chain PUFA. As a result, gas chromatography data revealed a decreasing trend in the concentration of unsaturated fatty acids as the treatment intensity increased. The reduction in unsaturated fatty acid concentration further led to a gradual increase in PV, AV, p-AV, and MDA levels, indicating a progressive intensification of oxidation.
However, the addition of VE significantly mitigated these oxidation processes, demonstrating its protective effect against oxidative degradation under various CP conditions. Overall, this study contributes to the development of innovative, non-thermal technologies for food preservation, offering a sustainable and efficient strategy to improve the quality and shelf life of omega-3 rich oils and other high-fat foods. Further investigation is needed to determine the optimal concentration of antioxidants and explore the synergistic effects of multiple antioxidants on CP-treated fish oil.
Conflicts of Interest
The authors declare no conflicts of interest.
Open Research
Data Availability Statement
Data will be made available on request.


