Comparison of Nile Red and Cell Size Analysis for High-Throughput Lipid Estimation Within Oleaginous Yeast
Abstract
With growing interest in oleaginous yeast as producers of future fuels and bulk chemicals, a robust, high-throughput method for estimating lipid production is required. Although the lipophilic dye Nile red is frequently used to assay large samples of yeast and microalgae, inconsistent stain permeability between species and strains limits its effectiveness for some microorganisms. In this study, the oleaginous yeast Metschnikowia pulcherrima is used to develop a fluorescence-free, cell-size-based image analysis method for estimating lipid production, which is then compared with an optimized Nile red method across several experimental scenarios. Cell size analysis (CSA) outperforms Nile red in all scenarios, correlating well with lipid extraction data when screening multiple strains, screening a subset of strains grown in different conditions, and tracking the lipid accumulation of a culture over time. Stain permeability is shown to vary significantly among the strains trialled, with lipid droplet size and cell wall thickness having a deleterious effect in the permeability of high-lipid-accumulating cells. CSA can also allow culture population dynamics to be monitored, providing key process information of cell size distribution in response to changing media compositions.
Practical Applications: Nile red is currently the go-to method for high- throughput lipid screening; however, staining inconsistencies in some organisms caused by varying cell morphology makes it challenging to optimize a robust protocol. Although fluorescence-free methods exist (Raman spectroscopy, Fourier-transform infrared spectroscopy, GCMS), the need for extensive sample preparation and specialist equipment restricts their widespread adoption. The CSA method presented here offers an accurate, robust, and cheap alternative for the study of microorganisms where fluorescence-based avenues are not feasible. Furthermore, the population dynamics collected during CSA can easily be applied to bioreactor style processing, where tracking size distributions can provide real time information of culture status. This additional information is valuable even if fluorescence screening is a possibility.
1 Introduction
Microbial lipids produced by oleaginous organisms represent a sustainable alternative to fossil-derived fuels and chemicals. Furthermore, due to their comparable lipid profile, oil produced by oleaginous yeasts represents a viable replacement for plant oils, and because of the increasing biotechnological interest in this area, there is a growing need for fast and reliable screening methods of lipid production.1 As the widely used, Bligh and Dyer method of lipid extraction and quantification is not suitable for high-throughput analysis, lipid screening methods have instead largely focused on fluorescent staining. Among oleaginous yeasts, Nile red is the most commonly used lysochrome due to its high specificity for neutral lipid, allowing spectrofluorometric assays to be developed.2 Though unable to provide a quantitative mass ratio, methods developed to include a trioelin standard curve have allowed for quantitative analysis and comparison of assayed samples.3
Despite its widespread use, inefficient dye permeation and the need for method optimization influence the reliability and efficacy of fluorescence staining protocols. Permeation issues reported within oleaginous yeasts and microalgae are likely to be caused by differential cell size, lipid droplet size/number, protein–dye interactions, and most of all, cell wall thickness.2, 4 The influence of cell wall thickness on dye permeation is particularly significant here, as both lipid accumulation and cell wall thickening are known to occur during the stationary phase of yeast.5, 6 Indeed, poor correlations with lipid extractions are reported within macroalgae when staining samples at different growth stages.7 Furthermore, during the development for an improved Nile red fluorescence assay, Sitepu reported a high variability in the time required for different species to reach maximum fluorescence emission, in addition to inconsistencies as to whether the addition of dimethyl sulfoxide (DMSO) as a stain carrier yielded an increased measurement.2 A similar observation was found within microalgae, where Balduyck reported method optimization as species dependent.8
Non-spectrofluorometric extraction-free lipid assays using flow cytometry or image analysis have been published; however, as they also require fluorescence staining, it follows that inconsistent dye permeation can still limit their reliability with some organisms.9, 10 Fluorescence free methods on the other hand often require specialist equipment such as Fourier Transform Infrared spectroscopy, Raman spectroscopy, or time-domain NMR, as well as extensive sample preparation.11-13
The aim of the present study was therefore to develop a high-throughput method of lipid estimation, which does not require fluorescence or specialized equipment. To do this, this study will use image analysis to evaluate whether cell size data correlate with traditional lipid accumulation data by testing it across following three experimental scenarios in which an accurate, reliable high-throughput method of lipid estimation would be advantageous: i) screening multiple strains; ii) screening a subset of strains under two culturing conditions; and iii) tracking lipid accumulation in a single culture over time. An optimized Nile red assay will also be evaluated across the same scenarios to draw a comparison between this, and the method developed within this study as ways to estimate lipid accumulation.
2 Experimental Section
2.1 Chemicals
Unless otherwise stated, chemicals were sourced from Sigma–Aldrich and used without further purification.
2.2 Strains, Strain Maintenance, and Media
Six Metschnikowia pulcherrima strains representing different morphologies and lipid production were used throughout this study. ICS1, ICS46, and ICS48 were isolated in Bath, UK from blackberry fruits. NCYC2580 was sourced from the National Collection of Yeast Cultures. 4 × 3 and F3 were strains derived via adaptive evolution of an NCYC2580 progenitor. Strains were maintained on malt extract agar (MEA) plates, and re-streaked on a fortnightly basis. For the preparation of overnight cultures, a single colony was inoculated into 5 mL SMB pH 5 (3% tryptic soy broth, 2.5% malt extract), and incubated at 25 °C with 200 rpm agitation. Optical densities were measured at 595 nm. Nitrogen limited medium (NLB) was prepared as follows: glucose 40 g L–1, (NH4)2SO2 2 g L–1, KH2PO4 7 g L–1, MgSO4 7H2O 1.5 g L–1, NaHPO2 2 g L–1, and yeast extract 1 g L–1. This media was autoclaved without glucose or MgSO4, which was added separately after autoclaving individual stock solutions. Yeast nitrogen base (YNB) medium was prepared as follows: 1.78 g L–1 Yeast Nitrogen Base without amino acids, 25 g L–1 glucose, and variable amounts of (NH4)2SO2 per desired concentration.
2.3 Screening Experiments
To screen for lipid production, overnight cultures were washed with phosphate-buffered saline (PBS) and diluted to an optical density (OD) ≈1. A total of 500 mL of diluted culture was used to inoculate 10 mL NLB or YNB depending on experiment. Cultures were incubated for 7 days at 25 °C with 200 rpm agitation.
2.4 Lipid Extraction
The lipid extraction methodology is based upon that proposed by Bligh and Dyer,14 and modified to the following:
Upon completion of culturing, 9 mL of cells were centrifuged at 13 000 rpm, resuspended in 1 mL PBS, and centrifuged again, discarding the supernatant, and freezing cell pellets instantly in liquid nitrogen. Following this, frozen cell pellets were freeze dried at −40 °C for a minimum of 6 h. For the cell disruption, a pre-weighed amount of cell pellet (ideally within the range of 10–100 mg) was mixed with 10 mL 6 m HCl and stirred at 80 °C for 1 h. To extract lipids, 10 mL of chloroform:methanol (1:1) was added, and the mixture was stirred overnight at room temperature. To quantify the lipid weight, the lower chloroform phase was removed by hand with a glass pipette, avoiding the emulsion layer that forms between the chloroform and aqueous phase. The chloroform was then fully evaporated via rotary evaporator, and the remaining lipids were weighed to determine the lipid wt% of the cells.
2.5 Nile Red Assay
Nile red staining assay was an optimized version of that published by Sitepu,2 briefly:
Cells were harvested after 7 days and an aliquot of cells was adjusted with PBS to an OD ≈1. This dilution was then spun and resuspended in fresh experimental media. For the standard curve, glycerol standard solution (2.5 mg mL–1 equivalent triolein concentration) and isopropanol was added to 200 µL of blank experimental media in triplicate to a black 96-well plate. The standard curve prepared represented a linear range between 20 and 200 mg L–1. For the samples, 200 µL of each diluted culture was added in triplicate to the 96-well plate to which 40 µL DMSO was also added. Nile red at a final concentration of 15 µg mL–1 was added to the standards and samples followed by incubation at 30 °C for 10 min. Fluorescence was read with excitation at 530/25, emission 590/35, kinetic readings taken for 20 min with 60 s intervals with shaking throughout. Fluorescence values were corrected by cell count as determined by Fast-Read 102 counting slides.
2.6 Cell Size Analysis
-
Maximum and minimum size was set from “10-Infinity” to exclude any non-cell debris from the analysis.
-
Circularity was set from 0.75 to 1.00 to exclude instances where cells are in contact with each other.
-
“Exclude on edges” was selected to omit cells cropped by the edges of the image.
-
“Include holes” was selected to only measure the perimeter of the cells, rather than internal areas created by lipid droplets.
3 Results
3.1 Nile Red Optimization
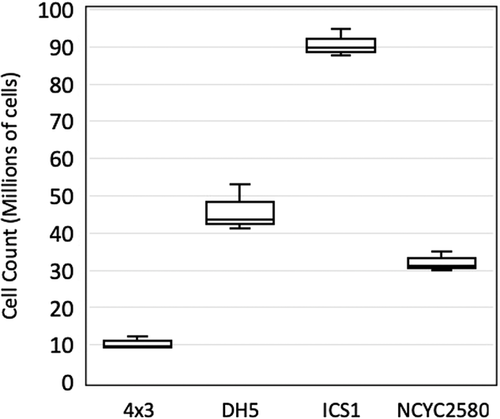
Starting from the Nile red staining protocol published by Sitepu,2 a series of optimization steps were performed with different strains of M. pulcherrima, which incorporated high and low lipid acumulators based on mass ratio measurements from traditional extraction. To improve normalization of fluorescence measurements, the ratio between optical density and cell count for four strains of M. pulcherrima was compared (Figure 1). 4 × 3 was found to have a cell count substantially lower than the highest strain ICS1 (1.03 × 10⁷ and 9.05 × 10⁷, respectively) when diluted to an OD 1 ± 0.05. The cell count of DH5 and NCYC2580 was higher than that of 4 × 3, though still far below the count for ICS1.
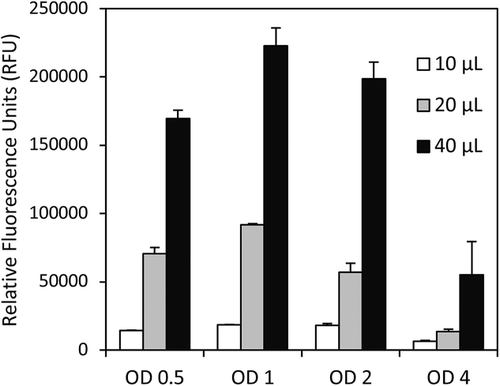
Optimization of DMSO and cell concentration was performed using 4 × 3, the highest lipid producing strain (Figure 2). A clear correlation was present between increasing fluorescence measurement and increasing volumes of DMSO added, with each sample achieving maximum fluorescence at 40 µL DMSO. Cellular concentrations between OD 1 and 2 gave the highest values, indicating this as an optimum range. Increasing or decreasing from this range decreased the fluorescence response.
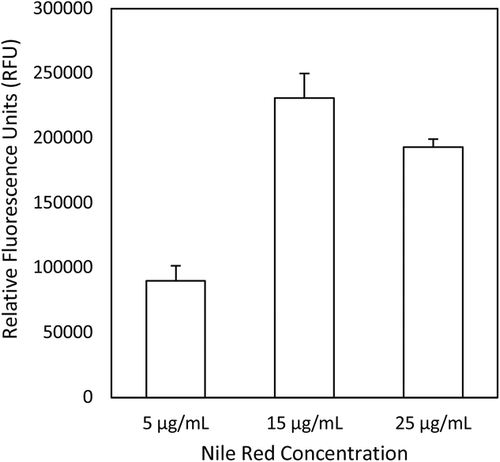
Finally, using the optimized cell and DMSO concentrations, different concentrations of Nile red were assayed (Figure 3). Here, a final concentration of 15 µg mL–1 achieved the highest reading; increasing or decreasing from this resulted in a lower fluorescence measurement.
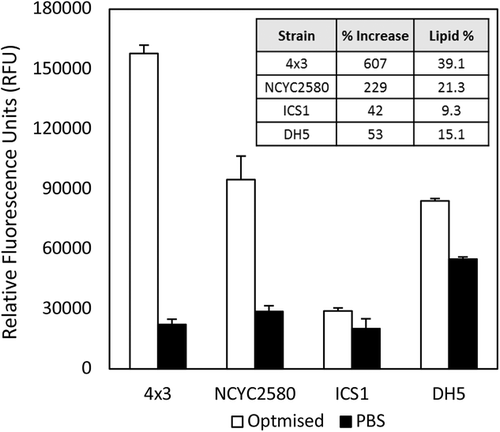
The optimized protocol was then used to assay four M. pulcherrima strains selected to incorporate different cell morphologies and lipid accumulating ranges (Figure 4). The strain used for the optimization, 4 × 3, had the greatest fluorescence percentage increase using the optimized method, whereas the increase to ICS1 was the lowest of the strains assayed. Interestingly, the fluorescence percentage increase correlates with the lipid percentage accumulated for each strain, with high accumulating strains 4 × 3 and NCYC2580 benefiting the most, and low producing strains ICS1 and DH5 benefiting the least.
3.2 Comparison of Nile Red Assay and Cell Size Analysis to Lipid Extractions
3.2.1 Screening Multiple Strains
Screening novel strains for lipid production is a common experiment requiring a reliable high-throughput screening method. Here, six strains were assayed using both the optimized Nile red method and the cell size analysis (CSA) method developed here, with results plotted against lipid extraction data from traditional extractions (Figure 5).
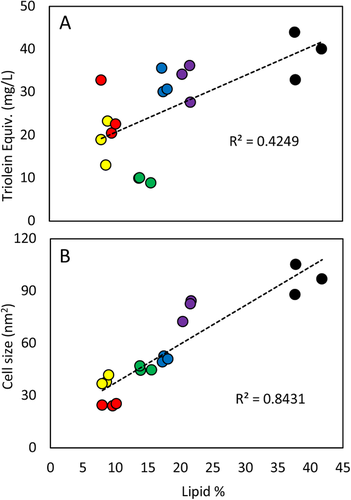
A correlation is present in both datasets; however, a higher R2 from the CSA method shows a better representation of lipid extraction data. ICS1 and ICS46, which accumulate <15% lipid, correlate poorly with lipid extractions when assayed with Nile red compared to CSA, which represents their lipid production values accurately. In general, variation within triplicate samples are greater using the Nile red method than CSA. Micrographs taken of these cultures highlight the strain to strain variation in cell morphology, even when grown under the same conditions (Figure 6).

3.3 Screening of Three Strains in Two Medias
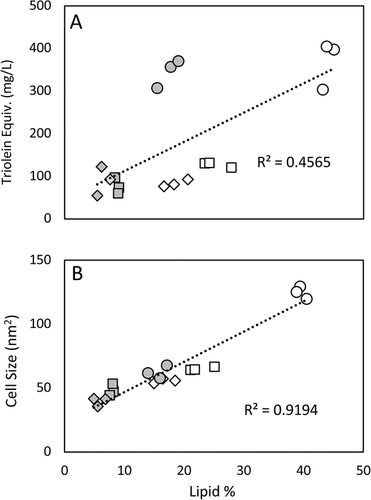
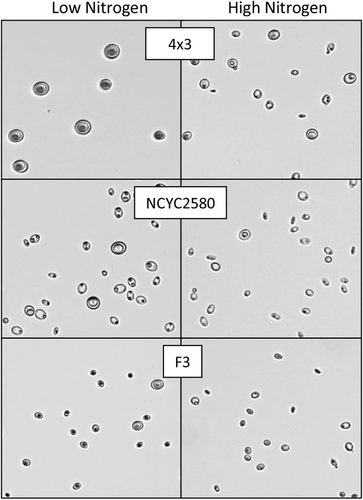
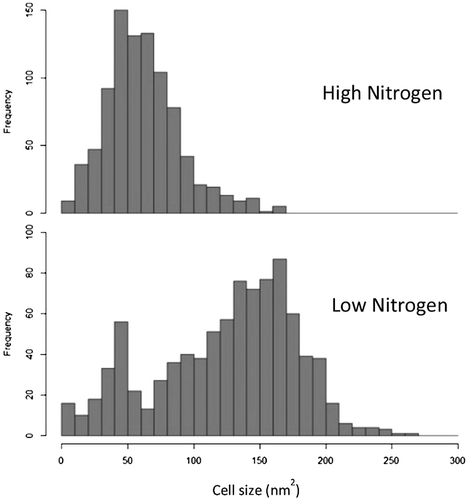
High-throughput screening methods are also used to assess the effect changing media types or growth conditions has on lipid accumulation. Using three strains (4 × 3, NCYC2580, and F3) under high and low nitrogen conditions, both assay methods were again screened for their correlation with traditional lipid extractions (Figure 7). A strong correlation (R2 = 0.92) between CSA and lipid accumulation was achieved, whereas a substantially weaker correlation was seen between Nile red and lipid accumulation (R2 = 0.46). Underestimation of lipid production in strains NCYC2580 and F3 grown in low nitrogen conditions by the Nile red assay incorrectly place triolein equivalent values similar to the high nitrogen conditions, despite lipid production decreasing by over half under these conditions. The Nile red assay for strain 4 × 3 also suggests little difference between both conditions, despite significant differences in actual lipid production. Micrographs of the cultures used for CSA highlight the effect varying nitrogen concentration has on morphology and lipid production, in particular 4 × 3, which has a reduced lipid droplet size and cell wall thickness when grown in high nitrogen conditions (Figure 8).
3.4 Lipid Assessment in a Single Culture Over Time
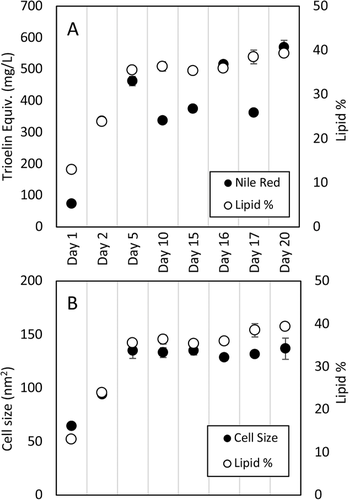
Finally, both assay methods were used to track the lipid production of a single culture over time. Samples were taken initially at days 1, 2, 5, 10, and 15. At day 15, a 10 × stock of NLB was added to the culture to bring nutrient concentrations back to inoculum levels. Three further samples were taken post addition, representing day 16, 17, and 20. Though only a single culture was performed, robustness was assessed for each method by performing triplicate lipid extractions, gathering cell size data from three picture sets and running triplicate Nile red samples with a fresh triolein standard curve for every time point. CSA accurately tracked the initial increase in lipid production from day 1 to 5, as well as the minor fluctuations in subsequent samples (Figure 9). The Nile red method too correlated reasonably well with the initial increase in lipid, however, fluctuated significantly across later samples. Each method produced little variation at each timepoint suggesting technically robust methods.
3.5 Cell Size Population Dynamics
Previously, the effect of nitrogen concentration on M. pulcherrima's ability to accumulate lipid was screened (Figures 7 and 8). Plotting the data used to calculate an average cell size as a histogram enables additional information about the population dynamics and cell morphology to be determined (Figure 10). For example, when grown in low nitrogen conditions, two cell morphologies exist; a group of larger cells clustering around 150 nm2 and a smaller subset of cells clustering around 50 nm2. Conversely, only the 50 nm2 cell type exists within the culture when in the presence of high nitrogen conditions. As these two cell types appear inherently linked to nitrogen concentration as a variable, these additional data provide additional insight into population dynamics.
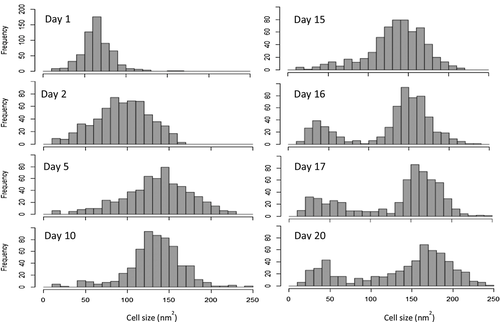
In addition to understanding the effect media type has on population dynamics, plotting the cell size data of a culture over time can also reveal additional insight about the biological process as it progresses, and how it responds to changes. When displayed as a histogram, the data from Figure 9 show the population increasing in average cell size between day 1, 2, and 5, with the population showing a normal distribution around the average value (Figure 11). This population dynamic continues until day 16, where the addition of nutrients at day 15 notably splits the population, despite the overall lipid percentage of the culture showing no change. From day 16 to the final sample at day 20, the lipid production increases from 36% to 39.3%; correlating with the increased number of cells >200 nm2. Interestingly, during this period the cell population remains split rather than reverting to a normal distribution as observed in the pre-nutrient shot samples.
4 Discussion
It is reported that species-specific optimization of the Nile red assay methodology is a pre-requisite for reliable data acquisition within yeast and microalgae.2, 4 Here, starting with the method published by Sitepu, a Nile red assay was optimized for M. pulcherrima.[2] To begin, fluorescence data normalization was investigated by comparing the OD to cell count ratio between strains. In what is an often overlooked factor, OD was found to be an inaccurate way of normalizing data due to the vastly different cell counts present when assayed at the same OD.16 The most notable demonstration of this is seen between strains 4 × 3 and ICS1, which when diluted to an OD of 1 give cell counts of 1.03 × 10⁷ and 9.05 × 10⁷, respectively. In this instance, not only does the larger relative size of 4 × 3 to ICS1 increase light scattering, but the large lipid droplet present is also likely to contribute to this discrepancy. It is important to note that the cell count to OD ratio is not just inconsistent between strains, but also within a strain, as seen by comparing the micrographs and histograms of 4 × 3 when grown in high and low nitrogen media. Although the requirement for cell counting adds a significant amount of time to the assay, it appears in this case essential for accurate data normalization.
During the optimization process, several assay parameters were investigated using the highest lipid accumulating strain, 4 × 3, with the rationale being that the large lipid droplet and thick cell wall would make this strain the least permeable to Nile red staining. The addition of DMSO to increase permeability is common within most reported protocols, often diluted 1:1 with PBS or culture medium prior to addition.2, 17 Here, the addition of 40 µL undiluted DMSO to 200 µL cells was required to reach the highest fluorescence; far more than the method published by Sitepu that added 25 µL of DMSO/Culture medium (1:1, v/v) to 250 µL sample volume. The addition of 10 µL DMSO within this study, a comparable amount to methods published by Sitepu and Roston, gave a fluorescence reading markedly <40 µL, suggesting M. pulcherrima is less permeable to Nile red than those reported elsewhere. A final stain concentration of 15 µg mL–1 gave the highest measurement, which is again higher than the concentrations published elsewhere. Increasing from this optimum concentration did not however yield a higher measurement, as was observed by Sitepu.2
Applying the optimized Nile red assay to different M. pulcherrima strains uncovered large variation in staining efficacy within this species. Interestingly, although all strains tested had increased fluorescence using the optimized method, this varied considerably between strains. Here, high lipid accumulating strains such as 4 × 3 and NCYC2580 benefited more from the optimized method than low accumulating strains. Reasons for this again appears attributed to elements of cell morphology, in particular the frequency of the “pulcherrima” cell type; characterized as a large cell with a thick cell wall, containing a lipid droplet occupying almost the entire cell space.18 Due to the frequency of these cell types being highly susceptible to culturing conditions (such as nitrogen availability), it again reiterates the difficulties of optimizing staining protocols even to strains within a species.
The second half of this study compared the effectiveness of the optimized Nile red assay with CSA to estimate lipid accumulation. A high-throughput screen does not necessarily have to be sophisticated enough provide a lipid weight % result. Rather, the ability to accurately compare samples within a single experiment and compare these results to previous or future experiments, is an essential. With robustness key to comparing experiments, despite best efforts, it is inevitable that a fluorescence-based assay contains more experimental variation than cell imaging. Although technical elements such as dye/standard curve preparation and variation in assay preparation length due to sample number can be kept as consistent as practically possible, dye-specific elements cannot be controlled. Fluorescence quenching, arising from sub-optimal ratios between DMSO, cellular lipid content, and dye concentration, is reported to be species specific and likely to be a feature here, particularly in low producing strains given the method was optimized for the highest producing strain.19, 20
In all three comparison studies, CSA was shown to estimate lipid production better than the 96-well plate Nile red assay. CSA performed particularly well in tracking the lipid production of a single culture; an essential assay requirement, demanding robustness and consistency. While the optimized Nile red method requires sample density measurement and dilution, stain preparation, standard curve preparation, preparation, and incubation of the microplate followed by a 20-min time course measurement, CSA needs only sample density measurement and dilution followed by image collection. Reducing the number of steps within a method can, therefore, reduce errors; improving the data set. Furthermore, the population dynamics gathered by plotting cell size data provides a level of analysis beyond that possible by spectrofluorometric methods alone, using data already collected. This therefore allows real time assessment of the cellular response to changes culturing conditions or nutrient availability.
5 Conclusion
The use of Nile red as a high-throughput method to estimate lipid production is common within the study of oleaginous microorganisms. Although this approach can be successful when an optimized method is established, its effectiveness is limited when applying the same methodology to a new species or strain, leading to incorrect results. Here, a Nile red method optimized with the highest lipid producing M. pulcherrima strain and a fluorescence-free, image-based analysis method developed within this study were compared with traditional lipid extractions for accuracy across three experimental setups: screening multiple strains, screening a subset of strains in two conditions, and tracking a single culture over time. In all instances, CSA had greater correlation with extraction values than Nile red. A key factor inhibiting the success of the optimized Nile red method was the broad range of cell morphologies present within the strains and cultures tested, with cell wall thickness and lipid droplet size likely to have the greatest influence. It is therefore extremely difficult to accurately use a fluorescence-based method when variable cell morphology within a strain/species is such a frequent and impacting factor. In these instances, fluorescence free methods such as that presented here are far more effective, and could be of great use in the study of other oleaginous organisms.
Abbreviations
-
- CSA
-
- cell size analysis
-
- DMSO
-
- dimethyl sulfoxide
Acknowledgements
The authors thank Dr. Deborah Gore-Lloyd, Mauro Moreno, Felix Abeln and Dr. Jim Caunt for their helpful discussions regarding the development of this project. This research was funded by the Industrial Biotechnology Catalyst (Innovate UK, BBSRC, EPSRC) to support the translation, development, and commercialization of innovative Industrial Biotechnology processes (EP/N013522/1) and by the EPSRC through the Centre for Doctoral Training in Sustainable Chemical Technologies (EP/L016354/1).
Conflict of Interest
The authors declare no conflict of interest.


