DNA Extraction Methodology has a Limited Impact on Multitaxa Riverine Benthic Metabarcoding Community Profiles
Funding: This work was supported by the Environment Agency, SC220013; and Natural Environment Research Council, NE/X012204/1, NE/X015777/1, NE/X015947/1, and NE/Z000173/1.
ABSTRACT
There is an expanding body of evidence that environmental DNA (eDNA) can serve as a reliable alternative to traditional assessments of biodiversity and ecological quality. Riverine benthic ecosystems represent one such habitat, holding significant promise for ecological health evaluations using eDNA. Diatoms have typically been assessed in these environmental biofilms through both molecular and conventional methods. However, a wide diversity of life has not been targeted previously, which may serve as important indicators of water quality. To be fully integrated into existing monitoring programs, it is essential to demonstrate the reliability of eDNA-based assessments. This entails developing unbiased methodologies that capture total DNA across the entire community. DNA extraction from environmental samples is critical in analyzing microbial communities; nevertheless, current workflows often focus on individual kingdoms or communities. In this study, we investigated how extraction methodologies can bias the analysis of microbial community composition using amplicon sequencing at a cross-kingdom level in river phytobenthos samples. We tested four commercially available DNA extraction methodologies on 23 freshwater benthic biofilm samples collected across a pH and conductivity gradient. Quantitative PCR and metabarcoding of four amplicons (16S, 18S, ITS, and rbcL), targeting bacterial, eukaryotic, fungal, and phototrophic communities, were employed to assess the impact of the DNA extraction kits on community evaluation. This study revealed a high level of similarity between methods incorporating mechanical lysis, which exhibited higher PCR and sequencing success rates as well as increased cross-kingdom richness and differential abundance compared to chemical and enzymatic lysis alone. However, the origin of the samples, rather than the extraction methodology, emerged as the most significant factor linking them. We recommend utilizing mechanical lysis to optimize cross-kingdom recovery from environmental samples. Nonetheless, the strong correlation between sample origin and extraction method implies that existing data gathered through alternative methodologies remain valid for informing future monitoring practices.
1 Introduction
Biofilms are intricate microbiome structures composed of groups of surface-attached cells, and they are ubiquitous in aquatic environments. In river and lake systems, phytobenthos refers to algae-dominated biofilms that cover the surfaces of rocks and benthic substrates. While communities of algae in riverine biofilms are often well characterized, with decades of research, less is known about the other constituents of these biofilms, including bacteria (Exton et al. 2023), fungi (Eisendle-Flöckner et al. 2013), and protists (Ackermann et al. 2011), as well as meiofauna such as nematodes and tardigrades (Majdi et al. 2012). Recently, aquatic biofilms have been employed to recover environmental DNA (eDNA) from vertebrate communities (Rivera et al. 2023). The composition of aquatic biofilms frequently serves as a reliable indicator of long-term environmental conditions within rivers (Sabater et al. 2007). Biofilms represent the interface between the water column and sediment, thus integrating environmental conditions over time (Sabater et al. 2007).
Diatom communities in phytobenthos have been studied for several decades (Round 1960). Diatoms serve as effective bioindicators of habitat quality, with many well-documented nutrient-tolerant and nutrient-sensitive species. Ecological monitoring programs worldwide utilize indices designed to assess water quality based on diatom communities (Riato et al. 2022). Early studies of these communities relied on identification through microscopy, the resolution of which is constrained by morphological shifts and updates to taxonomic revision (Kelly et al. 1998; Kahlert et al. 2012). Although the use of improved techniques and technologies alleviates some of these challenges, such methods are time-consuming and require specialist skills (Kloster et al. 2020; Fu et al. 2022).
In the last decade, numerous studies have employed molecular methods to characterize diatom communities due to their ease of collection and enhanced depth of community detection (Darling and Mahon 2011; Kelly et al. 2018; Duleba et al. 2021). These studies indicate a strong correspondence between both morphological and molecular methodologies and environmental drivers, with observed differences attributed to gaps in sequence reference databases and discrepancies in biomass abundance (Rivera et al. 2018; Bailet et al. 2019; Kelly et al. 2020; Duleba et al. 2021). Recent work by Kelly et al. (2024) demonstrated the utility of incorporating other algal groups amplified by PCR primers designed to be diatom-specific into models of nutrient-pressure gradients, concluding that there is not a significant enhancement in comparison with the morphological methodology. There have also been advancements to bioinformatics approaches that enable better genetic resolution of diatom taxa, and Pérez-Burillo et al. (2021) have also shown that applying amplicon sequence variants (ASVs) enables the profiling of the environmental preferences of genetic variants of diatoms within species complexes such as Achnanthidium minutissimum. However, diatoms and the other algal groups amplified by primers designed to be diatom-specific represent only one aspect of highly complex biofilms, and examining other microbial groups, such as bacteria or fungi, could potentially enhance ecological assessments (Sagova-Mareckova et al. 2021). Despite this, our knowledge about the structure, composition, and dynamics of riverine aquatic biofilms remains comparatively limited.
In England, the environmental regulator, the Environment Agency, has monitored diatom communities using metabarcoding for routine surveillance for over 6 years (Kelly et al. 2020). More recently, they have begun to explore enhancements to the diatom method by incorporating the broader phytobenthos into assessments and further investigating the wider microbial community associated with river biofilms (Kelly et al. 2024). Nucleic acid extraction methods are known to suffer from bias at each step, including incomplete cell lysis, coextraction of enzymatic inhibitors, and DNA loss, degradation, or damage (Miller et al. 1999). As part of extensive method validation for the molecular analysis of diatoms, the Environment Agency optimized a version of the Eland et al. (2012) method for DNA extraction (Kelly et al. 2020, 2024). However, the original method was optimized for diatoms and may therefore not be suitable for other groups of organisms (Eland et al. 2012). Additionally, initial optimization was performed using pure cultures of microalgae rather than environmental samples and, as a result, lacks an inhibitor removal step, potentially leading to issues with downstream DNA amplification and sequencing. Other studies have previously compared extraction methodologies for analyzing diatom communities in river phytobenthos samples (Vasselon et al. 2017, 2025), but this has yet to be tested for other microbial groups.
The extraction of DNA from environmental samples, including soils, sediments, water, and biofilms, is a crucial stage in analyzing environmental microbial communities and wider environmental communities through eDNA (Miller et al. 1999; Griffiths et al. 2000; Eland et al. 2012; Deiner et al. 2015; Goldberg et al. 2016; Corcoll et al. 2017; Majaneva et al. 2018; Mateus-Barros et al. 2019). The choice of DNA extraction methodology significantly influences not only the yield and purity of the extracted DNA (Thakuria et al. 2008) but also the composition of the community (Tsuji et al. 2019). To ensure that the selected methods can extract sufficient DNA and maximize the detection of a wide range of taxa, careful selection of the appropriate DNA extraction method is essential.
High-quality, high-purity DNA is essential for the success of downstream applications, leading to fewer failed reactions and less optimization time or modifications to methods for “difficult” samples. Moreover, DNA purity influences stability during long-term storage, which is a crucial consideration for archiving DNA for future analysis. Numerous methods are available for extracting DNA, ranging from protocols that use custom laboratory reagents (Griffiths et al. 2000) to premade commercial kit-based extractions. Commercial kits represent the most effective means to standardize methodology and ensure that extractions are consistently performed over time and across individual scientists and laboratories.
This study investigates the impact of various DNA extraction kits on DNA quality and quantity, the abundance of different microbial groups, and community composition in riverine benthic biofilm samples, comparing them with the established Eland et al. method (Eland et al. 2012). The results of this study will enable the selection of a DNA extraction methodology that minimizes bias and provides clean, ready-to-use DNA for downstream applications, thereby improving efforts to incorporate multimarker gene metabarcoding into water quality and ecological monitoring.
2 Materials and Methods
2.1 Sampling Sites
Biofilm samples were collected from various river sites across England as part of the Environment Agency's routine surveillance monitoring. Samples were gathered using standardized methodologies for sampling diatoms from rivers (Comité Européen de Normalisation 2003; Kelly et al. 2018; Kelly et al. 2020; Taylor et al. 2023). Briefly, biofilm-covered stones were collected in a tray and scrubbed with deionized or tap water using a clean toothbrush. A pipette was used to transfer 5 mL of the biofilm suspension to a 15 mL tube containing 5 mL of RNAlater-based preservative (3.5 M ammonium sulfate, 17 mM sodium citrate, and 13 mM Ethylenediaminetetraacetic acid). The samples were then transported to the laboratory via an overnight courier at a temperature of 5°C ± 3°C and stored frozen at −20°C prior to DNA extraction within 12 months (Warren et al. 2024).
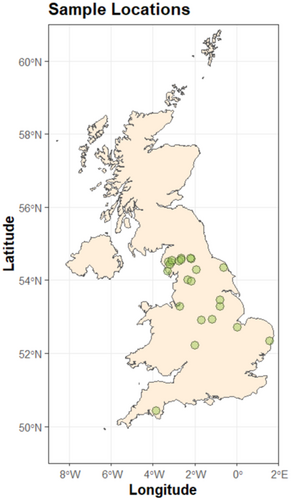
Sample selection was based on two different environmental variables, pH, and conductivity. Samples were grouped in high and low pH and high and low conductivity. These two variables were selected to represent extremes of environmental factors that shape microbial communities and formed either the top or bottom 5% of sample values from the Environment Agency's routine surveillance monitoring in 2021 (Kim et al. 2016; Weigel et al. 2023). The low pH group had a range of pH measured at the site of sampling of pH 4.03–6.30, and the high pH group had a range of pH 8.33–8.50. The low conductivity group had a range of 18.66–44.33 μs/cm, and the high conductivity group had a range of 1945.33–4817.68 μs/cm (see Appendix A: Table A1 for full details). Geographical mapping of sample site distribution was performed in R package ggplot2 v3.5.1 using Map data of the UK from package rnaturalearthdata v 1.0.0. (South et al. 2025). Jittering was applied with a width of 0.1 and a height of 0.1 to reduce overplotting while maintaining the general structure of the data distribution (Appendix B: Figure B1).
2.2 DNA Extraction
The effectiveness of the Eland et al. (2012), Qiagen Blood and Tissue (BT) based method (Kelly et al. 2018) was compared to three popular commercial DNA extraction kits. These kits were chosen based upon a literature review and practical experience and included the Qiagen DNeasy PowerSoil Pro Kit (PS), Thermo MagMAX Microbiome Ultra Nucleic Acid Isolation Kit (MM) and the Zymo Quick-DNA Fecal/Soil Microbe Miniprep Kit (FS). The Eland et al. (2012) method employs both chemical and enzymatic lysis with overnight digestion with proteinase K, whilst the PS, MM, and FS all employ chemical and mechanical lysis, and proteinase K digestion is included with MM and FS kits. To account for sample type, 100 μL of homogenized and resuspended biofilm was used in all extraction procedures. All kits followed the manufacturer's protocol, with the exception of the FS kit, where the protocol was amended to include DNA/RNA shield in place of standard lysis buffer, as experience has shown it to be optimal for this sample type and kit. Further details are provided in Data S1.
2.3 DNA Yield and Quality Evaluation
The presence of DNA was first verified by gel electrophoresis stained with GelRed nucleic acid stain on a 1% agarose gel, run at 85 V for 45 min. DNA was accurately quantified using a Qubit 3 fluorometer (Thermo Fisher, UK) and its companion Qubit 1X dsDNA BR Assay Kit. DNA quality was assessed by UV–VIS spectra determined by Thermo Scientific Nanodrop 8000.
2.4 Quantification of Microbial Abundance via qPCR
See Table 1.
| Gene | Method | Primer name | Primer sequence | Citation |
|---|---|---|---|---|
|
16S |
Metabarcoding | 515F | 5′-GTGYCAGCMGCCGCGGTAA-3′ | Walters et al. (2016) |
| 806R | 5′-GGACTACNVGGGTWTCTAAT-3′ | |||
| qPCR | 8F/27F | 5′-AGAGTTTGATCCTGGCTCAG-3′ | Heuer et al. (1997) and Lane (1991) | |
| 357R | 5′-CTGCTGCCTCCCGTAGG-3′ | |||
|
18S |
Metabarcoding | NSF563 | 5′-CGCGGTAATTCCAGCTCCA-3′ | Mangot et al. (2013) |
| NSR951 | 5′-TTGGYRAATGCTTTCGC-3′ | |||
| qPCR | 345F | 5′-AAGGAAGGCAGCAGGCG-3′ | Zhu et al. (2005) | |
| 499R | 5′-CACCAGACTTGCCCTCYAAT-3′ | |||
|
ITS |
Metabarcoding | fITS7F | 5′-GTGARTCATCGAATCTTTG-3′ | Ihrmark et al. (2012) |
| ITS4R | 5′-TCCTCCGCTTATTGATATGC-3′ | |||
| qPCR | 1F | 5′-CTTGGTCATTTAGAGGAAGTAA-3′ | Gardes and Bruns (1993) and White et al. (1990) | |
| 2R | 5′-GCTGCGTTCTTCATCGATGC-3′ | |||
| rbcL | Metabarcoding and qPCR | rbcL-646F: | 5′-ATGCGTTGGAGAGARCGTTTC-3′ | Kelly et al. (2018) |
| rbcL-998R | 5′-GATCACCTTCTAATTTACCWACAACTG-3′ |
To compare the amount of amplifiable DNA from bacterial, eukaryote, fungal, and phototrophic communities, quantitative polymerase chain reaction (qPCR) was used to amplify target regions of the genes coding for the 16S rRNA (16S), 18S rRNA (18S), the Internal Transcribed Spacer region (ITS), and the ribulose 1,5-bisphosphate carboxylase (rbcL), respectively (see Table 1 and Methods for reaction conditions and methods (Data S1)). Reactions were performed in duplicate, and mean values were used for analysis. For samples where one of the duplicates was unsuccessful (cq≥water controls), or a duplicate was > 2 cq values apart, the successful or highest concentration sample was used in subsequent analysis. While it is acknowledged that this is outside of the normal qPCR acceptance levels, we included these settings as a measure of amplification success without any further purification. If assays were to be used for monitoring, more rigorous cutoffs would need to be applied. Full details of Log copies calculations are given in Data S1.
2.5 Metabarcoding of Biofilm Communities
The full metabarcoding protocol is given in Data S1. To summarize, bacterial, fungal, eukaryotic, and phototrophic community structure was assessed using rarefied sequence abundance of 16S, ITS, 18S, and rbcL, respectively. Library preparation followed a two-step amplification approach, with the first step using Illumina Nextera tagged primers based upon the universal metabarcoding primers outlined in Table 1 and fully described in Data S1. In concurrence with other studies (Kelly et al. 2024), we found that the primers, although targeting diatoms, also amplified additional taxa, and have therefore chosen to refer to the amplified community as phototrophs. The second-step PCR integrated unique custom barcode combinations corresponding to each sample (Kozich et al. 2013). PCR products were normalized using the NGS Normalization 96-Well Kit (Norgen Biotek Corp). Pooled amplicon libraries were vacuum concentrated and gel purified. Resultant libraries were quantified using a Qubit dsDNA HS Assay kit (Invitrogen) and sequenced at a concentration of 7.0 pM with the addition of 10% Illumina PhiX control library. Sequencing was performed on an Illumina MiSeq platform using V2 chemistry (Illumina Inc., CA, USA).
2.6 DNA Sequence Processing
Sequences were processed using DADA2 (Callahan et al. 2016) pipeline in R V.3.0.17 (R Core Team 2012) to quality filter, merge, denoise, and assign taxonomies. 16S amplicon reads were trimmed to 250 and 220 bases, forward and reverse, respectively. ITS2 and 18S amplicon reads were trimmed to 220 and 220 bases, forward and reverse, respectively. rbcL amplicon reads were trimmed to 230 and 210 bases, forward and reverse. Filtering settings were maximum number of Ns (maxN) = 0, maximum number of expected errors (maxEE) = 2,2 (16S, 18S and rbcL) 1,1 (ITS). The primer sequences were removed using trimLeft = c (20). Sequences were dereplicated and the DADA2 core sequence variant inference algorithm was applied. mergePairs was used to merge sequences, and ASV tables were constructed. Chimeric sequences were removed using removeBimeraDenovo default settings. ASVs were subject to taxonomic assignment using assignTaxonomy at default settings; training databases were Silva v138.1 (Quast et al. 2013), Unite v7.2 (Koljalg et al. 2005), PR2 V 4.14.1 (Guillou et al. 2013) and diat.barcode (Rimet et al. 2019) for 16S, ITS, 18S, and rbcL, respectively.
After quality filtering, a total of 4,979,362 bacterial (16S), 3,525,207 fungal (ITS2), 9,045,927 eukaryotic (18S), and 9,399,909 phototrophic community (rbcL) sequences were used in the analysis. To account for the effect of sequencing depth bias, the resultant ASV tables were rarefied to an even depth of 19,821 (16S), 12,229 (ITS2), 11,598 (18S), and 8839 (rbcL), based on the sample with the lowest number of reads in each experiment after the rarefaction curve asymptote was reached. After rarefaction, samples were phylotyped to the genus level using the tax_glom command and with the NArm = FALSE setting enabled, resulting in 1524 (16S), 1331 (18S), 1032 (ITS2), and 329 (rbcL) genera-level phylotypes.
2.7 Statistical Analysis
All post sequencing sample quality filtering were performed in R v2.2, R Studio v 2022.02.2 (R Core Team 2012; RStudio Team 2020), with and package Phyloseq v1.48.0 (McMurdie and Holmes 2013). Data were visualized through packages; Phyloseq v1.48.0 (McMurdie and Holmes 2013), DESeq2 v 1.44.0 (Love et al. 2014) GGbreak V0.1.2 (Xu et al. 2021), microeco v 1.6.0 (Liu et al. 2021), and GGplot2 v3.5.1 (Wickham 2009). The following statistical analyses were performed in R v2.2, R Studio v 2022.02.2, as the following: Kruskal–Wallis and Dunn's tests (package rstatix v 0.7.2, Kassambara 2023), Kolmogorov–Smirnov tests (package dgof v1.4, Arnold and Emerson 2011), R2 values for Regression of relative abundance comparisons by kit were determined through linear modeling using lm function (package stats version 3.6.2, R Core Team 2012), PERMANOVA was performed on NMDS of Bray–Curtis distance using the Adonis 2 command (package vegan 2.6–4, Oksanen et al. 2024), To determine which community members are most impacted by different extraction conditions, differential expression analysis was performed. Differential expression analysis based on the Negative Binomial (a.k.a.Gamma-Poisson) distribution, was performed upon phylotyped genera, with significance determined through hypothesis testing performed using Wald test was performed in DESeq2 v 1.44.0 (Love et al. 2014).
3 Results
3.1 DNA Quantity and Quality
DNA quantity and quality were determined as a primary measure of kit success. Values for total nucleic acid (NA) concentration assessed through UV–Vis spectrophotometry were higher than that of fluorometry (Qubit), suggesting that the BT method had the highest total NA concentration, mirroring gel electrophoresis. However, these methodologies are known to be far less accurate than fluorometry and skewed by the presence of free nucleotides, RNA, residual protein, and environmental contaminants such as humic acids (Li et al. 2014; Paul et al. 2021). Therefore, fluorometry was performed to determine dsDNA extraction success. This was highest in the Fecal Soil (FS) and Blood and Tissue (BT) kits with concentrations of dsDNA within kit detection range (21 and 20 samples levels, respectively), whereas the MagMAX (MM) and Power Soil (PS) kits performed worse in comparison (18 and 15 samples with high concentrations of dsDNA). When input biofilm and lysate volume was accounted for (Figure 1A), there was a significant difference in concentration recovered (Kruskal–Wallis p = 0.006). The highest median concentration of dsDNA across all kits was from the FS kit. However, between kits, only the differences between FS and MM were significant (Dunn's test p = 0.003) and this is likely skewed by high concentration samples.
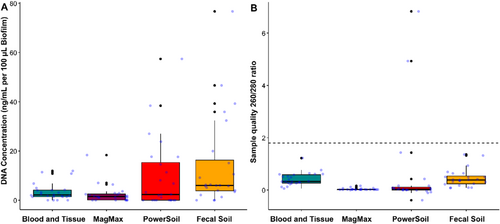
When the 260/280 ratio determined with UV–Vis spectrophotometry was used to assess sample quality (Figure 1B, and Appendix C: Table C1), there was a highly significant difference across kits (Kruskal–Wallis p = 1.2e−10). When comparing between kit difference (Dunn's test) significantly lower quality was found in the MM and PS kits, when compared to the BT (MM p = 3.3e−7, PS p = 8.6e−5) and FS (MM p = 2.8e−7, PS p = 7.4e−5) kits in the median values. However, very few of the samples reached the accepted quality standard of > 1.8. This low 260/280 ratio is common in environmental samples and is likely due to environmental contaminants or extraction kit carryover. This was particularly pronounced in the MM kit where visible magnetic bead carryover was present in the final elution steps despite careful laboratory handling.
3.2 Microbial Community Quantification (qPCR)
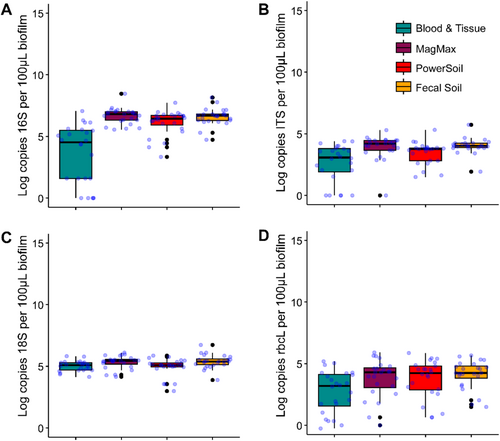
Key community members were quantified through representative genes using qPCR (Figure 2). Significant differences in log copies amplified across kits were detected using the Kruskal–Wallis test irrespective of target gene (16S p = 1.57e−8, ITS p = 2.71e−5, 18S p = 0.004, and rbcL p = 0.02). Pairwise kit comparisons (Dunns test, Appendix C) suggested that significantly higher gene copies were recovered from kits that employed mechanical lysis when compared to the BT kit, although significance did vary by target amplicon. However, amplification success was more variable for 16S, ITS, and rbcL using the BT kit without mechanical lysis compared to mechanical lysis kits optimized for environmental microbes (MM, PS, and FS); as such, when accounting for spread, none of these differences were significant when using the Kolmogorov–Smirnov test (p ≤ 0.05). In terms of community prevalence, there were higher mean Log Copies of 16S compared to all other genes irrespective of kit. This would indicate prokaryotes are more abundant than eukaryotes in the biofilm communities. The lowest Log Copies were found in the rbcL assay.
3.3 Richness and Diversity
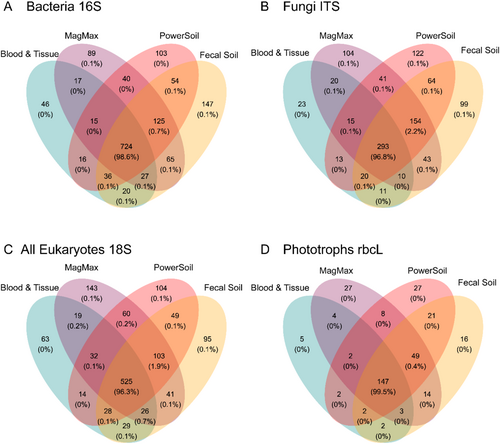
To investigate community richness across sample extraction kits, phylotype distribution was compared for each amplicon using Venn diagrams, whereby regions of overlap represent the count and percentage of phylotypes shared (Figure 3). Greater than 96% of all ASVs from each community were detected in all extraction kits, indicating the communities were broadly similar irrespective of extraction methodology. The next highest percentage of shared ASVs was unique to the mechanical lysis kits (16S = 0.7%, 18S = 1.9%, ITS = 2.2% and rbcL = 0.4%), suggesting that up to 2% of richness would not be detected without using mechanical lysis.
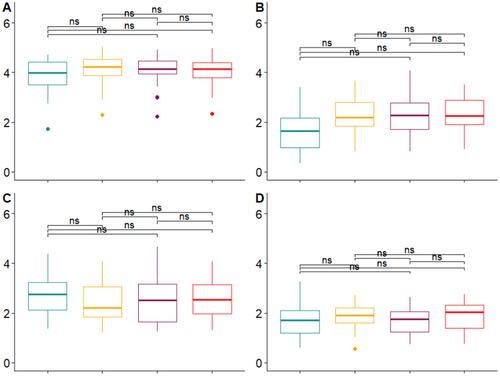
When abundance and distribution of phylotypes were accounted for, minimal observable differences in community α diversity (as measured by Shannon–Weiner index) are present (Appendix D: Figure D1). Similar to the qPCR samples, the chemical lysis only method (BT) had lower levels in bacterial (16S) and fungal (ITS) communities. However, none of the differences were significant when using the Kolmogorov–Smirnov test (p ≤ 0.05). The highest mean diversity was seen within the bacterial (16S) communities, irrespective of the DNA extraction kit used.
3.4 Microbial Community Taxonomic Composition
As biofilms comprise multikingdom microbial communities, it was important to ensure that no taxonomic bias was imposed through kit choice. We therefore examined the impact of the lysis method upon the key constituent communities (Prokaryotes, Eukaryotes, Fungi, and Phototrophs) separately. When using sequence references, levels of taxonomic classification and nomenclature vary between taxonomic grouping; therefore, we used the terminology given by the related sequence identification database (Silva v138.1, Pr2 v4.14.1, UNITE v7.2, and diat.barcode v11.1) (Koljalg et al. 2005; Quast et al. 2013; Guillou et al. 2013; Rimet et al. 2019).
The communities detected through metabarcoding are consistent with the complex community structures described previously (Fechner et al. 2010; Besemer 2015; Romero et al. 2020; Li et al. 2023). Bacterial/Archaeal communities are dominated by known phototrophic sequence signatures (Eukaryotic chloroplasts and Cyanobacteria) and contained chemoheterotrophic taxa such as Burkholderiales, Rhizobiales, Cytophagales, and Rhodobacteriales (Figure 4A).
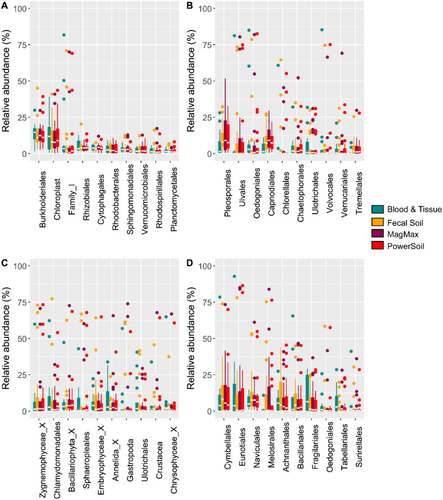
The ITS assay detected multiple fungal groups (the usual target for this assay) and numerous algal groups, particularly Chlorophyceae and Ulvophyceae (Figure 4B). The most dominant fungal group detected belonged to the Dothideomycetes. This fungal class is one of the largest and most diverse groups and is a common saprobe (feeding on dead or decaying organic matter) of freshwater systems (Krauss et al. 2011).
Eukaryote 18S community composition detected through metabarcoding (Figure 4C) was again (Besemer 2015) dominated by sequence signatures from phototrophic orders such as Zygnemophyceae, Chlamydomonas, Bacillariophyta, and Sphaeropleales. Heterotrophic fungal orders such as Pezizomycotina and Chytridiomycotina and grazers such as members of Annelida, Gastropoda, and Crustacea were also present. Overall, class-level eukaryotic composition was largely consistent within samples from the same source, irrespective of extraction kit, but varied much more between samples than that of Prokaryotes.
Of all the sequencing assays, the poorest sample amplification was seen in the rbcL assay (Figure 4D). Here, the diatom selective primers did favor members of the Bacillariophyceae, as they showed a higher proportionate contribution to the phototrophic community than with the 18S primer set. Yet, it should be noted that this primer set was the only one of the four where none of the extraction methods were able to successfully sequence all 23 samples after quality thresholds were applied.
3.5 Variation Between Methods
Nonmetric multidimensional scaling (NMDS) using Bray–Curtis distance was used to visualize the relationships between communities (Figure 5). For 16S, samples cluster significantly (p = 0.001, df = 22, PERMANOVA) by sample type rather than by kit (p = 0.999, 3 df, PERMANOVA), indicating that the kit type played a relatively minor role in determining community composition (Figure 5A). This pattern continues to hold true for the 18S (Figure 5B), ITS (Figure 5C) and rbcL assays (Figure 5D) whereby samples from the same biofilm sample cluster significantly (all p = 0.001, df = 22) rather than NMDS loadings displaying any impact of extraction kit type (p = 1, p = 1 and p = 0.998).

3.6 Differences in Relative Abundance of Community Members
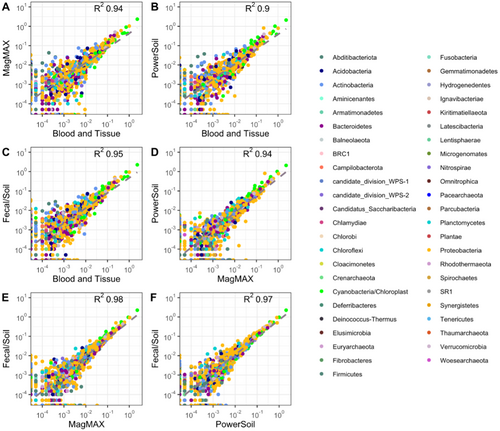
The impact of extraction methodology on genera relative abundance was visualized through linear regression (Appendix E: Figures E1-E4). The resultant R2 values are shown in Table 2.
| BT | MM | PS | FS | BT | MM | PS | FS | |
|---|---|---|---|---|---|---|---|---|
| BT | — | 0.94 | 0.89 |
0.94 |
— |
0.57 |
0.62 |
0.53 |
| MM | 0.56 | — |
0.94 |
0.98 |
0.57 |
— |
0.91 |
0.87 |
| PS | 0.63 |
0.73 |
— |
0.97 |
0.63 |
0.94 |
— |
0.95 |
| FS | 0.63 |
0.71 |
0.82 |
— |
0.53 |
0.90 |
0.93 |
— |
- Note: Colors represent different amplicon types (Red = Prokaryotic 16S, Green = Eukaryotic 18S, Orange = Fungal ITS and Blue = phototrophic rbcL).
- Abbreviations: BT, blood and tissue; FS, fecal/soil; MM, MagMAX; PS, powersoil.
When examining the Bacterial/Archaea communities, no apparent differences were observed between kits, as demonstrated by the similar R2 values (0.90–0.98). However, when examining the total eukaryotic community, there was a higher similarity between kits that employed a mechanical lysis step R2 (0.73–0.83) than the BT kit, which employed enzymatic and chemical lysis alone (R2 0.56–0.61). This pattern was repeated in both the fungal ITS (R2 0.85–0.95 compared to R2 0.56–0.61) and phototrophic rbcL (R2 0.90–0.94 compared to R2 0.53–0.63). It should be noted, however, that in general, the goodness of fit (R2) values in this analysis are high, showing a strong association between individual samples irrespective of the extraction method employed.
3.7 Differential Abundance of Community Members
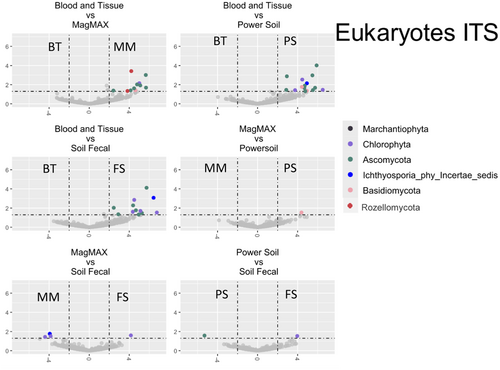
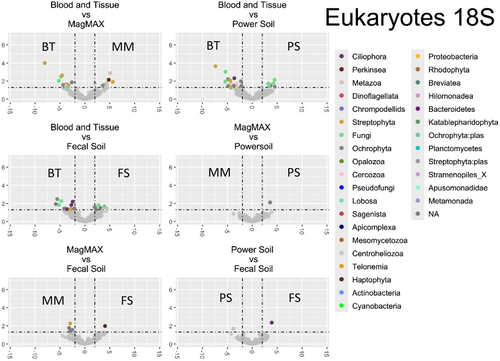
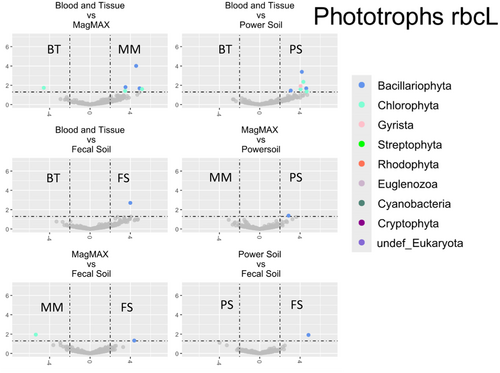
Differential abundance analysis was performed (Appendix F: Figures F1-F4). Table 3 summarizes the results from these analyses. For brevity, only taxa that are significantly impacted in at least three of the six (BT/MM, BT/PS, BT/FS, MM/PS, MM/FS, and PS/FS) comparisons are shown, and the mean values of these comparisons are reported. Of the 4216 genera-level phylotypes identified, the abundance of only 19 genera was significantly different.
| Most resolved taxa | Amplicon | Mean baseMean | Mean log2FoldChange | Mean -log10 p value | High abundance | Low abundance |
|---|---|---|---|---|---|---|
| Solirubrobacterales | 16S | 7.369 | 4.683 | 4.884 | MM, PS, FS | BT |
| Mycobacterium | 16S | 11.983 | 3.733 | 2.730 | MM, PS, FS | BT |
| Maribellus | 16S | 6.090 | 3.764 | 2.081 | MM, PS, FS | BT |
| Halospirulina | 16S | 0.797 | −20.381 | 11.334 | BT | MM, PS, FS |
| Bacillaceae_1 | 16S | 13.657 | 6.308 | 4.713 | MM, PS, FS | BT |
| Bacillales | 16S | 13.838 | 5.616 | 6.729 | MM, PS, FS | BT |
| Paenibacillus | 16S | 1.529 | 3.554 | 2.030 | MM, PS, FS | BT |
| Romboutsia | 16S | 4.808 | 4.454 | 3.415 | MM, PS, FS | BT |
| Clostridium | 16S | 4.413 | 5.020 | 4.107 | MM, PS, FS | BT |
| Paraphaeosphaeria | ITS | 6.858 | 4.525 | 1.931 | MM, PS, FS | BT |
| Plectosphaerellaceae | ITS | 4.725 | 4.812 | 1.785 | MM, PS, FS | BT |
| Plectosphaerella | ITS | 55.738 | 5.760 | 3.714 | MM, PS, FS | BT |
| Monostroma | ITS | 116.508 | 4.369 | 1.733 | MM, PS, FS | BT |
| Saccharomyces | 18S | 27.154 | −4.990 | 2.591 | BT | MM, PS, FS |
| Verrucaria | 18S | 3.602 | −5.311 | 1.928 | BT | MM, PS, FS |
| Cypria | 18S | 5.553 | 10.719 | 8.542 | MM, PS, FS | BT |
| Hydrurus | 18S | 31.568 | −4.928 | 2.091 | BT | MM, PS, FS |
| Zygnema | 18S | 9.488 | −13.119 | 11.434 | BT | MM, PS, FS |
| Melosira | rbcL | 551.625 | 4.243 | 3.369 | MM, PS, FS | BT |
- Note: Only taxa which showed significantly different abundance distribution between all tested extraction kits are included in the table. Phylotype identity is given to the most resolved taxonomic identity from the relevant database. Amplicon refers to the amplicon library in which taxa were detected. Values given for baseMean, Meanlog2Foldchange, and −log10 p value correspond to the mean values given from significant kit comparisons. baseMean value corresponds to overall mean abundance across samples, grouped by kit. Mean log2FoldChange describes the magnitude and direction of abundance differences between comparisons. Significance of change is given as Mean −log10 p value. Results from differential abundance analysis suggested that taxa were classed as either higher or lower abundance in each kit.
- Abbreviations: BT, blood and tissue; FS, fecal/soil; MM, MagMAX; PS, powersoil.
In three or more kit comparisons, there was a clear distinction between kits that employed mechanical lysis and those that did not. In fact, no other comparison groupings met our cutoff of greater than three, again suggesting that kits employing additional mechanical lysis produced highly similar community profiles when compared to enzymatic lysis alone. More specifically, within the bacterial populations, the majority of significantly affected taxa were more abundant in kits employing mechanical lysis, most of which belong to known spore-forming groups. Only the taxa identified as the cyanobacterial genus Halospirulina showed greater abundance in the traditional biofilm extraction technique. This pattern is mirrored in the fungal ITS and rbcL amplicons, where all affected taxa were of significantly higher abundance in mechanical lysis kits. Interestingly, this pattern reversed when studying the 18S amplicon library, with impacted communities being largely more abundant in samples extracted using the traditional biofilm extraction methodology. However, it should be noted that, except for Melosira and Monostroma, the overall community abundance of the identified taxa was low and unlikely to be core community members.
4 Discussion
Numerous other studies have emphasized the significance of DNA extraction methodology in establishing accurate community representation (Deiner et al. 2015; Brauer and Bengtsson 2022; Ruan et al. 2022). Within the scope of this study, we discovered that extraction methodology does influence the composition of freshwater biofilm communities. However, our results indicated that of the four methodologies examined, the three commercial kits employing mechanical lysis produced remarkably similar outcomes. Moreover, even when all four kits were taken into account, sample origin was much more likely to dictate community structure than extraction methodology. While the effect of the kit was significant for some low abundance community members, overall community structure was largely preserved.
It is generally accepted that any community profile determined through DNA sequencing is unlikely to perfectly match the actual community in terms of relative abundances and detection; therefore, the biases introduced by all steps in a metabarcoding workflow should be considered. Yet, high-quality DNA extraction is known to be a key determining factor in obtaining as representative a snapshot as possible of the community present. In this study, we found a disparity between optimal methodologies regarding success, quality, and quantity of DNA obtained. The traditional biofilm extraction protocol based on enzymatic and chemical lysis did indeed yield more raw nucleic acids, as assessed through gel electrophoresis and UV–Vis spectrophotometry. However, a higher normalized concentration of high-quality dsDNA was obtained by the FS kit, evaluated through fluorometry, gel electrophoresis, and UV–Vis spectrophotometry. This finding is perhaps not entirely surprising, as the BT kit, upon which the methodology used in (Kelly et al. 2018; Kahlert et al. 2020) for UK river phytobenthos is based, is more generalist and not specifically optimized for environmental microbiome communities. Furthermore, it is interesting to note that in all three kits employing mechanical lysis (PS, MM, and FS), comparatively little sheared DNA was observed. This is somewhat contrary to the traditional view of DNA derived from mechanical lysis, which often results in highly sheared DNA with a significant amount of contaminant carryover. However, most of these studies relied on manual laboratory methodologies rather than silica membrane column-based technologies that select for inhibitor-free, high-molecular-weight DNA.
The quality of extracted DNA is likely to have affected quantifiable DNA, particularly in prokaryotic and fungal communities. When employing the Kruskal–Wallis and Dunn tests, significant differences between kits were noted in Log Copy number. There was a greater variance in amplification success in the BT methodology compared to MM, PS, and FS, indicating that a large amount of inhibitory contaminants was still present in the BT samples. To the best of our knowledge, this is one of the first studies to directly quantify the multikingdom composition of freshwater biofilms using qPCR. However, other studies that have quantified bacterial biofilm communities through qPCR report mean Log copy numbers of 4.5–6.5 (16S) (Romero et al. 2019; Kneis et al. 2022), a figure comparable to our study despite methodological differences.
The results from the qPCR analysis also suggest that river biofilms are dominated by bacterial cells. However, it should be noted that qPCR does not account for cell size or volume; therefore, eukaryotic organisms contribute more to the overall biomass within the riverine phytobenthos than bacteria. The corresponding metabarcoding data suggest that, similar to other studies, our samples were dominated by organisms from Betaproteobacteria (Burkholdariales), Cyanobacteria (Family_I), Alphaproteobacteria (Rhizobiales, Rhodobacteriales, Sphingomonadales, Rhodospirales), Gammaproteobacteria, Cytophagia (Cytophagales), Verrucomicrobiae, Planctomycetacia, Actinobacteria, and Deltaproteobacteria (Besemer 2015; Guo et al. 2021). While Archaea were present in the libraries, they were of very low abundance, likely due to known underrepresentation by primers targeting the V4 hypervariable region (Bahram et al. 2019). Freshwater Archaea are not well characterized, and their abundance within the phytobenthos is thought to be minimal (Besemer 2015). Future work could aim to target the biofilms with Archaea-specific primers. According to the 18S, ITS, and rbcL assays, eukaryotic populations were dominated by known phototrophic groups: green algae (Chlorophyceae, Zygnematophyceae, Ulvophyceae, Trebouxiophyceae, Sphaeropleales), diatoms (Bacillariophyceae), land plants (Embryophyceae), and golden algae (Chrysophyceae). Like other biofilms, there was genetic evidence of known biofilm grazers such as ostracods (Crustacea), freshwater snails (Gastropoda), and annelids, which may be incorporated within the biofilm matrix (Lawrence et al. 2002). Finally, fungal heterotrophs (Capnodiales and Pleosporales) and potential mixotrophic lineages (Chlorellales) were also key components (Heredia-Arroyo et al. 2011; Weitere et al. 2018; Dani et al. 2020).
Within our study, the most significant factor influencing community composition related to the origin of the sample, rather than the extraction methodology. This indicates that local biochemistry and other biotic and abiotic factors may drive microbiome composition (Zhao et al. 2021). Here, the detection of these differences between samples is maintained regardless of extraction methodology. One of the most striking findings of this work is the similarities between the community eDNA from kits that employed mechanical lysis. Within the scope of this study, this suggests that commercial eDNA extraction kits are effective at accessing the total microbial community. The inclusion of mechanical, chemical, and enzymatic lysis within such methodologies provides optimal cell lysis, which is crucial for multikingdom analysis. Additionally, the inclusion of buffers optimized for the removal of known environmentally derived PCR inhibitors (tannins and humic acids) likely maximizes amplification success. We would therefore recommend that the selection of extraction kits for multitaxa studies should incorporate mechanical lysis and that the choice of kit be guided by the requirements and resources available to a research project; for example, high-throughput kits may not always be cost-effective for small studies.
While the high community similarity between methodologies would suggest that the back compatibility and therefore integration of data generated using alternative methodologies is valid (Hering et al. 2018), it is crucial to note that within the scope of this study, we have not examined other potential methodological biases within community metabarcoding analyses. By opting for “universal” metabarcoding primer sets, interspecies or strain level variability is unlikely to be resolvable at this level, and differences between some indicator species may be overlooked, necessitating the use of more specific primers or alternative techniques (such as microscopy or qPCR). Moreover, primer selection, sampling strategies, preservation methods, and bioinformatics pathways are also likely to play significant roles in determining microbial community differences (Ruppert et al. 2019). Therefore, we would recommend that standardization of techniques between research groups should be prioritized. In the academic sector, consortia such as the Earth Microbiome Project (Thompson et al. 2017) have facilitated the analysis of large, intercomparable datasets. Moving forward, the integration of robust and repeatable eDNA methodologies into existing long-term river monitoring projects, such as this one, will require a similar methodological consensus. While linking molecular data to morphological and traditional analyses has been beneficial for validating novel methods (Kelly et al. 2020), eDNA data, which captures phytobenthos community members that cannot be fully surveyed by traditional means, presents new opportunities to develop indices and metrics for assessing water quality (Kelly et al. 2024). Most importantly, the application of eDNA metabarcoding to target all organisms within the phytobenthos will uncover a vast uncharacterized biodiversity that is essential to preserve in an ever-changing environment.
Author Contributions
All authors contributed to project conception and design. L.K.N. and J.W. contributed to the acquisition of the data. Data were analyzed by L.K.N. and J.D.T.; L.K.N. and J.D.T. wrote the first draft, which was reviewed, edited, and approved by all coauthors. D.S.R. and K.W. obtained funding for this research.
Acknowledgments
Funding for this work was provided by an Environment agency contract to UKCEH SC220013. Additionally, D.S.R. was supported by the National Environmental Council (NERC) Research Grants Micro-Cycle NE/Z000173/1 & PACIFIC (NE/X015947/1), and J.D.T. was supported by a NERC research grant (NE/X012204/1). K.W. and J.W. were supported by the National Environmental Council (NERC) Research Grant NERC PACIFC (NE/X015777/1).
Conflicts of Interest
The authors declare no conflicts of interest.
Appendix A
| Sample | Sampling method | Region | pH | Group (pH) | Conductivity (μs/cm) | Group (Conductivity) |
|---|---|---|---|---|---|---|
| BioF01 | Stone scrape | NW | 8.36 | High | 286.25 | Mid |
| BioF02 | Macrophyte scrape | NW | 7.73 | Mid | 1945.33 | High |
| BioF03 | Stone scrape | NE | 4.76 | Low | 35.5 | Low |
| BioF04 | Stone scrape | MID | 7.81 | Mid | 2564.33 | High |
| ioF05 | Stone scrape | MID | 8.41 | High | 767.33 | Mid |
| BioF06 | Stone scrape | ANG | 7.88 | Mid | 4817.67 | High |
| BioF07 | Stone scrape | MID | 7.74 | Mid | 1963 | High |
| BioF08 | Stone scrape | NW | 8.51 | High | 141.33 | Mid |
| BioF09 | Stone scrape | NW | 5.95 | Low | 18.67 | Low |
| BioF10 | Stone scrape | NE | 5.45 | Low | 58 | Mid |
| BioF11 | Stone scrape | MID | 8.02 | Mid | 2811.33 | High |
| BioF12 | Stone scrape | SW | 5.61 | Low | 36.67 | Low |
| BioF13 | Stone scrape | NE | 8.36 | High | 285 | Mid |
| BioF14 | Stone scrape | NE | 5.49 | Low | 99 | Mid |
| BioF15 | Stone scrape | NW | 7.1 | Mid | 30 | Low |
| BioF16 | Macrophyte scrape | ANG | 8.46 | High | 712 | Mid |
| BioF17 | Stone scrape | NW | 6.94 | Mid | 27 | Low |
| BioF18 | Stone scrape | MID | 7.96 | Mid | 2740 | High |
| BioF19 | Stone scrape | NW | 6.57 | Mid | 25.25 | Low |
| BioF20 | Stone scrape | NE | 8.38 | High | 317 | Mid |
| BioF21 | Stone scrape | NW | 6.3 | Low | 44.33 | Low |
| BioF22 | Stone scrape | NW | 8.36 | High | 488.67 | Mid |
| BioF23 | Stone scrape | NW | 5.19 | Low | 62.33 | Mid |
Appendix B
Appendix C
| Kruskal–Wallis (p) | Dunn's test (p) | ||||||
|---|---|---|---|---|---|---|---|
| BT | BT | BT | FS | FS | MM | ||
| vs. | vs. | vs. | vs. | vs. | vs. | ||
| FS | MM | PS | MM | PS | PS | ||
| Conc |
0.006 |
0.1 | 1 | 1 | 0.003 | 0.3 | 0.8 |
| Quality | 1.2e −10 | 1 |
3.3e −8 |
8.6e −5 |
2.8e −7 |
7.4e −5 |
1 |
| 16S | 16e −8 | 1.7e −6 | 8.6e −8 | 0.001 | 1.0 | 0.9 | 0.3 |
| ITS | 2.7e −5 | 6.2e −4 | 3.5e −4 | 1.00 | 1.0 | 0.05 | 0.03 |
| 18S | 0.004 | 0.04 | 0.03 | 1.00 | 1.0 | 0.1 | 0.1 |
| rbcL | 0.02 | 0.02 | 0.1 | 0.1 | 1.0 | 1.00 | 1.00 |
- Note: Total significance is given through the Kruskal–Wallis test, and significance between individual kit comparisons (BT, blood and tissue; FS, fecal soil, MM, MagMAX; PS, power soil) determined through Dunn's test. Significant values have been italicized.
Appendix D
Appendix E


Appendix F

Open Research
Data Availability Statement
The sequence data that support the findings of this study are available in EMBL-EBI European Nucleotide Archive at https://www.ebi.ac.uk/ena under accession PRJEB71824. All ASV, taxonomy, and sequence files are available on request.


