In Vitro Passive eDNA Sampling Provides a Cost-Effective Alternative for Large Scale Sample Collection
Funding: This work was supported by BHP Billiton.
ABSTRACT
Passive sampling is an emerging method for environmental DNA (eDNA) sampling in aquatic environments. Passive eDNA collection methods are time efficient, inexpensive, and require minimal equipment, making them suited to high-density sampling, especially in remote locations. Here we trial new passive eDNA sampling methods, which we term ‘in vitro passive eDNA sampling’; where a water aliquot is collected at a sampling location and passively sampled in a microcosm experiment, allowing for high-density sampling while the researcher moves to other areas. Furthermore, we test whether agitating in vitro passive samples improves DNA yield and biodiversity estimations. We show that at a species level, in vitro passive sampling methods can return comparable species richness estimates to conventional filtration at both estuarine and inshore marine locations when analyzed as detections per unit of time taken to process the sample. In addition, agitating our in vitro passive samples improved DNA yields by an average of 2.2×as opposed to in vitro passive sampling without agitation, though both were significantly lower than filtration. These in vitro approaches to eDNA sampling will suit cost- and time-sensitive biological surveys, where access to equipment is restricted and the need to complete high-density sampling over large spatial scales is paramount.
1 Introduction
Broad-scale biomonitoring approaches in marine environments are integral in assessing anthropogenic stressors such as resource exploitation, pollution, and climate change, which are threatening marine environments at an unprecedented scale (Bowler et al. 2020). Real-time, or near-real-time, monitoring for detecting environmental change across a variety of spatial scales is necessary for adaptive and effective marine ecosystem management (Palumbi et al. 2009). However, traditional biomonitoring methods are often constrained by the vastness and inaccessibility of the marine environment, and the time and cost associated with the analysis of visual data, which includes a requirement for significant taxonomic expertise.
Environmental DNA (eDNA) metabarcoding has shown great promise as a biomonitoring tool over the past decade; being a highly scalable, non-invasive, sensitive, and broadly applicable technique for analyzing multi-species DNA fragments from environmental samples (Taberlet et al. 2018; Berry et al. 2023). Organisms release DNA into the surrounding air, water, and soil through a variety of means, including gametes, sloughed tissue cells, or feces, which can be collected across a range of particulate sizes, including intra- and extracellular particles (e.g., Wilcox et al. 2015; Jo et al. 2019). eDNA metabarcoding is particularly well suited to aquatic environments, where eDNA has been most extensively collected to investigate the presence and diversity of diverse biota, particularly fishes (Takahashi et al. 2023). eDNA often presents in small concentrations in aquatic environments, due to its dispersal and dilution, which necessitates its concentration prior to extraction (Bessey et al. 2021; Power et al. 2023). Though centrifugation and precipitation can be used to concentrate eDNA from small water volumes (Deiner et al. 2015), filtration through a membrane is generally preferable (Turner et al. 2014; Koziol et al. 2019; Tsuji et al. 2019), where filtering predetermined volumes of water allows for consistent sampling and larger volumes can improve the detection of rare species (Shu et al. 2020).
The volume of water required to adequately report the biodiversity of an ecosystem varies depending on a number of variables including: the species diversity within the system (Bessey et al. 2020), the eDNA shedding rates of each individual species, and a multitude of factors affecting the preservation, transport, and decay of eDNA (Harrison et al. 2019). For example, eDNA has been shown to degrade faster in the terrestrially influenced nearshore marine environments than in offshore environments (Collins et al. 2018), and degradation rates appear to be slower in marine studies than freshwater (Thomsen et al. 2012; Collins et al. 2018). Notably, the higher salinity, ionic content, and more stable temperatures characteristic of marine environments are factors known to promote the preservation of eDNA, and tend to correlate with lower degradation rates (Eichmiller et al. 2016; Tsuji et al. 2017; Andruszkiewicz et al. 2017a). Whilst some studies indicate that sampling small water volumes (500–1000 mL) is sufficient to detect a representative range of taxa in marine (e.g., Andruszkiewicz et al. 2017b; Gold et al. 2021) and freshwater (e.g., Janosik and Johnston 2015; Feng et al. 2020), others suggest that larger volumes or multiple replicates (20 L total or greater) should be sampled before species accumulation curves near an asymptote for diversity (Shu et al. 2020).
The requirement to filter large volumes of water is, however, a time-consuming process, risking contamination due to additional filtration equipment, potentially compromising DNA integrity (due to carryover of sterilization reagents e.g., chlorine bleach) and limiting the number of samples incorporated into eDNA studies (Thompson et al. 2024). Bulky filtration equipment requires essential sterilization procedures to avoid cross contamination between samples, which adds logistical complexity to the eDNA workflow, hindering eDNA-based marine biomonitoring, particularly in remote and offshore areas (Hansen et al. 2020). Furthermore, this logistic complexity hinders the acquisition of standardized time series on short timescales (days to months), resulting in an inability to identify crucial temporal and spatial variations in species presence, a matter especially pertinent to rare and migratory species (Barnes and Turner 2016).
To remove the requirement for water filtration, many studies have explored alternative methods, such as in situ remotely deployed equipment to automate filtering, ranging from single-filter systems to more complex multi-filter systems. Such systems cost thousands of dollars (USD) for simple single filter systems (e.g., Nguyen et al. 2019; Formel et al. 2021) which often do not carry preservation or cleaning reagents, and up to several hundred thousand dollars for complex multi-filter systems, which are often highly complex to deploy and service (e.g., Scholin et al. 2009; Yamahara et al. 2019). Multiple studies have also explored different passive sampling strategies. For example: filter feeding organisms (such as sponges) have been shown to naturally aggregate eDNA in their tissues (Mariani et al. 2019; Turon et al. 2020; Jeunen et al. 2023), and whilst eDNA signals obtained from the tissues of such organisms have high similarity to those acquired by active filtration, the sampling strategy is logistically complex, destructive, and difficult to standardize. Another option is the submersion of adsorbent materials, which have a demonstrated ability to bind eDNA (Bessey et al. 2020; Kirtane et al. 2020; Verdier et al. 2022). Extraction of aquatic eDNA from immersed adsorbent substrates has proven successful in various settings, including microcosms (Kirtane et al. 2020; Verdier et al. 2022), mesocosms (Bessey et al. 2022; Jeunen et al. 2022), and field experiments (Bessey et al. 2020; Kirtane et al. 2020; Jeunen et al. 2022; Alexander et al. 2023), with long submersion times found to be unnecessary (Bessey et al. 2022) and the approach easier to replicate and standardize than obtaining eDNA passively collected by filter feeding organisms. However, sample drop-out (Bessey et al. 2021) and large variations in concentrations of recovered eDNA (Verdier et al. 2022) have been observed between passive replicates, whilst the choice of adsorbent material can affect the performance of passive sampling for fish species detection compared to filtering (Jeunen et al. 2022), particularly in high-diversity tropical waters (Bessey et al. 2021). Furthermore, previous aquatic passive sampling methods often require a vessel to remain on station for the duration of the submersion of the passive sampling material (Bessey et al. 2021). In addition, the mechanism for eDNA adherence to passive sampling materials remains unclear, with biological matter appearing to adhere randomly to available surfaces, with a wide variety of sizes and shapes (Bessey et al. 2022), and as a consequence, it is unclear whether changes in flow regimes affect eDNA adherence in a passive setting.
Here we present and test an alternative in vitro passive sampling method, in which an aliquot of water is taken in a field experiment and is then passively sampled on board the vessel, thus circumventing the requirement for the vessel to remain on station for the duration of the submersion of sampling material. This makes the method more amenable to large-scale, high-throughput sampling in difficult-to-reach marine areas, where the cost of vessel time is often the most prohibitive factor for researchers. Furthermore, we investigate the effect of agitating these aliquots of water using a random orbital shaker, which was hypothesized to increase the concentration of eDNA recovered compared to our passive method. We predicted that filtered sampling would retrieve higher DNA concentrations than passive sampling with agitation and that passive sampling by itself would retrieve the lowest DNA concentrations. However, we predicted that despite lower eDNA concentrations, passive sampling, with and without agitation, would provide comparable taxonomic characterization to filtered sampling as has been found previously (e.g., van der Heyde et al. 2023).
2 Methods
2.1 Field Sampling
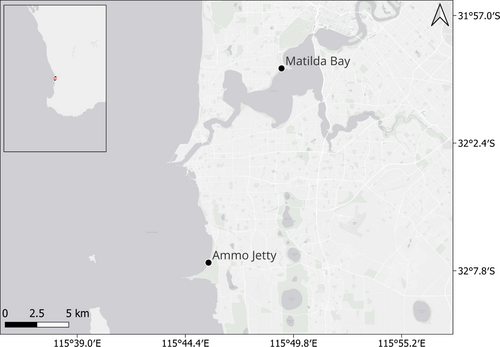
Sampling was conducted in June and July 2022, in Perth, Western Australia at Ammo Jetty, within Woodman Point reserve in the sheltered marine embayment of Cockburn Sound, and in a brackish region of the Swan River at Matilda Bay, in the Perth suburb of Nedlands (Figure 1; Table S1). The Southwest region of Western Australia is known for its unique fish assemblages and high levels of endemism (e.g., Langlois et al. 2012; Richards et al. 2016). At each of the two sites, 20 L of water was collected at 1 m depth via wading, with samples put on ice before being homogenized with a magnetic stirrer in a trace DNA laboratory at the Indian Ocean Marine Research Centre at the University of Western Australia. Water samples (1 L) were then aliquoted from the homogenized sample into sterile 1 L Nalgene bottles (Nalgene Wide-Mouth PPCO Bottles; Thermo Fisher Scientific, Massachusetts, USA) that were triple-rinsed using excess water from the homogenized sample.
Collected water aliquots from each site were processed within 24 h of collection using Pall GN-6 Metricel 0.45 μm 47 mm cellulose ester filter membranes with 6 aliquots (1 L each) analyzed for each subsequent eDNA collection method: (1) in vitro passive, (2) in vitro passive with agitation and, (3) conventional filtration, (Figure 2). For the in vitro passive method (hereafter referred to as “passive”), samples had a filter membrane placed in the water for 4 h using a pair of sterilized forceps. For the passive with agitation method (hereafter referred to as “agitated”), samples had a filter membrane added as per the passive method, with the samples then being agitated on a random orbital shaker (Incu-Shaker H2010; Benchmark scientific, New Jersey, USA) at 180 rpm for the 4 h. For the filtration method, samples were filtered using a Pall Sentino Microbiology pump through the filter membranes (Pall Corporation, Port Washington, USA).

2.2 Laboratory Processing
DNA was extracted from the filter membranes within 48 h using a DNeasy blood and tissue kit (Qiagen: Venlo Netherlands) with the following modifications: 540 μL buffer ATL (added in the sampling step above) and 60 μL proteinase K during the digestion phase. The second elution step was also completed following the manufacturer's protocol. Negative controls, containing no sample (or filters) were extracted and processed alongside samples in order to detect any cross-contamination during the extraction process. A PCR assay, targeting teleost mitochondrial 16S-rRNA (Figure S1; Deagle et al. 2007; Berry et al. 2017), herein referred to as 16S-Fish, was used for our eDNA metabarcoding workflow. All extractions were quantified using a Qubit 4.0 Fluorometer (Invitrogen, Carlsbad, USA) prior to qPCR.
Following a three-point tenfold dilution series of input DNA and quantitative PCR (qPCR) to optimize levels of input DNA for each sample based on Ct values (Berry et al. 2017), final qPCR was performed in two steps. The first reaction consists of primers containing the Illumina sequencing adaptor and the assay primer sequence, whilst the second adds Illumina flow cell adaptor sequences (P5 and P7), a unique index (10 bp in length) and a portion of the Illumina sequencing adaptor (see Figure S1). All qPCR reactions were prepared in a dedicated DNA-free ultra-clean laboratory facility at the Indian Ocean Marine Research Centre, Western Australia. Each 1st step qPCR reaction was carried out in triplicate 10 μL reactions containing: 5 μL PowerUp SYBR Green Master Mix (Applied Biosystems, Massachusetts, USA), 0.1 μL BSA (Thermo Fisher Scientific, Massachusetts, USA), 1 μL of each forward and reverse primer at 4 μM (Integrated DNA Technologies, Australia) and 2.9 μL of eDNA template.
Triplicate reactions from the same eDNA template were combined, and each 2nd step PCR reaction was carried out in 20 μL containing: 5 μL PowerUp SYBR Green Master Mix (Applied Biosystems), 2 μL each of forward and reverse primers at 10 μM concentration (Integrated DNA Technologies), 2 μL of pooled 1st step amplicons, and 4 μL of UltraPure DNase/RNase-Free Distilled Water (Thermo Fisher Scientific). Each qPCR was performed on a QuantStudio 3 Real-Time PCR System (Applied Biosystems) under cycling conditions described in Figure S1.
Tagged amplicons were then pooled into mini pools based on ΔRn values. These pools were then quantified using a TapeStation 4150 with a D1000 ScreenTape (Agilent Technologies, California, USA) and combined at equimolar ratios to produce the library. The library was then size selected using a Pippin Prep (Sage Science, Beverly, USA), retaining amplicons between 325 and 500 bp and then purified using AmpureXP (Beckman Coulter, California, USA) magnetic beads with a bead to sample ratio of 1. The final library was then quantified using a TapeStation 4150 with a D1000 ScreenTape (Agilent Technologies, California, USA) and a Qubit 4.0 Fluorometer (Invitrogen, Carlsbad, USA). 10pM of the final library was loaded onto a 300 cycle MiSeq V2 Standard Flow Cell on an Illumina MiSeq platform and unidirectionally sequenced (Illumina, San Diego, USA) at Genomics WA in Perth, Western Australia.
2.3 Bioinformatics and Taxonomic Assignment
Bioinformatic processing and taxonomic assignments were conducted on Kaya, a high-performance computing (HPC) system based at the University of Western Australia, Perth, Western Australia. Reads were demultiplexed, merged, and filtered using a combination of bcl2fastq v2.20 (Illumina) and the ‘DADA2’ R package (version v1.28.0; Callahan et al. 2016) software. Quality filtering parameters included a maximum error of 1 and a minimum read length of 150 bp for our amplicons, and the removal of chimaeras. Quality filtered dereplicated amplicon sequence variants (ASVs) were queried against the National Centre for Biotechnology Information's (NCBI) GenBank nucleotide database (accessed in 2023; Benson et al. 2005) using BLASTn with a minimum percentage identity score of 92%, a minimum query coverage score of 92% and an expected value score of 1e−3 and a reward value of 1. Post-clustering curation of ASVs was then conducted using the R package LULU (version v0.1.0; Frøslev et al. 2017), with a minimum ratio of 1, a minimum relative cooccurrence of 0.95, and a minimum match of 97%.
Taxonomic assignments were made by applying the following parameters to a lowest common ancestor (LCA) script taken from eDNAflow (Mousavi-Derazmahalleh et al. 2021); a query coverage limit of 95%, a sequence identity limit of 95%, and an identity difference limit of 2%. If, for example, a unique sequence does not meet or exceed a 95% match to a species and/or is too closely matched to another species, the taxonomic assignment will be collapsed back to a genus-level assignment.
2.4 Data Cleaning
Control samples were treated for potential contamination using the “Decontam” R package (version 1.20.0; Davis et al. 2018) using the default threshold of 0.2, and rare ASVs present in only a single sample, or with less than 10 reads overall were removed from downstream analysis. Taxa which could not be identified to at least a family level were dropped from the taxonomy-dependent segment of the analysis.
2.5 Statistical Analyses
Univariate analyses were performed using R v4.3.0 (R Core Team 2023). Linear models, analysis of variance (ANOVA) and Tukey multiple pairwise-comparisons were used to test DNA concentrations, ASV/species per hour of analyst effort and ASV/species richness for significance between sampling methods and locations. A Holm-Bonferroni correction to alpha values (α H-B) was made for the Tukey multiple pairwise-comparisons. Beta-diversity was examined with Non-Metric Multidimensional Scaling (NMDS) plots with the “phyloseq” R package on square-root and double Wisconsin transformed relative abundance (total sum squares) data and Bray-Curtis distance. Difference associated to sampling method, site and their interaction was tested with a permutational analysis of variance (PERMANOVA) using the “vegan” R package (permutations = 9999, method = “bray”, by = “term”; version 2.6.2; Oksanen et al. 2022).
3 Results
3.1 Extraction Yields
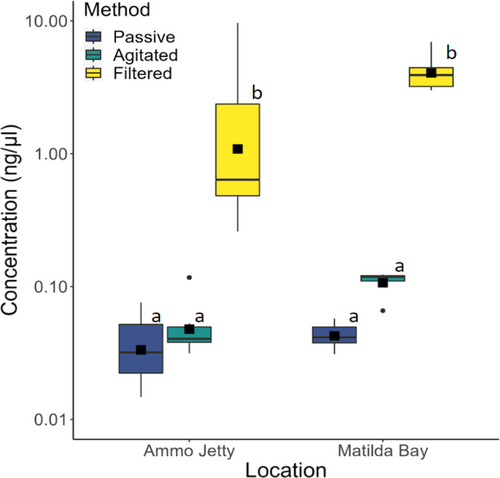
The concentrations of DNA extracted by filtered and agitated methods were significantly different (p = 0.00244), as were concentrations collected by filtered and passive methods (p = 0.00229; Table S3). The filtered samples yielded the highest DNA concentrations (Figure 3) with Matilda Bay and Ammo Jetty replicates having mean [SD] concentrations of 4.23 ng/μL [1.47] and 2.53 ng/μL [3.70] respectively. In vitro agitated samples from the two sites had mean concentrations of 0.109 ng/μL [0.0218] and 0.0533 ng/μL [0.00320], whilst in vitro passive samples had the lowest mean concentrations at 0.0434 ng/μL [0.00979] and 0.0391 ng/μL [0.0239], for Matilda Bay and Ammo Jetty, respectively. No significant effect was observed between agitated and passive methods or between locations (Table S3).
3.2 Sequencing Data and High-Level Biodiversity Overview
The 16S-Fish metabarcoding assay applied to a total of 42 samples (36 water samples and 6 control samples) produced a total of 9,521,848 sequencing reads. The mean number of reads per sample was 217,084 [±435,801 SD] for Matilda Bay and 154,175 [±140,660 SD] for Ammo Jetty based on 7,796,423 reads that passed quality filtering (Figure S2, Table S2). The top 3 commonly detected fish families as a proportion of reads were Terapontidae (grunters), Centropomidae (snooks), and Tetradontidae (puffer fish) at Matilda Bay, and Clupeidae (herrings), Centropomidae, and Carangidae (jacks) at Ammo Jetty.
The passive and agitated methods both required 10 min of researcher time to clean the sample containers and both place and retrieve the filter papers into the solution, whilst filtering water took 105 min at Matilda Bay, with water samples being visually more turbid than the samples taken at Ammo Jetty, which required 75 min to filter. The passive samples had the highest number of replicates that failed to detect fish using the 16S-Fish assay, with 5 of a possible 6 replicates detecting fish DNA at both Matilda Bay and Ammo Jetty, whilst all agitated and filtered samples detected fish at both sampling locations.
3.3 Alpha Diversity
A total of 66 ASVs (Figure 4a) were detected along with 15 unique Actinopterygii taxa (Figure 4b, Table S5). ANOVA of ASVs/species detected per hour of analyst effort showed a significant difference between methods (ASVs: p = 0.0012, Species: p = 0.001; Table S6), whilst no significant effect was observed for location, the interaction term, or pairwise between methods. Clear trends were observed; however, with agitated sampling having a consistently higher time efficiency than filtered sampling, and it also being more consistent than passive sampling (Figure S3).
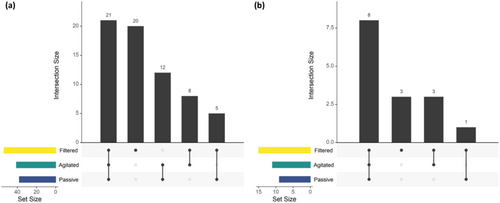
ASV richness showed a significant methodological effect: with a significant change observed between filtered and both agitated (p = 0.0032) and passive (p = 0.0014) methods. No significant effect on ASV richness was observed between agitated and passive samples or between locations (Table S7). No significant effect on species richness was observed between any of the methods or locations when analyzing at a taxonomic level (Table S8), with a similar trend observed between the methods as the ASV results (Figure 5).
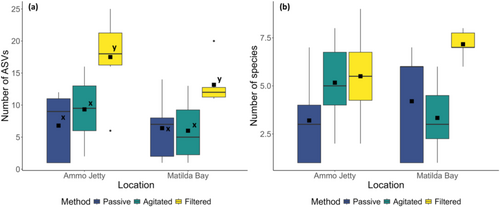
Diversity analysis at the lowest taxonomic (ASV) level (Table S4) showed that, at Ammo Jetty, the filtered sampling method returned the highest total diversity, detecting an average [SD] of 17.5 [6.53] ASVs per replicate. The agitated method detected an average of 9.33 [5.27], and the passive method returned an average of 6.8 [5.4] ASVs per replicate (Figure 5a). At Matilda Bay, the filtered sampling method also returned the highest total diversity, with an average of 13.16 [3.43] per replicate. Agitated samples detected an average of 6 [4.82] per replicate, whilst the Passive sampling method detected an average of 6.4 [5.22] ASVs.
Diversity analysis at a species level (Table S4) followed a similar, though non-significant pattern; at Ammo Jetty, the agitated method returned the highest diversity with an average [SD] of 5.5[2.43] species per replicate, followed by the filtered method at 5.16 [2.23] species per replicate, with the passive method returning an average of 3.2 [2.49] species per replicate (Figure 5b). At Matilda Bay, the filtered method returned an average of 7.16 [0.75] species per replicate, whilst the agitated and passive methods returned 3.33 [1.86] and 4.2 [2.95] species per replicate, respectively.
3.4 Beta Diversity
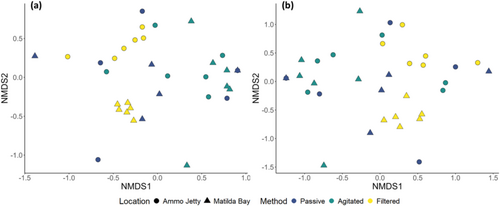
PERMANOVAs at both taxonomic levels confirmed a significant difference in taxa richness between methods (ASVs: p = 0.003, Species: p = 0.018) and locations (ASVs: p = 0.001, Species: p = 0.003), whilst the interaction term was also significant (ASVs: p = 0.04, Species: p = 0.05; Table S9). Location (Table S10) was significant for the filtered method (ASVs: p < 0.001, Species p = 0.005) but not significant for the agitated (ASVs: p = 0.585, Species: p = 0.733) or passive methods (ASVS: p = 0.681, Species: p = 0.157). Method (Table S11) was found to be highly significant for the Matilda Bay (ASVs/Species: p = 0.001) but not for Ammo Jetty (ASVs: p = 0.245, Species p = 0.207).
NMDS plots also revealed that, at an ASV level, differentiation between sites was observed with a noticeable clustering of filtered samples by site (Figure 6a). At a species level, differentiation was also observed with clustering of filtered samples by site (Figure 6b).
4 Discussion
Optimizing the collection of eDNA samples is a valuable component of directing any eDNA experiment to answering the questions being addressed, especially when targeting vast and challenging-to-reach aquatic environments. Our results demonstrated the value of our in vitro passive sampling methods for answering common questions studied with eDNA metabarcoding and highlighted several advantages under certain circumstances. We demonstrated the ability of in vitro passive sampling methods to capture fish diversity using as little as 1 L of water, while significantly reducing analyst time required (by up to an order of magnitude) to process samples compared to filtered samples (Figure S3). Compared to previous passive sampling methods used in the field, our in vitro methods also circumvent the requirement for a vessel to remain on station for the duration of the sampling, a distinct advantage when working in remote marine environments, or at large spatial scales and other scenarios where a high level of replication is required. The in vitro agitated sampling method was found to collect more DNA than in vitro passive sampling and consequently has a higher level of sensitivity and reduced sample dropout compared to the passive method. While the mechanism of eDNA adherence to adsorbent materials remains unclear, this finding underscores the need for further exploration. For example, the application of agitation in conjunction with in situ passive sampling in aquatic ecosystems could enhance DNA recovery versus a purely passive sampling method. The toolkit of eDNA sampling methods is expanding all the time, with examples of recent new methods including natural passive samplers such as sponges (Jeunen et al. 2023), artificial passive samplers (e.g., Verdier et al. 2022), and a variety of novel active filtration approaches (e.g., Pochon et al. 2024).
The potential of eDNA metabarcoding as a universal biomonitoring tool has been demonstrated, particularly in species detection and biodiversity studies, where the publication rate has grown rapidly in the last 5 years (Takahashi et al. 2023). In contrast, the application of eDNA metabarcoding for estimating abundance and beta diversity has been constrained by methodological challenges (e.g., Elbrecht and Leese 2015; Fonseca 2018; Lamb et al. 2019), though the use of spike-in standards can allow more similar estimates of relative abundance to traditional methods (Ushio et al. 2018). It is also possible to employ the frequency of detecting an individual species across multiple samples as a surrogate measure for relative abundance, granted there is a sufficient level of biological replication (Derocles et al. 2018). However, achieving this degree of replication is seldom realized through traditional active eDNA sampling and filtration methods (Prosser 2010; Ficetola et al. 2015). Our in vitro passive sampling methods will allow for increased biological replication in the field and increased spatial coverage, allowing eDNA metabarcoding to address new ecological questions. Increasing the number of samples taken per site and expanding the number of sites will improve both diversity estimates and spatial resolution. Furthermore, estimates of prevalence, relative abundance, or biomass using frequency of occurrence metrics will be improved via the collection of more samples.
Our results demonstrate that in vitro passive sampling methods can be successfully applied to detect fish in both marine coastal and riverine ecosystems. To our knowledge, our in vitro agitated sampling method is the first successful trial of agitating suspended membranes in vitro in a discrete water sample. Our method shares similarities with filtration-type methods as it allows for the control of the volume of water sampled, allowing for quantitative assessment of eDNA concentration in the sampled environment, a distinct advantage over traditional passive sampling methods in studies that focus on the quantitative properties of eDNA. Our method also allows the research vessel used for deployments to move to a new sampling location while the processing of site water is taking place on board the vessel, similarly to precipitation and filtration methods. More generally, passive methods also have practical advantages such as removing the requirement for bulky and expensive filtration equipment, reducing analyst handling time. Furthermore, passive methods can enhance the environmental friendliness of eDNA sampling as this approach eliminates the need for introducing plastics and other waste typically associated with conventional filtration methods, including additional disposable water containers, components of filtration apparatus (such as bottles and tubing), and the use of harmful chemicals (such as bleach and detergents) for cleaning reusable utensils between samplings.
Our results also show that passive methods yield much lower DNA concentrations than active filtration (up to 100-fold lower for purely passive sampling), resulting in higher sample dropout. While agitating passive samples was shown to improve the sample retention rate, higher dropout was still observed relative to active filtration. This finding corroborates other studies using cellulose ester filter membranes (Bessey et al. 2021). Furthermore, significant differences in richness were detected at the lowest taxonomic level (ASV) between active filtration and both the passive and passive agitated methods but not at the species level, underscoring the need for careful methodological choices based on the target taxonomic level for the researcher's question. Other studies have dealt with these weaknesses by using the time saved to process a larger number of passive samples compared to filtered samples (e.g., Bessey et al. 2021), though this does incur increased cost due to the processing (extraction and amplification) of additional samples.
Future research should focus on improving eDNA capture rate and detection efficiency of these passive methods. For example, various materials show different binding affinities for eDNA fragments (Chen et al. 2022). Recent freshwater mesocosm experiments have shown that granulated activated carbon captures an order of magnitude more eDNA than montmorillonite clay (Kirtane et al. 2020), whilst custom-made hydroxyapatite passive samplers captured comparative levels of DNA to conventional methods (precipitation and filtration) in both microcosms and in situ (Verdier et al. 2022). Differing speeds and ranges of motion should also be investigated to further enhance eDNA recovery using the agitated method, which may yield further improvements over the passive method. Future studies should also assess the volume of water and submersion time required for the greatest biodiversity detection and optimal sampling design for different environments. Larger volumes of water are known to improve biodiversity estimates when using filtration to collect eDNA (Shu et al. 2020), particularly in high-diversity environments, such as tropical marine ecosystems (Marwayana et al. 2022), though it is currently unclear if the same is true for passive sampling of aliquoted water. Many passive collection materials have also been shown to saturate quickly (Chen et al. 2022; Bessey et al. 2022), suggesting short submersion times may be sufficient depending on the material used.
Author Contributions
Study conceptualization by S.J. and S.T.; sampling strategy by S.T.; samples collected by S.T.; sample processing and molecular research conducted by S.T. and M.H.; bioinformatics and statistical analysis conducted by S.T., with advice from S.J., T.L., and K.G.; funding acquisition by T.L. and S.J.; All authors contributed to the writing of this paper.
Acknowledgments
We acknowledge and thank Broken Hill Proprietary Company Limited (BHP) for project funding as part of a collaborative project with The University of Western Australia. For advice regarding library preparation and for the provision of sequencing services, we thank Genomics WA. We thank the Australian Government for supporting the primary author for the duration of this research through an Australian Government Research Training Program (RTP) Scholarship. Open access publishing facilitated by Curtin University, as part of the Wiley - Curtin University agreement via the Council of Australian University Librarians.
Conflicts of Interest
The authors declare no conflicts of interest.
Open Research
Data Availability Statement
Raw sequence reads are deposited in the NCBI sequence read archive (BioProject PRJNA1106564).


