Environmental DNA metabarcoding of pan trap water to monitor arthropod-plant interactions
Abstract
Globally, the diversity of arthropods and the plants upon which they rely are under increasing pressure due to a combination of biotic and abiotic anthropogenic stressors. Unfortunately, conventional survey methods used to monitor ecosystems are often challenging to conduct on large scales. Pan traps are a commonly used pollinator survey method and environmental DNA (eDNA) metabarcoding of pan trap water may offer a high-throughput alternative to aid in the detection of both arthropods and the plant resources they rely on. Here, we examined if eDNA metabarcoding can be used to identify arthropods and plant species from pan trap water, and investigated the effect of different DNA extraction methods. We then compared plant species identified by metabarcoding with observation-based floral surveys and also assessed the contribution of airborne plant DNA (plant DNA not carried by arthropods) using marble traps to reduce putative false positives in the pan trap dataset. Arthropod eDNA was only detected in 17% of pan trap samples and there was minimal overlap between the eDNA results and morphological identifications. In contrast, for plants, we detected 64 taxa, of which 53 were unique to the eDNA dataset, and no differences were identified between the two extraction kits. We were able to significantly reduce the contribution of airborne plant DNA to the final dataset using marble traps. This study demonstrates that eDNA metabarcoding of pan trap water can detect plant resources used by arthropods and highlights the potential for eDNA metabarcoding to be applied to investigations of arthropod-plant interactions.
1 INTRODUCTION
Global declines in arthropod taxa (e.g., bees, moths, flies, and wasps) are resulting in the annual loss of ~1% of the 1 million morphologically described and the estimated 4.5–7 million undescribed terrestrial arthropod species (Stork, 2018; Wagner, 2020; Wagner et al., 2021). These declines are, inter alia, the result of complex interactions between land use change (e.g., agricultural expansion and forest reduction), climate change (e.g., more frequent extreme climatic events such as drought), introduced species (e.g., Varroa destructor and Ascosphaera apis), light pollution, as well as generalized use of pesticides (Wagner et al., 2021). Taken together, these biotic and abiotic anthropogenic stressors can threaten arthropod-mediated ecosystem services, including pollination, decomposition, and nutrient recycling (Potts et al., 2016; Wagner et al., 2021). In the face of such threats, scalable, accurate, and cost-effective methods are needed to monitor arthropods in both natural and agricultural landscapes.
Arthropod communities are often targeted using a mixture of active (e.g., sweep netting) and passive (e.g., pan traps) sampling techniques to capture the most accurate representation of taxonomic diversity for a habitat or landscape (Prendergast et al., 2020; Spafford & Lortie, 2013). Pan traps, colored plastic bowls filled with soap water, are often used to sample arthropod pollinators (Meissle et al., 2022; Popic et al., 2013; Saunders & Luck, 2013) and are an efficient and cost-effective means to measure arthropod diversity without observer bias (Westphal et al., 2008; Wilson et al., 2008). Increasingly, pan traps are used to survey in both agricultural and natural landscapes. For instance, 40% of all pan trap studies available through Scopus (357 studies total) have been published in the last five years alone (Table S1 in Appendix S1), probably due to the low cost and simple implementation of this sampling tool. Pan traps have proven to be most effective at capturing insect assemblages when flowering levels are low or fluctuating, primarily because pan trap capture rates are independent of floral resource availability (Popic et al., 2013). Although like other observation-based techniques, this method can be time-intensive (Saunders & Luck, 2013), requires taxonomic expertise (Joshi et al., 2015), and thus may be challenging to implement on a large scale. Despite these challenges, pan traps still remain a common sampling technique, in both natural and agricultural systems, to survey the taxonomic diversity of arthropod communities (Joshi et al., 2015; Meissle et al., 2022; Popic et al., 2013), although the potential plant taxonomic information incidentally captured by using this method remains largely unexplored.
Pollen accumulated on the bodies of arthropods can be used to catalog which flowering species were visited during insect foraging and infer potential pollinators for plants with limited observational data (Ladd et al., 2019; Macgregor et al., 2019). To date, these pollen-centric studies have favored active sampling methods (e.g., sweep netting), followed by washing or swabbing arthropods to obtain animal-collected pollen (Evans & Kitson, 2020; Pornon et al., 2017; Prendergast et al., 2020). Increasingly, however, microscopy-based techniques are being combined with pan traps to identify foraging resources in both natural (Ladd et al., 2019) and agricultural systems (Bowie et al., 1999; Campbell et al., 2018; Gill & O'Neal, 2015). Although these identifications often require specialist expertise and may achieve low taxonomic resolution due to the lack of morphological characters for species-level identification (Bell et al., 2016; Khansari et al., 2012; Rahl, 2008). Moreover, even when plant taxa are detected from pan traps, they are rarely used to infer species-specific flower visits or pollen transport (Popic et al., 2013); the primary reasons being that (1) pollen collected from pan traps represents foraging from the entire community of arthropods captured, and; (2) pan trap plant detections may include nontarget wind-pollinated species, which could result from contamination, either airborne pollen/plant material (Johnson et al., 2019b) or herbivorous regurgitant (Sword, 2001), rather than flower visits (Campbell et al., 2018; Popic et al., 2013). Such contributions may be significant considering that wind-pollinated species produce copious quantities of pollen (see Harrington & Metzger, 1963). Despite this potential for contamination, ambient pollen (pollen dispersed by air, not invertebrates) is rarely quantified, with studies instead relying upon alternative approaches, such as artificial pollen (see Campbell et al., 2018), to circumvent this issue. Plant surveys using passive traps may, therefore, benefit from alternative approaches, like those afforded by environmental DNA (eDNA) metabarcoding, to detect both pan trap-specific and ambient pollen, in order to generate high-throughput and high-resolution pollen datasets, which can help form robust conclusions about the plant resources used by pollinator communities.
DNA-based approaches offer a reliable and efficient method for surveying and monitoring arthropod and plant community assemblages from a diverse array of substrates. For arthropods, eDNA metabarcoding has been used to survey, for example, community composition from bulk samples collected from passive traps (Banerjee et al., 2022; Rasmussen et al., 2021; Zizka et al., 2018), detect mesofauna in soil (Todd et al., 2020), and identify plant–animal interactions (Kestel et al., 2023; Newton et al., 2023; Thomsen & Sigsgaard, 2019). For plants, eDNA metabarcoding was originally used to reconstruct ancient vegetation communities from permafrost, ice cores and cave sediment (Sonstebo et al., 2010; Willerslev et al., 2003), while more recently, extant plant diversity has been classified from soil (van der Heyde et al., 2020; Yoccoz et al., 2012), scat (van der Heyde et al., 2020), honey (Bruni et al., 2015; Hawkins et al., 2015), air (Johnson et al., 2021), as well as arthropod bodies' (Chang et al., 2018; Pornon et al., 2016, 2017). Compared to conventional microscopy and morphological identifications, which are limited by throughput (Stillman & Flenley, 1996) and taxonomic resolution (Lau et al., 2019), eDNA metabarcoding has been shown to provide reliable identifications from diverse sources of arthropod and plant DNA (Bell et al., 2022; Pornon et al., 2017; van der Heyde et al., 2020). The accuracy of this molecular method is, however, dependent on recognizing and detecting possible sources of DNA contamination from nontarget species.
eDNA metabarcoding of arthropod-collected plant material (i.e., pollen) often requires nondestructive sampling approaches (e.g., wash water or swabs from arthropod specimens – see Batuecas et al., 2022; Pornon et al., 2017) to reduce contamination between the gut contents of arthropods and the pollen collected on their bodies' (Chang et al., 2018; Pornon et al., 2016, 2017). Additionally, nondestructive sampling allows for the preservation of whole specimens for morphological identification and barcoding of species missing from the online sequence databases (e.g., GenBank (NCBI)) (Chang et al., 2018; Macgregor et al., 2019). Though, nondestructive samples should also include measures of possible contamination from nontarget airborne material (i.e., airborne pollen from wind-pollinated species) (Evans & Kitson, 2020; Macgregor et al., 2019). These measures can be obtained in the field using either passive dust collectors (e.g. marble traps – see Johnson et al., 2019a) or active air filters (e.g., air particle filters – see Clare et al., 2021). Indeed, when used in tandem with eDNA metabarcoding, pan traps complemented with measures of airborne plant DNA, may generate higher resolution plant identifications, allowing for more robust conclusions about the plant resources utilized by pollinator communities within cultivated ecosystems. To date, no studies have applied eDNA metabarcoding to pan trap water.
- Determining if eDNA metabarcoding can be used to identify arthropod and plant species from pan trap water, and examining the effect of different DNA extraction methods on species detections.
- Comparing plant species identified using eDNA metabarcoding of pan trap water with conventional surveys of the floral resources available to arthropods at the study sites, to understand the extent to which they complement one another
- Determining the contribution of ambient plant DNA to the pan trap eDNA species dataset.
2 METHODS
2.1 Study orchards and sample collection
Three Persea americana (“Hass” avocado) orchards located in the Manjimup – Pemberton region of south-west Western Australia (SWWA) were chosen for this study. The orchards were separated by an average distance of 18 km (Orchard A – 34°18′52 S, 116°08′36 E; Orchard B – 34°25′30 S, 116°01′23 E; and Orchard C – 34°26′28 S, 115°54′02 E). Persea americana trees in each study orchard were similar in age (3–5 years) and trees in each orchard had <10% of flowers open. All three orchards were adjacent to pasture, dominated by Arctotheca calendula, Trifolium subterraneum, and various grass species that were not bearing flowers at the time of sampling. All three orchards were located ~1 km away from secondary growth Eucalypt Forest. To survey arthropods and the pollen they collect on their bodies, in each orchard, five pan trap arrays (Figure 1a) were deployed at 10 m intervals along a 50 m transect, located 50 m away from the edge of the orchard, between the 29th and 31st of October 2021. Pan traps were deployed when temperatures were warm enough for bee activity (clear skies, wind speed <30 km/h, and temperatures >17 and <25°C; Prendergast et al., 2020). In each pan trap array, three colored bowls (white, yellow, and blue) were deployed to capture the broadest range of arthropod color preference (Abrahamczyk et al., 2010; Cane et al., 2000; Saunders et al., 2013). Each array was placed at a height of 1.2 m above the ground to match the height of the P. americana trees in the study orchards. All of the pan traps were filled with ~200 mL of sterile MilliQ water, and one drop of detergent to disrupt the surface tension (Campbell et al., 2018; Gervais et al., 2018). Pan trap evaporation was minimal during the sample period due to the mild temperatures (average of 19.7°C), while, the water temperature of the pan traps did not exceed 25°C. After eight hours, each pan trap was stirred using sterilized tweezers (washed in 10% bleach solution and placed under UV light for 15 min prior to use), and 50 mL of liquid (presumed to contain pollen) was subsampled into a labeled 50 mL falcon tube (one tube per white, blue and yellow pan trap; 150 mL collected per pan trap array). Any captured insects captured in the pan traps were transferred into the same 50 mL of collected water using sterilized tweezers. The falcon tubes were then placed on ice until they could be transferred to a −20°C freezer at Curtin University.

Potential contamination of pan traps with plant DNA carried in the atmosphere (e.g., pollen from predominantly wind-pollinated plant species, and plant DNA attached to dust particles), which is not necessarily representative of insect flower visits, was assessed by using marble traps to capture this ambient DNA. Marble traps were made following the design of Reheis and Kihl (1995); a sterilized cake pan is lined with metal mesh and filled with sterilized marbles (washed in 10% bleach solution and placed under UV light for 15 min prior to deployment in the field) (Figure 1c). This design allows for vertical flow of air through the marbles and hence ambient DNA is captured in the cake pan. The marble traps were inexpensive to build and have previously been shown to perform equally well as commercially available alternatives (see Johnson et al., 2019a). In each orchard, one marble trap was deployed in the middle of the 50 m pan trap transect. Marble traps were placed 1.2 m above the ground to match the height of the pan trap arrays. Marble traps were deployed for the same amount of time as the pan trap arrays (8 h). During collection, the marble traps were wrapped in Clingfilm and stored at room temperature (below 25°C) until they could be transferred to a −20°C freezer at Curtin University.
2.2 Floral surveys
Flowering plant species present in the P. americana orchards and adjacent pasture were quantified using observation-based floral surveys to cross-validate the eDNA results. On the same day as pan traps were deployed, floral surveys were carried out following Fisher et al. (2017). Here, four 1 m2 quadrats were deployed along the 50 m pan trap transect in each orchard and along a parallel 50 m transect in the adjacent pasture, located 100 m from the orchard transect (Figure 1b). Four replicates were undertaken per floral survey due to the low diversity of plant taxa and the fact that no new species were being detected after the fourth quadrat (Figure S1). Within each quadrat, flowering species were identified and a field herbarium created with leaf material from each species. Field identifications of flowering species were confirmed using relevant taxonomic keys and reference materials.
2.3 Sample processing and DNA extraction
Our approach prioritized the collection of pollen from the external surface of captured arthropods without causing disruption to their internal organs and maintaining body integrity for morphological identification, and use of specimens in subsequent studies. To achieve this, once the pan trap water samples were defrosted, the arthropods were separated from the pan trap water using a sterilized stainless steel tea strainer (changed between samples). Each arthropod specimen was subsequently transferred into labeled 2 mL Eppendorf tubes containing 99% ethanol. Arthropods were identified morphologically by two entomologists, Dr Terry Huston and Christopher Swinstead, to provide taxonomic identifications to species level, where possible (Table S2 in Appendix S1). The pan trap water was filtered in preparation for DNA extraction.
To understand how different DNA extraction methods may influence the quantity of arthropod and plant reads, as well as species composition identified, we compared two of the most commonly used DNA extraction kits in eDNA metabarcoding studies; the DNeasy Blood and Tissue kit (Qiagen; Qiagen Inc., Valencia, CA, USA), hereafter referred to as the Blood and Tissue kit, and the Plant Pro kit (Qiagen; Qiagen Inc., Valencia, CA, USA) (Hawkins et al., 2015; Johnson et al., 2021; McFrederick & Rehan, 2016). Pan trap water samples (N = 15) were filtered using two Sentino peristaltic microbiology pumps (Pall Life Sciences, New York, USA), through sterile 47 mm cellulose filters with a pore size of 0.22 μm (Pall Life Sciences). Filters were transferred into sterile ziplock bags and placed in a −20°C freezer until processed for DNA extraction. For the marble traps (N = 3), 1000 mL of MilliQ water was added (in 2 × 500 mL batches) to the traps and agitated periodically for 5 min (10 min total); before being filtered through sterile 47 mm cellulose filters with a pore size of 0.22 μm (Pall Life Sciences). The marble trap filter papers were then transferred into sterile ziplock bags and frozen at −20°C until further processing.
For DNA extraction, each filter was halved, finely chopped using sterilized scissors (prewashed with 10% bleach solution) and placed in two separate tubes for each of the DNA extraction methods explored in this study. The Blood and Tissue kit extractions were followed as per the kit instructions with a modified protocol (see West et al., 2020), while the Plant Pro kit extractions were followed as per the kit instructions with a modified protocol from Oliver et al. (2021). For the Blood and Tissue kit, the samples were extracted with the following modifications: a total of 540 μL ATL Buffer and 60 μL Proteinase K were added to the tube containing half of the finely chopped membrane to ensure that the filter membranes were adequately exposed to the lysis solution, to optimize DNA yield. The combined filter and lysis solution (600 μL) were incubated overnight at 56°C in a slow-rotating hybridization oven. The following morning, 400 μL of the DNA digest supernatant was then transferred to a labeled 2 mL tube and loaded into an automated sample preparation system for DNA extraction (QIAcube; Qiagen Inc., Valencia, CA, USA). The final DNA extracts were eluted from the silica column in 100 μL AE buffer and frozen until further assessment. Pan and marble trap samples (N = 18) and a DNA extraction control (N = 1) for the Blood and Tissue extraction were DNA extracted using Blood and Tissue kit (Qiagen; Qiagen Inc.), with the same modifications as stated above.
Similarly, the other half of the finely chopped filter membrane was processed, in addition to the pan and marble trap samples (N = 18) and a DNA extraction control (N = 1) with the modified Plant Pro kit. These modifications were: 500 μL of CD1 buffer, 10 μL of Proteinase K and 0.25 g of ≤106 μm acid etched beads (Merck, Darmstadt, Germany) added to the tissue lysis tube containing the filter membrane as per Oliver et al. (2021). The samples were then placed in a Tissuelyser (Qiagen; Qiagen Inc.) and run for 2 min at 500 rpm. Afterward, the combined filter and lysis solution were incubated overnight at 56°C in a slow-rotating hybridization oven. The following morning, 400 μL of the DNA digest supernatant was then transferred to a labeled 2 mL tube and loaded into an automated sample preparation system for DNA extraction following the kit protocol (QIAcube; Qiagen Inc.). The final DNA extracts were eluted off the silica column in 100 μL AE buffer and frozen until further assessment.
The quality and quantity of DNA extracted from each membrane for each extraction method described above was measured by quantitative PCR (qPCR), using two common assays targeting Ribulose-1,5-bisphosphate carboxylase-oxygenase (rbcL) region and trnL (UAA) intron region (trnL), and one arthropod assay targeting cytochrome c oxidase subunit I (COI). Low copy number and PCR inhibitors from eDNA extracts can impact metabarcoding data (Murray et al., 2015); therefore, each eDNA extract was assessed with a qPCR dilution series (neat, 1:10, 1:100) based on the following conditions 25 μL reaction volumes consisting of 2 mM MgCl2 (Fisher Biotec, Australia), 1× Taq polymerase buffer (Fisher Biotec), 0.4 μM dNTPs (Astral Scientific, Australia), 0.1 mg bovine serum albumin (Fisher Biotec), 0.4 μM of each primer; (rbcLh2aF: 5′—GGCAGCATTCCGAGTAACTCCTC—3′: rbclh2aR: 5′—CGTCCTTTGTAACGATCAAG—3′; Poinar et al., 1998), (trnL_c: 5′—CGAAATCGGTAGACGCTACG—3′: trnL_h: 5′—CCATTGAGTCTCTGCACCTATC—3′; Taberlet et al., 1991, 2007), (fwhF2: 5′—GGDACWGGWTGAACWGTWTAYCCHCC—3′: fwhR2n: 5′—GTRATWGCHCCDGCTARWACWGG—3′; Vamos et al., 2017), 0.2 μL of AmpliTaq Gold (AmpliTaq Gold, ABI, USA), 0.6 μL SYBR Green, 2 μL of template eDNA (3× qPCR reactions per eDNA extract) and the remaining volume supplemented with DNase/RNase-Free Distilled Water. The cycling conditions for rbcL, trnL, and COI were initial denaturation at 95°C for 5 min, followed by 40 cycles of 95°C for 30 s, 52°C for 30 s, 72°C for 45 s, and a final extension at 72°C for 10 min. For rbcL and trnL only 2 samples were identified to contain PCR inhibition and these samples were carried forward through the metabarcoding workflow using a 1:10 dilution of the extract. For COI, 8 samples were identified to contain PCR inhibition and were carried forward through the metabarcoding workflow using a 1:10 dilution of the extract.
Environmental DNA samples that were of sufficient quality, as determined by the initial qPCR screen (qPCR dilution series), were fusion tagged with a unique 7–9 bp multiplex identifier tag (MID-tag) for the trnL, rbcL, and COI primer sets. To reduce the likelihood of cross-contamination, chimera production, and MID-tag jumping (Esling et al., 2015), DNA amplification was performed in a single round of amplification using MID-tag primers consisting of the Illumina flow cell adaptors (P5 and P7), a custom sequencing primer binding site, the unique MID-tag combination and the gene-specific primer, either rbcL, trnL, or COI. All qPCR reactions were prepared in a physically separate ultra-clean laboratory at Curtin University designed for ancient DNA work using an automated QIAgility robotics platform (Qiagen Inc.) and were carried out in duplicate reactions of 25 μL which contained 1 x PCR Gold Buffer, 2.5 mM MgCl2, 0.4 mg/mL BSA, 0.25 mM of each dNTP, 0.4 μM of either rbcLh2aF/R, trnL_c/h or fwhF2/R2n, 0.25 μL AmpliTaq Gold, 2–6 μL DNA and the remaining volume supplemented with DNase/RNase-Free Distilled Water. The cycling conditions for the fusion-tagged qPCR using the MID-tag primer sets were the same as described above. Replicate MID-tagged amplicons were pooled at approximately equimolar concentrations (e.g., minipool) based on their respective qPCR DRn values (West et al., 2020). The minipool concentrations were measured using a high-resolution capillary electrophoresis system (QIAxcel; Qiagen Inc.) and the final library was blended equimolar ratio based on the minipool concentrations and size selected (180–350 bp) using a PippinPrep (Millennium Science Pty Ltd., Australia) to remove any off-target amplicons and primer dimer. The size selected final library was quantified using a Qubit Fluorometer (Thermo Fisher Scientific, Australia) prior to high-throughput sequencing (HTS). Sequencing by synthesis was performed on an Illumina MiSeq platform (Illumina, San Diego, CA, USA) located in the Trace and Environmental DNA lab at Curtin University and as per Illumina's protocol for single-end sequencing with a 300 cycle V2 reagent kit and standard flow cell for environmental metabarcoding with a mean sequencing depth of 178,021 per sample.
2.4 Data processing
Sequenced multiplex identifier-tagged amplicons were input to a containerized workflow and run through the Pawsey Supercomputing Centre in Kensington, Western Australia. Here, the sequences were filtered, formed into Zero-radius Operational Taxonomic Units (ZOTUs), and assigned taxonomic identifications. Sequences were quality-checked using FASTQC (Andrews, 2010) and quality-filtered (Phred quality score < 20) before the multiplex identifiers were trimmed from the sequence reads using AdapterRemoval v2 (Schubert et al., 2016). Subsequently, the filtered reads were demultiplexed using OBITOOLS (Boyer et al., 2016), and sequences shorter than the minimum length of 94 bp for plants and 120 bp for arthropods were filtered out. Sequences were then dereplicated into ZOTUs with a minimum sequence abundance of 5 (Drake et al., 2022) using the USEARCH Unoise3 algorithm (Edgar, 2016). Thresholds for clustering and LULU curation between plant and arthropod taxa were tailored for each group based on their unique mutation and hybridization rates (Smith & Keeling, 2015). A database of ZOTUs was then generated and queried against the GenBank (NCBI) nucleotide database with 100% query coverage for both plants and arthropods and 98% identity for plants and a 90% identity for arthropods using BLASTN (Altschul et al., 1990). Erroneous ZOTUs with a sequence similarity below 98% for plants and 96% for arthropods were removed using the LULU postclustering curation method (Frøslev et al., 2017). Finally, a custom Python script (eDNAFlow; Mousavi-Derazmahalleh et al., 2021) was used to assign taxonomic identifications to the curated ZOTUs using the Lowest Common Ancestor (LCA) approach. Taxonomic identification was assigned to a ZOTU when the percentage identity of two or more queried sequences with ≤0.5% difference had 99% query coverage and 95% sequence similarity. Taxonomic identifications for plants and arthropods below 97% identity were retained at the family level. For the purposes of this study, we set the minimum threshold count of 10 reads for plant ZOTUs (see Drake et al., 2022) to classify a taxon as present within a sample. While for arthropod ZOTUs, due to the low number of detections, we only removed singletons. All plant and arthropod taxa detected using eDNA were compared with historical records using the Atlas of Living Australia (https://www.ala.org.au/), a collaborative, digital, open infrastructure that pulls together Australian biodiversity data from multiple sources, to confirm that they occurred within the study region.
2.5 Statistical analysis
All statistical analyses were performed on R 3.5.1 (R Core Team, 2018). Due to the low amplification success of arthropod eDNA from the pan trap water samples, subsequent analyses were only undertaken for pollen data. Plant sequence counts for taxa detected in the marble traps were used as minimum sequence copy thresholds for those same taxa in the pan traps (Bell et al., 2017; Drake et al., 2022). This filtering procedure was included to reduce the presence of artifacts (i.e., inflated read counts and false positives; see Ficetola et al., 2016) from contaminant ambient pollen captured in pan traps. Subsequently, pollen read counts were converted to presence–absence data. To compare between eDNA and floral surveys, the floral survey flowering percentages were also converted into presence–absence data.
To verify if the eDNA method was successful for amplifying pollen eDNA (objective 1) and could provide results comparable to floral surveys (objective 2), we visualized the overlap in species composition according to survey method. To do this, we generated an Adonis Dissimilarity matrix using 9999 permutations. Subsequently, a Principal Coordinate Analysis (PCoA) was created using Jaccard similarity matrices to visually represent the differences in taxonomic composition between the survey methods using the package “vegan” in R Studio. The significance of any apparent differences between the two survey methods was then tested using an Analysis of Similarity (ANOSIM) with the Jaccard similarity matrices and 9999 permutations. Sampling effort was examined using rarefaction curves with 9999 permutations and first-order jack-knifing using the package “vegan” in R. Chao2 alpha diversity indices at the species level were then calculated for the observation-based floral surveys at each orchard (N = 3) and for the combined observation-based floral surveys and eDNA-based pan trap detections at each orchard (N = 3). We calculated Chao2 using the package “fossil” in R. The Chao2 index returns an estimate of richness based on incidence data (Chao, 1984). Secondly, to establish if there was a significant difference between the two extraction methods (objective 1), we compared the reads generated per sample using a paired two-tailed t-test. We then used a Kruskal–Wallis test to determine if the number of species detected per sample differed significantly between the two extraction kits. Finally, to assess potential contamination from ambient pollen to the pan trap dataset (objective 3), we calculated the average percentage reduction in read numbers and plant taxa per pan trap sample following the removal of putative false positives, as per Bell et al. (2017). Lastly, as described above, we generated stacked histograms for the log read count for each genus (pre- and postfalse positive removal) to visualize read reduction for the pan trap samples.
3 RESULTS
3.1 eDNA metabarcoding can be used to amplify arthropod and plant DNA from pan trap water
We generated 14,241,740 raw sequences from the 15 pan trap array samples, 3 marble trap samples, and 8 extraction and PCR controls – amplified using two plant-specific assays and one arthropod assay. In total, 12,828,012 quality-filtered sequences were generated with a mean sequencing depth of 178,021 per sample. For COI, only five pan trap samples (extracted with the Blood and Tissue kit) were successfully amplified and sequenced, the average number of reads per sample was 2880 (±1842 SE) and no reads were generated from the marble traps. For rbcL and trnL, the average number of reads per pan trap array sample was 289,534 (±125,431 SE), while the average number of reads per marble trap was 284,069 (±71,383 SE). One marble trap (extracted with the Blood and Tissue kit) and one pan trap sample (extracted with the Plant Pro kit) failed to amplify for rbcL and both rbcL and trnL, respectively. Four plant ZOTUs, Calamagrostis scotica (9 reads), T. subterraneum (34 reads), Helianthus sp. (8 reads), and Poaceae (8 reads) showed amplification in one of the PCR controls. The DNA reads corresponding to the plant ZOTUs identified in the controls were removed from the pan trap sample dataset (method following Bell et al., 2017) prior to further analyses.
3.2 Arthropod eDNA was not consistently detected from pan trap water
Only 17% of pan trap water samples, all extracted with the Blood and Tissue extraction kit, showed successful amplification for arthropod DNA, while no amplification was achieved for samples extracted with the Plant Pro kit. The amplification success of arthropod eDNA was low despite all of the pan traps showing the presence of arthropod taxa during the morphological identifications (Figure 2; Table S2 in Appendix S1). In total, 13 arthropod families were detected using eDNA metabarcoding of pan trap water of which Chironomidae (35% of detections), Sphaeroceridae (16% of detections), and Phoridae (11% of detections) were the most common families (Figure 2). Morphological identifications of the pan trap samples yielded 17 arthropod families, although here the most common taxa belonged to Apidae (15% of detections), Coelopidae (20% of detections), and Tenebrionidae (13% of detections) (Figure 2; Table S2 in Appendix S1).

3.3 Extraction method did not influence the number of plant species detected using pan traps
The average number of plant reads generated per sample did not differ significantly (p = 0.13) between the Blood and Tissue extraction kit – average reads = 129,658 (±18,269 SE), and the Plant Pro kit – average reads = 158,965 (±16,123 SE). There was no significant difference in the number of plant taxa detected between the DNA extraction protocols used (p = 0.61); both methods on average generated 17 (±0.78 SE) plant taxa per pan trap array (Figure 3a). Taxonomic composition differed between the extraction kits, with three plant taxa only detected in the samples processed with the Blood and Tissue kit and five plant taxa detected in the samples processed with the Plant Pro kit, these species were classified as rare and represented <0.5% of the overall detections (Figure 3b). Given the almost identical plant detections and similar read counts in pan traps between the Blood and Tissue and Plant Pro kits, the two datasets were combined for subsequent analyses.

3.4 eDNA detects more plant diversity than conventional floral surveys
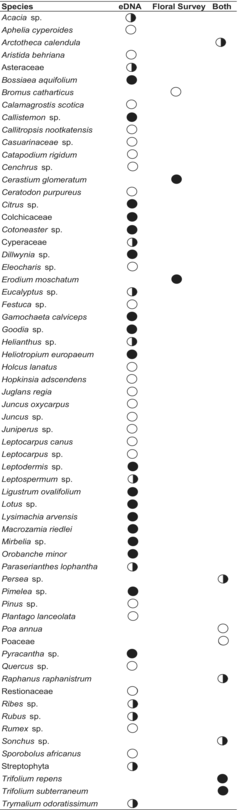
Overall, 30 plant families (33% animal-pollinated, 30% wind-pollinated and 37% both animal- and wind-pollinated) were represented in the pan trap eDNA dataset, of which Asteraceae (A. calendula, Gamochaeta calviceps, Helianthus sp., Sonchus sp.; detected in 100% of pan trap samples), Myrtaceae (Callistemon sp., Eucalyptus spp. and Leptospermum sp.; detected in 100% of pan trap samples), and Fabaceae (Acacia sp., Bossiaea aquifolium, Dilwynia sp., Goodia sp., Lotus sp., Mirbelia sp., Paraserianthes lophantha, Trifolium repens and T. subterraneum; detected in 93% of pan trap samples) were the most common (Table 1 and Figure 4). Many of these plant taxa detected using eDNA were not present within the orchard or adjacent pasture and may represent flowering species beyond the survey area (e.g., Eucalypt Forest located <1 km away from each survey orchard). In contrast to the eDNA results, the floral surveys documented six plant families, of which Fabaceae (T. subterraneum and T. repens; 18% of surveys), Asteraceae (Arctotheca calendula and Sonchus sp.; 16% of surveys), Brassicaceae (Raphanus raphanistrum; 7% of surveys) and Poaceae (Bromus catharticus, Poa annua; 7% of surveys) were the most common (Table S3 in Appendix S1). Four out of the six families documented with the floral surveys were detected in the eDNA pan trap dataset, while only Geraniaceae and Caryophyllaceae were unique to the floral surveys. At the level of species, 64 taxa were found between eDNA and the floral surveys, of which 53 (83%) were unique to eDNA, 3 (5%) were unique to the floral surveys and 8 (12%) were shared between both survey methods (Table 1). The three species that were unique to the floral surveys (Bromus catharticus, Cerastium glomeratum, and Erodium moschatum) had an average percentage cover of <0.01% per 1 m2 quadrat. Predictably, species composition differed significantly between the eDNA and floral survey methods (R = 0.365, p < 0.001) (Figure 5). Although neither method alone appeared to capture the total plant diversity present within the orchards (Figure S1 in Appendix S1). eDNA metabarcoding detected an average of 25 plant species per pan trap array sample (±1.5 SE), while the floral surveys detected an average of 2 species (±0.2 SE) per quadrat. When floral surveys were combined with eDNA metabarcoding, the average alpha diversity per orchard increased from 7.3 (±1.5 SE) to 56.3 (±1 SE).
|
-
Note: Number of plant species identified by each method; eDNA (N = 60), floral survey (N = 10) and shared (N = 8). Some plant taxa rely on both wind- and animal-pollination (Regal, 1982), therefore, we conducted a literature search using Google Scholar to categorize the pollination syndromes of each plant taxa detected. In total, we categorized three pollination syndromes for the plant taxa detected by both survey methods: animal-pollinated (N = 22), wind-pollinated (N = 27) and mixed animal- and wind-pollinated (N = 15). Although not captured in the quadrats (and, therefore, not included in the statistical analysis), P. americana was counted as present for the floral surveys based on visual observation of the trees flowering.
 Animal-pollinated;
  Wind-pollinated;
  Both animal- and wind-pollinated.


3.5 Ambient plant DNA is a significant contribution to pan traps
Sequence counts generated from the marble trap samples were used as minimum sequence copy thresholds for the pan traps when plant taxa were found in both (Figure S2 in Appendix S1). With this method, the average reads per sample were reduced by 60% (±6.7 SE), 55% (±7.3 SE) and 13% (±4.2 SE) for three survey orchards, respectively. One wind-pollinated species (Rumex acetosa) was removed from the pan trap dataset with this filtering procedure. Per sample, the removal of putative false positives reduced the average number of plant taxa detected in the pan traps by 53% (±5.5 SE), 51% (±3.8 SE), and 10% (±1.9 SE) for the three survey orchards, respectively.
4 DISCUSSION
Terrestrial arthropod biomass and species diversity are threatened globally, with some monitored populations showing mean abundance declines of ~45% in the past 40 years alone (Dirzo et al., 2014; Wagner, 2020). Despite such threats, however, much remains unknown about wild pollinators in both natural and agroecosystems (Biesmeijer et al., 2006; Potts et al., 2016). New survey methods are, therefore, needed which can help monitor arthropod pollinators, as well as the plant resources upon which they rely (Bell et al., 2019, 2022; Evans & Kitson, 2020). Here, we provide new insights on a novel approach to detect plant resources used by arthropods within agricultural landscapes. The three most commonly detected plant families from metabarcoding of pan trap water (Asteraceae, Myrtaceae, and Fabaceae) are all known to require arthropod pollination to facilitate or enhance fruit set. eDNA metabarcoding also identified species that were not detected using the conventional floral surveys, indicating the detection of plant species beyond the orchard boundaries (however, see section Pan trap pollen – ambient or animal-mediated? below). Our results provide compelling evidence that metabarcoding can be combined with pan trapping techniques to identify potential plant resources used by arthropods in agricultural systems.
4.1 Extracting arthropod and plant DNA from pan traps
Arthropod taxa were not consistently detected in pan traps by eDNA metabarcoding, using either DNA extraction method, and little overlap was found between the eDNA and morphological datasets. Previous studies comparing eDNA metabarcoding of homogenized bulk-tissue macroinvertebrate samples and ethanol from preserved nonhomogenized bulk-insect samples detected similar low read counts and reduced species detections (Persaud et al., 2021; Zizka et al., 2018). For instance, Persaud et al. (2021) showed that <10% of the OTUs from nonhomogenized ethanol eDNA were retained in the final dataset and that there was minimal overlap (0%–1.4% OTU overlap) between the ethanol eDNA and paired homogenized bulk-tissue samples. In the present study, the lack of consistent arthropod detections (only 17% of pan trap samples) may be caused by the presence of an exoskeleton reducing the release of DNA (see Shokralla et al., 2010; Zizka et al., 2018). The choice of destructive versus nondestructive sampling will depend on the study aims. Our aim was to minimize the contribution of herbivorous plant material from the gut contents of arthropods by preserving whole specimens, however, if future studies wish to detect a greater number of arthropod taxa from pan trap water, then we would recommend suspending bulk arthropod samples in a lysis buffer as an initial step in DNA extraction. This nondestructive approach has previously generated comparable arthropod detections to homogenized bulk samples (see Kirse et al., 2022), while also retaining whole specimens for morphological identification and abundance data. Additionally, this approach may reduce the contribution of ingested material from captured arthropods (although regurgitant can contain ingested material from flower visits, see Bowie et al., 1999). However, further testing remains necessary to verify if of the transfer of arthropods to a lysis buffer could compromise “true” arthropod-mediated pollen detections from pan trap water.
In contrast to the low number of arthropod species detections, metabarcoding of pan trap water enabled consistent plant identification across all pan trap arrays. Pan traps provide a passive and cost-effective means to capture arthropods without observer bias, which is probably a contributing factor to their growing use in terrestrial surveys (Prendergast et al., 2020; Westphal et al., 2008; Wilson et al., 2008). So far, however, the use of pan traps to detect animal-mediated pollen has relied largely upon microscopy-based techniques (Ladd et al., 2019; Popic et al., 2013) and few studies have quantified the contribution of ambient pollen to total plant diversity. Our combined approach using eDNA metabarcoding of pan and marble traps allowed for the identification of known arthropod-pollinated plant species, while minimizing artifacts from nontarget ambient pollen. In contrast to approaches based on pollen loads of individual arthropod specimens (e.g., Pornon et al., 2017), eDNA metabarcoding of pan trap water provided a measure of the total plant diversity supporting the captured arthropod community, but cannot be used to infer individual arthropod-plant interactions due to the mixed species pool in the pan traps. Although, the total plant diversity captured from pan traps may provide arthropod community-level foraging measures, which could be used to make generalizations about fluctuations in key floral resources through time (i.e., relative abundance of plant taxa). Such measures may help capture the dynamic and often generalized nature of arthropod-plant interactions (Waser et al., 1996). In total, eDNA metabarcoding of pan trap water detected 30 plant families, representing at least 60 species, of which 53 species were unique to the eDNA dataset. Our findings also echo those of Campbell et al. (2018), who found that 30 pan traps could collect over 15,000 pollen grains, suggesting that this passive sampling technique can provide a rich source of information for local arthropod foraging resources. Further, many of the plant species in the eDNA dataset were expected, for instance, we consistently detected annual weed species (e.g., Arctotheca calendula and Raphanus raphanistrum) in all of our field sites, which was not surprising given that we sampled in spring and all of the sample orchards were adjacent to pasture.
Both DNA extraction methods detected similar plant communities. Nevertheless, each extraction kit identified a few unique taxa (Blood and Tissue; N = 3, Plant Pro; N = 5), although these taxa were all uncommon (<0.5% of detections) and probably reflects stochasticity in sampling (Jensen et al., 2022). We stress that eDNA metabarcoding of pan trap water, like any new substrate, will require further testing of additional DNA extraction kits used for pollen metabarcoding (i.e., DNeasy PowerSoil Pro kit; see Johnson et al., 2019a) and plant assays (i.e., ITS2; see Cheng et al., 2016) to determine the optimal procedure for this method.
4.2 Complementarity of eDNA metabarcoding and conventional floral surveys
A major shortcoming of floral surveys is that they are limited to the area that they can encompass, meaning multiple survey trips are often necessary to produce robust data (Uniyal & Singh, 2014). Also, at locations with high plant species diversity, broad taxonomic expertise required to identify plant species may not be available (O'Connor et al., 2019). Consequently, floral surveys may be appropriate for some systems (e.g., small-scale farms with low plant species diversity), although at the typically large scales of many food production systems, these surveys may benefit from the addition of eDNA metabarcoding of pan trap water (Kestel et al., 2022).
In our study, only eight species (12%) were shared between the eDNA metabarcoding and flora surveys, which may reflect arthropod foraging beyond the pasture area surveyed. Floral surveys conducted at a larger spatial scale may have detected more plant taxa and reduced the disparity between the two methods. Differences in taxa identified with eDNA metabarcoding-based surveys of biodiversity and those using other methods are not uncommon (Johnson et al., 2021; Kestel et al., 2023; Ryan et al., 2022). For example, when comparing plant communities detected with air eDNA to those identified from conventional transect surveys, Johnson et al. (2021) detected more rare flowering forb species (e.g., Berlandiera lyrata) with transect surveys than with eDNA. Indeed, for our study, conventional floral surveys detected Bromus catharticus (wind-pollinated), Cerastium glomeratum (animal-pollinated), and Erodium moschatum (animal-pollinated), none of which were identified using eDNA metabarcoding, although sequences for the three species for both trnL and rbcL are present on NCBI and an in silico analyses confirmed that primers would bind to target DNA sections. However, all three species were rare (<0.01% flowering per 1 m2 quadrat) and potentially occurred at levels below the detection thresholds possible for pollen metabarcoding of pan traps. If the intention of surveys is to detect all plant species in a given area, we stress the need for complementing eDNA metabarcoding of pan trap water with conventional floral surveys with a more intensive survey effort than what was used in the present study, to capture and identify potential false negatives that could arise in the eDNA metabarcoding dataset. Additionally, by including these surveys using other approaches, measures of species abundance and percentage flowering can also be generated, information which is otherwise difficult to infer from the presence–absence values generated from eDNA (see Bell et al., 2019).
4.3 Pan trap pollen – Ambient or animal-mediated?
In our study, we used plant DNA collected in marble traps to filter out ambient pollen and airborne plant sequencing reads from the pan trap dataset (Figure 4; Figure S2 in Appendix S1). With this method, we were able to significantly reduce the contribution of airborne plant DNA to the final data (Figure S2 in Appendix S1), however, we acknowledge that the use of marble traps only minimizes the contribution of ambient plant DNA (e.g., airborne pollen and plant tissue) and does not eliminate it completely. For instance, species belonging to Poaceae and Cupressaceae were still found in 80% of the pan trap samples, even though both plant families primarily rely on wind-pollination (García-Mozo, 2017; Takaso & Owens, 2008). Similar results have been shown with HTS approaches used to measure trophic interactions for insects in agricultural ecosystems (see Batuecas et al., 2022). Here, metabarcoding the wash water from external surfaces of Rhagonycha fulva individuals showed the presence of 11 plant taxa, including wind-pollinated Poaceae spp. and Pinus spp. Thus, although marble traps can reduce the contribution of ambient plant DNA to the pan trap detections, the incidental collection of wind-pollinated pollen (either during feeding or while flying; see Batuecas et al., 2022) is more challenging to ascertain. Indeed, the water collected from pan traps will likely contain plant DNA originating from the digestive tracts of captured arthropods, which may represent nonpollen material (i.e., leaf and stem tissues) collected during foraging or nest building (Batuecas et al., 2022; Evans & Kitson, 2020; McPherson et al., 2022). Thus, an understanding of the presumed pollination syndrome of each plant taxa detected remains essential to help determine which plant detections represent potential floral resources and which represent nontarget airborne plant material.
The recent application of eDNA metabarcoding to air samples (e.g., Clare et al., 2021; Johnson et al., 2021) presents a critical innovation for this molecular survey method, one which could further improve the resolution of studies of arthropod-plant interactions using pan traps. In the present study, we addressed the presence of ambient pollen and plant material using marble traps to generate relative quantifications of nontarget eDNA (see Johnson et al., 2019b), which could otherwise add artifacts, such as inflated read counts and false positives (see Ficetola et al., 2016). The marble traps proved to be a scalable, cost-effective, and simple method to produce minimum sequence copy threshold values (Bell et al., 2017; Drake et al., 2022). Despite this, however, we acknowledge that incorporating higher minimum sequence copy thresholds to complement the marble traps could help further increase the reliability of floral resources detected with pan traps, although at the risk of increasing false negatives (Drake et al., 2022). These minimum sequence copy thresholds could be improved by incorporating novel techniques developed in air eDNA studies to accurately determine false positives due to ambient pollen. Since Longhi et al. (2009) first characterized DNA from airborne pollen, numerous authors have targeted airborne pollen and plant material (Emenyeonu et al., 2018; Johnson et al., 2019a, 2019b; Kraaijeveld et al., 2015). Emenyeonu et al. (2018) provided a proof-of-concept study to detect trace amounts of aerosolized “seed dust” DNA by using a purpose-built air sampler able to filter air at 620 L/min. Increasingly, these high-volume active air samplers are being combined with autonomous technologies to allow for long-term pollen monitoring (see Khan et al., 2022). Such technologies present an opportunity to improve the accuracy of thresholds by using ambient plant eDNA counts that are derived by a combination of methods, rather than relying on one method alone. In this way, future studies could potentially remove a greater proportion of artifacts and increase the reliability of the floral detections; without removing too much data and generating false negatives (see Hänfling et al., 2016). Together, this combined approach integrated with internal standards (see Harrison et al., 2020), could also help generate absolute quantification values for pollen and allow for the standardization of read numbers across samples.
While the marble trap minimum sequence copy thresholds proved effective at reducing the contribution of ambient pollen and plant material in the pan traps, this filtering procedure may have also generated false negatives in the eDNA dataset. False negatives arise when species actually present are missed during detection, potentially leading to underestimates of species richness and, in the case of the present study, reducing the diversity of flowering and habitat plants detected for captured arthropods (Ficetola et al., 2015). In the eDNA dataset, two plant families (Colchicaceae and Lauraceae), both of which are largely animal-pollinated (Barrett & Case, 2006; Ish-Am, 2005), detections were reduced by 47% and 40%, respectively, from the pan traps by using minimum sequence copy thresholds set by the marble traps. Although these taxa may have been correctly removed as nontarget ambient eDNA (e.g., Lauraceae species can be wind-pollinated; see Ish-Am, 2005), there is a possibility that they represent false negatives, generated by similar sequence reads between the marble traps and the pollen and plant material actually carried by the arthropods captured in the pan traps; however, in the present study, for the purposes of assessing the viability of eDNA metabarcoding of pan trap water, an overcautious approach was deemed preferable to reduce the opportunities for inflated foraging species diversity measures.
4.4 Incorporating pan trap eDNA into agricultural monitoring
The plant resources supporting arthropods in natural and agricultural landscapes are of increasing interest, largely because of the increasing threats to global arthropod abundance and species diversity, as well as the increasing recognition of wild native pollinators as important contributors to crop yields. We have demonstrated that eDNA metabarcoding of pan trap water can be used to identify the plant resources arthropods rely on. This approach complements long-standing survey methods and may potentially improve the characterization of arthropod-plant interactions in agroecosystems (Kestel et al., 2022). Such an approach also lends itself to modification depending on the research context and questions. For instance, pan traps could be deployed during crop flowering to capture potential pollinators and cross-validated with the inclusion of cameras to monitor flower visits for the crop species of interest. Such information is needed for identifying which floral resources are critical to managing arthropod communities in food production areas (e.g., encouraging nonbee pollinators to remain in orchards and improve crop production; see Cook et al., 2020; Rader et al., 2016; Senapathi et al., 2021). Surveys and monitoring using eDNA metabarcoding of pan trap water could easily be tailored to different studies by, for example; (1) varying the number of biological replicates to accurately represent arthropod communities at orchards of different spatial scales, and; (2) pooling samples across pan trap arrays depending on the available budget. As application of this method is in its infancy, we acknowledge that more studies are required to generate reliable data. Controlled experiments are needed to address the “incidental” collection of eDNA by arthropods, such as the accumulation of plant eDNA from neutral arthropod-plant interactions (e.g., an arthropod taxa resting on a leaf) (though see Kudoh et al., 2020; Thomsen & Sigsgaard, 2019). Such baseline studies will help further unravel which eDNA detections likely arise from animal-mediated pollen transport, thereby allowing for more detailed conclusions concerning pollinator foraging within agroecosystems. In conclusion, the availability of this approach will modernize floral resource surveys by reducing constraints on survey effort and enabling rapid identification of arthropod-plant interactions. However, the limitations of the method must be carefully considered to allow for robust management decisions based on data from this new molecular tool.
AUTHOR CONTRIBUTIONS
JHK: Conceptualization, methodology, visualization, writing—original draft. DLF: Conceptualization, writing—original draft, writing—review & editing. PWB: Conceptualization, methodology, writing—original draft. KLB: Writing—original draft, writing—review & editing. NEW: Writing—original draft, methodology, writing—review & editing. PN: Conceptualization, writing—original draft, methodology, writing—review & editing.
ACKNOWLEDGMENTS
We acknowledge the traditional owners of the land on which the research presented here was undertaken, the Whadjuk Noongar people and Bibulmun/Piblemen people, and pay our respects to Elders past, present, and emerging. We are also indebted to William Thomas, Lily Whelehan, and Terry Kestel for generously building the pan trap stands and helping with the fieldwork. We would also like to thank Chris Swinstead and Terry Huston for identifying the arthropod specimens and Doug Pow, Shane Bendotti, and Barry Dunnet for allowing us to access their orchards in 2021.
The development and application of this project “eDNA for the classification and management of plant pollinator networks in an agroecosystem” is funded by the Hort frontiers Pollination fund, part of the Hort frontiers partnership initiative developed by Hort Innovation, with co-investment from the Avocado Research and Development levy, Curtin University, and through funding from the Australian Government in partnership with South West Catchments Council. Open access publishing facilitated by Curtin University, as part of the Wiley - Curtin University agreement via the Council of Australian University Librarians.
CONFLICT OF INTEREST STATEMENT
No conflicts of interest.
Open Research
DATA AVAILABILITY STATEMENT
Sequencing and sample data and DADA2 script are available at https://datadryad.org/stash/share/jdj36J9ZDcCQtDF9vhl5TWHGL0mwfpUen46H2pEnvgM.