Enhancement of Integrated Waste Activated Sludge Fermentation and Denitritation by Addition of Sodium Dodecyl Sulfate
Abstract
Integrated waste activated sludge fermentation and denitritation (WASFD) is an efficient energy-saving approach to treat wastewater and sludge at the same time. This study aimed at simultaneously promoting WASFD by adding sodium dodecyl sulfate (SDS). The batch-mode tests showed that total volatile fatty acids (consisting of VFAs consumed for denitritation and VFAs observed) increased significantly at SDS dosages of 0.02–0.1 g/g dry sludge at room temperature. After 12 h, the released ammonium nitrogen reached the peak value at 0.1 g/g SDS, and decreased by 75.1% at 0.02 g/g SDS. Released phosphorus decreased by 63.1% at 0.02 g/g SDS compared to the peak value at 0.15 g/g SDS. Further investigation showed that the denitritation rate was enhanced at 0.02–0.05 g/g SDS. From the above, a suitable SDS dosage of 0.02 g/g is beneficial for WASFD with a relatively minor undesirable nutrient release from sludge fermentation.
Abbreviations
-
- BNR
-
- biological nitrogen removal
-
- COD
-
- chemical oxygen demand
-
- EPS
-
- extracellular polymeric substances
-
- NH4+-N
-
- ammonium nitrogen
-
- NO2−-N
-
- nitrite nitrogen
-
- ORP
-
- oxidation-reduction potential
-
- PO43–-P
-
- phosphorus
-
- SCOD
-
- soluble COD
-
- SDS
-
- sodium dodecyl sulfate
-
- TSS
-
- total suspended solid
-
- T-VFA
-
- total VFA
-
- VFA
-
- volatile fatty acid
-
- VSS
-
- volatile-suspended solid
-
- WASFD
-
- waste activated sludge fermentation and denitritation
-
- WWTP
-
- wastewater treatment plant
1 Introduction
The presence of nitrogenous or nitrogen-containing wastes (mainly containing nitrite ions (NO2−), nitrate ions (NO3−), and ammonia ions (NH4+)) in the final effluent of an activated sludge process can adversely impact or pollute the quality of the receiving water. Significant pollution concerns related to the presence of nitrogenous wastes include toxicity, eutrophication-dissolved oxygen depletion, and methemoglobinemia 1. Biological nitrogen removal (BNR) in wastewater treatment plants (WWTPs) is commonly achieved in a two-stage process consisting of nitrification and denitrification 2. Sufficient organic substrates in wastewater are required for heterotrophic denitrifiers to reduce nitrite (NO2−) or nitrate (NO3−) 3. However, the shortage of carbon sources in the influent tends to be a major problem in some WWTPs, such as in South China. External chemical carbon sources (e.g., methanol, acetate) are added in order to achieve proper carbon to nitrogen (C/N) ratios 4, 5, but this step substantially increases the process complexity and operational costs. Alternatively, volatile fatty acids (VFAs) produced by disintegration or fermentation of waste activated sludge (WAS) can be used as internal carbon sources for BNR, which not only saves the operational costs spent on extra chemicals, but also reuses the organic substances in WAS 6, 7.
Acidogenic fermentation of sludge reported by previous studies have focused on primary sludge 8. WAS (i.e., excess sludge) contains high extent of organic substances in particulate or soluble forms, which are suitable for being utilized as fermentation feedstock 9, 10. Generally, there are four phases in traditional WAS anerobic digestion (Supporting Information Fig. S1a), including solubilization of particulate organic carbon in sludge, hydrolysis of solubilized substrates, acidification of hydrolyzed products, and generation of methane 11. During WAS anerobic digestion, proteins and carbohydrates are hydrolyzed to organic acids, which is believed to be the rate-limiting step 12. Thus, the digestion efficiency was explored to enhance by improving sludge hydrolysis rate, such as thermal, ultrasonic, thermo-chemical, mechanical, and microbiological methods 13.
A novel-integrated WAS fermentation and denitritation (WASFD) process was put forward in which denitritation occurred by using organic compounds produced from in situ sludge fermentation 14. Due to the feeding or generating of NO2−, oxidation-reduction potential (ORP) is thus increased in this process 15, 16. On the other hand, methanogens are obligatory anerobic bacteria and only viable at low ORPs (−500 to −520 mV) 17 while denitrifiers are anoxic bacteria and survive at a relatively high ORP (−104 mV) 18. Therefore, methanogenesis is inhibited in the WASFD process, organic substances are subsequently utilized by denitrifiers, and NO2− is then reduced to N2.
Surfactants (including sodium dodecyl sulfate (SDS)) have been found in the aquatic environment at μg/L levels mainly due to their widespread usage and discharge of sewage effluents into surface waters. They are also measured in sludge-amended soils because of the high residual concentrations in sludge 19. Due to its comparatively low cost, SDS has been widely used in industrial and household detergent formulations and thus, wastewater contains large amounts of SDS. Extracellular polymeric substances (EPS) are primarily composed of microbial produced biopolymers (e.g., carbohydrates and proteins), and the solubility of them can be improved by SDS 20. After the break-up of sludge matrix caused by the enhanced solubilization of EPS, the sludge macromolecular organic compounds are easily degraded by hydrolytic enzymes 21. Because of its amphoteric character, SDS can adsorb on both hydrophobic and hydrophilic surfaces, and can interact with hydrophobic and hydrophilic molecules either by binding or by forming mixed micelles. The occurrence of binding of anionic surfactants to proteins and peptides has been demonstrated many times. This binding may result in the alteration of the folding of the polypeptide chain and the change of the surface charge of the molecule. The modification of structure and charge may lead to modified biological functions 22. In the hydrolysis and acidification of WAS, Jiang et al. 20 reported that increasing the SDS dosage to 0.2 g/g, the activity of α-glucosidase and acidic phosphatase decreased, but lower amounts of SDS (such as 0.02 g/g) could improve enzyme activity of proteases, α-glucosidase, acidic and alkaline phosphatases. Furthermore, high SDS dosages would inhibit the activity of methanogens, for example, the lag-phase of methane generation increased with the dosage of SDS, but at SDS dosages <0.05 g/g, the influence was slight with no lag-phase appearing 23.
In this study, the effect of SDS on WASFD (Supporting Information Fig. S1b) was investigated to explore a more cost-effective and energy-saving approach to utilize WAS easily as an internal carbon source for in situ denitritation.
2 Materials and methods
2.1 WAS source
The experimental sludge was collected from a pilot-scale sequencing batch reactor (SBR) (volume: 7 m3) at the end of the anoxic stage. By using domestic wastewater collected from Beijing University of Technology (Beijing, China), the pilot-scale SBR was operated with a cycle time of 8 h consisting of feeding, aerobic, anoxic, settling decanting and idle periods, with a sludge retention time of 33 days, and a hydraulic retention time of 12 h. The collected sludge was washed three times, and then fixed to a concentration of 10 g/L suspend solids with distilled water for the batch tests. The characteristics of WAS are listed in Tab. 1.
| Parameter | Value |
|---|---|
| pH | 7.01 ± 0.13 |
| TSS | 9800.2 ± 89.1 |
| VSS | 8627.6 ± 64.3 |
| TCOD | 14 160 ± 420.3 |
| SCOD | 50.3 ± 8.6 |
| Carbohydrates | 1032 ± 102.5 |
| Proteins | 4632 ± 214.5 |
| Soluble NH4+-N | 4.11 ± 1.12 |
| Soluble PO43−-P | 16.73 ± 3.22 |
- TCOD, total chemical oxygen demand.
- a) All values are expressed in mg/L except pH.
2.2 Batch-mode tests for the effect of SDS dosages on WASFD
The effect of SDS dosages on WASFD was investigated in seven batch-mode reactors (volume: 1.6 L, made of Plexiglass) at ambient temperature (19 ± 1°C). All reactors were equipped with magnetic stirrers and operated for 12 h. At the beginning, nitrite was added to six batch reactors (initial concentration: 100 mg N/L) and SDS was added at dosages/dry sludge ratios of 0, 0.02, 0.05, 0.1, 0.15, 0.2 g/g, respectively. The reactor with neither nitrite nor SDS addition was set as the blank test.
Approximately, 15 mL of mixed liquor was taken from seven reactors each hour and then filtered through disposable Millipore filter units (0.45 μm pore size). Afterwards, the filtrate was analyzed for VFAs, carbohydrate, protein, ammonium nitrogen (NH4+-N), nitrite nitrogen (NO2−-N) and phosphorus (PO43−-P), and the filter was assayed for volatile-suspended solid (VSS) and total suspended solid (TSS).
2.3 Denitritation tests at low SDS dosages
Three batch tests were conducted to assess the enhancement of denitritation at low SDS dosages (0.02–0.05 g/g). About 2.4 L of mixed liquor with a TSS concentration of 5350 mg/L was divided equally into three batch-mode reactors (working volume: 1 L). SDS concentrations of 0, 0.02, and 0.05 g/g were added individually to the three reactors and then completely mixed. Afterwards, 0.5 g sodium acetate and 0.6 g sodium nitrite were added to each reactor, resulting in an initial soluble chemical oxygen demand (SCOD) of 0.49 mg/L and NO2−-N concentration of 0.15 mg/L. Since the carbon source was sufficient in these reactors (i.e., initial C/N = 3.2; theoretically, 1.71 g COD is required to reduce 1 g NO2−-N), thus, the nitrite reduction rate represented the maximum denitritation activity of microorganisms.
To measure the capability of denitritation, mixed liquor was taken every 10 or 20 min during the operational period of 110 min, and filtered through disposable Millipore filter units (0.45 μm pore size) for the analysis of NO2−-N. The reason for using 110 min duration in these denitritation tests was detection of a high denitritation rate (41.6 mg N/(L · h)) in the pilot-scale SBR plant. The denitritation rate was calculated using linear regression analysis.
2.4 Analytical methods
With glucose as the standard, soluble carbohydrates were analyzed using the anthrone colorimetry method 24. With bovine serum albumin as the standard, soluble proteins were determined using the Lowry–Folin method 25. VSS and TSS were measured according to Standard Methods 26. By flow injection analysis (LACHAT Quikchem8500 Series 2, Lachat Instrument, Milwaukee, Wisconsin), the concentrations of NH4+-N, NO2−-N, and PO43−-P were assayed.
For the VFAs analysis, the filtrate was collected in a 2 mL gas chromatography (GC) vial and acidified with 10% H3PO4 to pH 4. The VFAs components were measured using an Agilent 7890A GC with an automatic liquid sampler, a flame ionization detector, and a capillary polarity column (DB-WAXetr, 30 m × 530 µm × 1 µm). For the oven, the initial temperature was set at 80°C for 1 min, then increased to 160°C at a rate of 20°C/min and held for 1 min, followed with a ramp of 5°C/min for 4 min and with a temperature of 180°C for 2 min. The temperatures of the injector and detector were set at 220 and 250°C, respectively. The total VFAs (in terms of chemical oxygen demand (COD)) were calculated as the sum of measured acetic, propionic, n-butyric, iso-butyric, n-valeric, and iso-valeric acids by multiplying the conversation factors 12. Each sample was analyzed in triplicate and the standard deviations were <5%.
3 Results and discussion
3.1 Effect of SDS dosage on total VFAs production
 (1)
(1)The T-VFAs production at various SDS dosages and experimental times is shown in Fig. 1. The T-VFAs production increased significantly with a maximum at 0.02–0.1 g/g SDS, and a high percentage of VFAs were consumed for denitritation (Supporting Information Fig. S2), whereas T-VFAs were much lower in the cases of higher SDS concentrations (0.15, 0.2 g/g). For example, the highest T-VFAs concentration was 195.6 mg COD/L at 0.02 g/g SDS, 216.4 at 0.05 g/g, and 239.7 at 0.1 g/g, while it was only 120.6 mg COD/L at 0.15 g/g SDS, which might be due to the toxic effects of higher surfactant concentrations to acidogenic bacteria or denitrifiers.
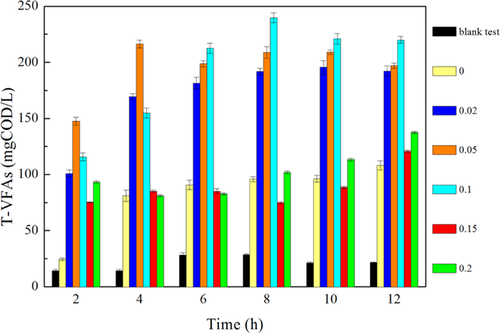
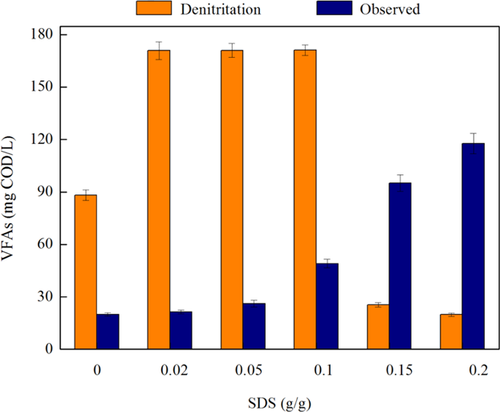
It is worthwhile to note that compared with T-VFAs in the blank test (with neither SDS nor nitrite addition), they were much higher at SDS dosage of 0 g/g (with initial nitrite concentration of 100 mg N/L) during the experiment, indicating that denitritation reaction enhanced sludge acidification as previous studies reported 14. Further comparison between T-VFAs at SDS dosages of 0.02–0.1 g/g blank test samples (SDS = 0) showed that T-VFAs improved by 1.8 times compared to blank test after 4 h. However, it kept almost the same at SDS dosages of 0.15–0.2 g/g (Fig. 1), indicating that suitable dosages of SDS also improved acidification. Two reasons for higher T-VFAs production at low SDS dosages (0.02–0.1 g/g) were proposed. First, denitritation was inhibited by high SDS levels. The SCOD consisted of soluble proteins, soluble carbohydrates and observed VFAs, and its concentration at high SDS dosages (0.15 or 0.2 g/g) was much higher compared to low SDS dosages (Supporting Information Fig. S3). However, T-VFAs concentrations were lower (Fig. 1), and most was accumulated (Fig. 2), deducing that denitritation might be inhibited accordingly. Second, methanogenesis was not limited without SDS addition. The lag-phase of methane generation was about 2 days at 0.1 g/g SDS according to a previous report 23, and we speculated that the activity of methanogens might also be inhibited at low SDS dosages in this study, whereas without SDS (SDS = 0), a certain amount of VFAs were consumed by methanogens.
3.2 Effect of SDS dosages on the release of NH4+-N and PO43−-P
During the sludge acidification stage, ammonia is generated by the degradation of nitrogenous substrates, mostly in the form of sludge proteins, which is hydrolyzed to amino acids and further degraded to ammonia. Previous study demonstrated that WAS fermentation substantially increased the soluble NH4+-N and PO43−-P 28. Figure 3a shows the effect of SDS on released NH4+-N at different times. It was obvious that the NH4+-N concentrations in each reactor increased gradually with time. However, the amounts of NH4+-N released at different SDS dosages were quite different. Compared with the blank test, 0 and 0.02 g/g SDS, the NH4+-N concentrations at higher SDS dosages (0.1, 0.15, and 0.2 g/g) were significantly higher. For example, ammonia increased from 4.1 mg/L at time 0 h to 13.7 mg/L at time 12 h at an SDS dosage of 0.02 g/g, while it increased to 55.0 mg/L at SDS dosages of 0.1 g/g, which was eight times that at 0.02 g/g SDS. Since bacterial cells contain PO43−-P, WAS fermentation also released this nutrient into solution. Figure 3b shows the effect of SDS on released PO43−-P at different times. The concentrations of PO43−-P reached maximum at SDS dosages of 0.15 and 0.2 g/g, except for 0.1 g/g, which was different from the influence of SDS dosages on NH4+-N release. Moreover, phosphorus increased from 16.7 mg/L at time 0 h to 42.1 mg/L at time 12 h at 0.02 g/g SDS, while it increased to 114.2 mg/L at 0.15 g/g SDS. The PO43−-P concentration at 0.02 g/g SDS decreased by 63.1% compared to the peak value at 0.15 g/g SDS.
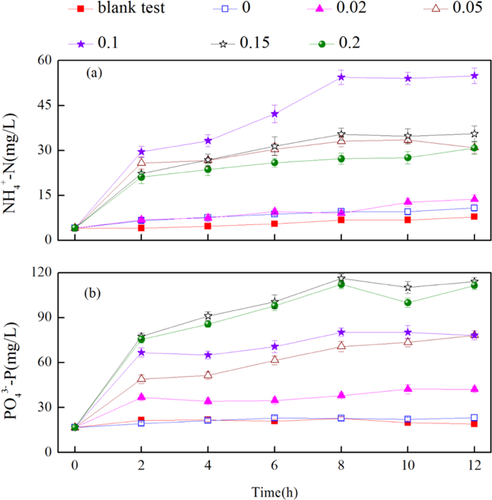
Sludge is not a good substrate for fermenting bacteria, since carbon substrates, nitrogenous organics, and phosphorus are contained within the bacterial cell membrane. This membrane must be ruptured for this material to become available for fermentation 29. One possible reason for low NH4+-N production at the highest SDS concentration was that ammonia was released from amino acid fermentation (an intermediate step) 12 and the toxicity of stronger surfactants might decrease the activity of sludge hydrolytic enzymes, such as proteases, peptidases, etc. 20, 30. However, the possible reason for high PO43−-P at the highest SDS was due to stronger cell lysis and subsequent PO43−-P release without intermediate steps. Previous studies indicated that the concentration of released NH4+-N was higher than PO43−-P during WAS anerobic digestion 30, 31, but an opposite trend was observed in the WASFD with SDS addition, and further investigations are required to find out the reason. Moreover, in comparison with NH4+-N and PO43−-P concentrations in the blank test (with neither nitrite nor SDS addition), there was slight variation for SDS = 0 (without SDS but 100 mg N/L nitrite addition) throughout the experimental period, which indicated that the addition of SDS, rather than nitrite, contributed to higher concentrations of NH4+-N and PO43−-P. Since the significant amounts of ammonia and phosphorus increased the loading for WWTPs and decreased the wastewater treatment efficiency, and lower amounts of these nutrients released was favorable. Therefore, the SDS dosage of 0.02 g/g was suitable with a relatively minor undesirable nutrient release from sludge fermentation.
3.3 Effect of SDS dosages on denitritation
The effect of various SDS dosages on denitritation was determined (Fig. 4). The SDS test with a concentration of 0 g/g had a distinct lag phase for denitritation, with 48 mg/L of residual NO2−-N after 12 h. In contrast, 100 mg/L NO2−-N was completely reduced within 4, 6, and 6 h at SDS dosages of 0.02, 0.05, and 0.1 g/g, respectively. It is worthwhile to note that the concentrations of released NH4+-N in 12 h (Fig. 3a, 13–55 mg/L) were much lower than the initial NO2−-N (100 mg/L) with SDS addition, which demonstrated the feasibility of denitritation to remove nitrogen by using in situ organics produced from sludge fermentation. The reduction of NO2−-N proceeded well at low SDS dosages (0.02–0.1 g/g), but its concentration changed little at high SDS dosages (0.15 and 0.2 g/g). On the other hand, COD and VFAs were accumulated at high SDS dosages (Fig. 2 and Supporting Information Fig. S3), which demonstrated that carbon sources were not the limiting factors for denitritation, and thus, high SDS levels probably suppressed the activity of denitrifiers.
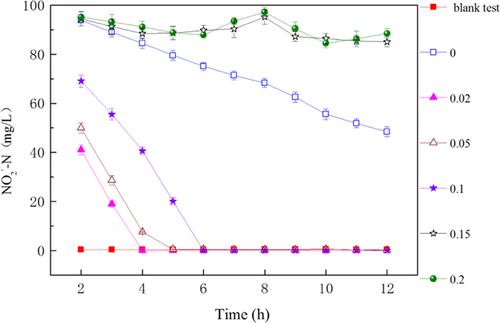
The response of denitritation to SDS dosages was further demonstrated. The SDS dosage of 0.05 g/g caused only 9% decrease in denitrifiers’ activity (i.e., nitrite reduction rate) in comparison to 0.02 g/g SDS, while 0.1 g/g SDS caused 50% inhibition. Moreover, the inhibition of denitritation activity was not always observed at low SDS dosages but became more common at high SDS dosages of >0.15 g/g. There were two main reasons for the inhibition of denitritation at higher SDS concentrations: (i) the direct interaction of surfactants (SDS in this study) with extracellular enzymes responsible for denitritation, and (ii) the inhibition of bacterial metabolic activity for the production of extracellular enzymes 32. The continuous exposure to SDS might overwhelm detoxification in denitrifying bacteria, and resulted in a lower denitritation activity at high SDS dosages 33.
3.4 Enhancement of WASFD by SDS addition
 (2)
(2) (3)
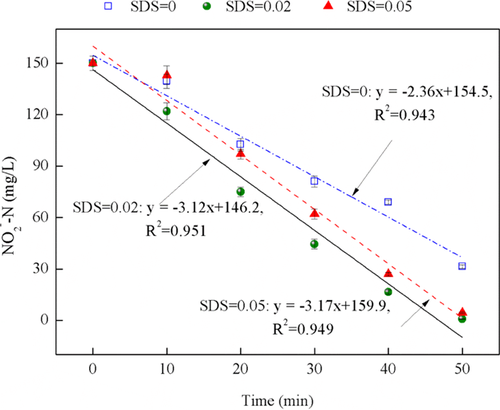
(3)Nitrite reduction with WAS fermentation product as carbon source at low SDS dosages (0.02 and 0.05 g/g) was profiled (Fig. 5). It shows that nitrite consumption trends at both levels were similar to that without SDS. A linear regression was used to fit the zero-order model with the slope k equaling to the zero-order denitritation rate constant for nitrite reduction (Eq. 3). The results demonstrated that the denitritation rates were 2.36, 3.12, and 3.17 mg/(L · min) at SDS dosages of 0, 0.02, and 0.05 g/g, indicating that suitable SDS dosages (0.02 and 0.05 g/g in this study) enhanced the denitritation activity.
Fermentation and denitritation was enhanced simultaneously in the WASFD system by SDS addition (Supporting Information Fig. S1 and Tab. 2). Protein, carbohydrate, and VFAs concentrations observed (VFAs-Ob) at 0.15 g/g SDS were much higher than those at 0 and 0.02 g/g SDS. However, at 0.15 g/g SDS, the residual NO2−-N was 85.14 mg/L, which was much higher compared to 0.02 g/g SDS (0.11 mg/L). The denitritation rate (1.30 mg N/(L · h) at high SDS concentrations was much lower. Moreover, acetic acid, the readily utilized carbon source for denitritation 36, 37, accounted for 76.7% of VFAs-Ob, which indicated that denitritation, rather than fermentation, was inhibited seriously at high SDS dosages (0.15 g/g). This study showed that fermentation and denitritation were enhanced simultaneously at 0.02 g/g SDS. Taking into consideration that the average surfactant (e.g., SDS) concentration in municipal wastewater varies from 10 to 20 mg/L, whereas in some industrial wastewater it may reach 300 mg/L, even after the coagulation process 38, the technology of improving integrated WAS fermentation–denitritation by SDS stimulation will be feasible and cost-effective.
| Fermentation | |||
|---|---|---|---|
| SDS (g/g DS) | Protein (mg/L) | Carbohydrate (mg/L) | VFAs-Oba) (mg COD/L) |
| 0 | 6.61 | 17.92 | 19.91 |
| 0.02 | 31.04 | 30.25 | 21.56 |
| 0.15 | 895.43 | 254.03 | 95.06 |
| – | |||
| Denitritation | |||
| HAc/VFAob (%) | NO2−-N (mg/L) | Denitritation rate (mg N/(L · h)) | |
| 0 | 58.92 | 48.42 | 4.24 |
| 0.02 | 59.83 | 0.11 | 25.89 |
| 0.15 | 76.76 | 85.14 | 1.30 |
- DS, dry sludge; HAc, acetic acid.
- a) Concentrations of VFAs observed in three reactors.
4 Concluding remarks
A novel-integrated WAS fermentation–denitritation process (i.e., WASFD) was examined with SDS addition to enhance VFAs production and denitritation. The results showed that T-VFAs, including VFAs for in situ denitritation and VFAs observed, were substantially enhanced at 0.02–0.1 g/g SDS. Ammonia and phosphorus were released to the solution, but were lower at 0.02 g/g SDS. Moreover, the inhibition of denitritation activity was not observed at low SDS concentrations (<0.1 g/g), but became serious at high SDS concentrations (>0.15 g/g). Based on an overall consideration, the suitable SDS dosage for simultaneous WAS fermentation and denitritation was 0.02 g/g. This study demonstrated the feasibility of addition of SDS to enhance denitritation along with WAS fermentation simultaneously, where wastewater and sludge treatment was achieved at the same time.
Acknowledgment
This work was supported by Natural Science Foundation of China (grant number 51178007); the project of scientific research base and scientific innovation platform of Beijing municipal education commission.
The authors have declared no conflicts of interest.


