Highly Luminescent Positively Charged Quantum Dots Interacting with Proteins and Cells†
Dedicated to Professor Erkang Wang on the Occasion of His 90th Birthday.
Comprehensive Summary
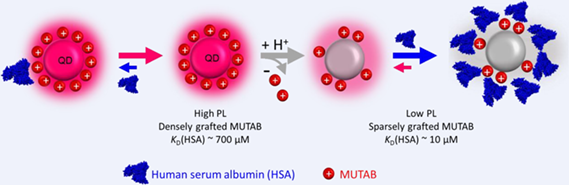
We have studied interactions between positively charged MUTAB-stabilized quantum dots (QDs) and model proteins, serum and live cells using fluorescence correlation spectroscopy (FCS), dynamic light scattering (DLS), time-resolved photoluminescence (PL) and live-cell fluorescence imaging. Using human serum albumin (HSA) as a model protein, we measured the growth of a protein adsorption layer (“protein corona”) via time-resolved FCS. Corona formation was characterized by an apparent equilibrium dissociation coefficient, KD ≈ 10 μM. HSA adlayer growth was surprisingly slow (timescale ca. 30 min), in stark contrast to many similar measurements with HSA and other proteins and different NPs. Time-resolved PL data revealed a characteristic quenching behavior depending on the QD surface coverage with HSA. Taken together, we found that MUTAB-QDs initially bind HSA molecules weakly (KD ≈ 700 μM); however, the affinity is enhanced over time, presumably due to proton injection into the MUTAB layer by HSA triggering ligand dissociation. This process was also observed with human blood serum, showing equal kinetics for comparable HSA concentration. Moreover, imaging experiments with cultured human cells (HeLa) revealed that MUTAB-QDs bind to the cell membrane and perforate it. This process is reduced upon pre-adsorption of proteins on the MUTAB-QD surfaces.
Background and Originality Content
Quantum dots (QDs) are crystalline nanoparticles (NPs) with attractive properties as luminescence labels for bioimaging, thanks to their photostability, broad absorption and tunable, intense and narrow emission.[1, 2] Among these, CdSe/ZnS core/shell semiconductor QDs are widely in use, especially in nano-bio applications, and commercially available.[3-8] CdSe/ZnS QDs are typically synthesized using an organometallic approach, in which they are colloidally stabilized by hydrophobic surfactants. For bioimaging and biosensing applications, this capping layer must be exchanged with a hydrophilic layer that confers colloidal stability in aqueous solvent.[9] To this end, long-chain, monovalent or multivalent thiol reagents, carrying a charged moiety at the ω-position for electrostatic stabilization of the QD in aqueous solvent, are frequently employed. Many studies have been performed to understand the intriguing charge trapping effects of the capping layer, which can greatly affect the photoluminescence (PL) properties.[9-11] In biological applications, hydrophilic QDs are often exposed to biofluids of an organism, e.g., by injection, ingestion or dermal exposure.[12, 13] Biomolecules (especially proteins) in those fluids interact with the capping layer, forming a biomolecular adsorption layer, the so-called “protein corona”.[14-17] Importantly, it is not the QD or capping layer surface but the adsorption layer that interacts with the biological environment and thus elicits bioresponses, e.g., by activation of the immune system.[15, 18-21] Up to now, a wide variety of biophysical techniques have been employed to elucidate mechanistic aspects of NP–protein interactions.[13, 22, 23] Our group has pioneered the use of fluorescence correlation spectroscopy (FCS) as a sensitive technique for examining NP-protein interactions within biological fluids, which allows us to measure the increase in the hydrodynamic radius of NPs upon protein adsorption in situ with subnanometer precision.[24-26] Particularly, dual-focus FCS enables the measurement of NP-protein interactions in a rather robust and simple way due to its internal length standard.[27]
It is conceivable that the protein corona may not just be an additional passive shell around the NP but may interact with and destabilize and remodel the capping layer. So far, this kind of interaction has received little attention. Here we address this issue using (11-mercaptoundecyl)-N,N,N-trimethylammonium bromide (MUTAB)-capped QDs, which we produced via a one-step ligand exchange route. The resulting QDs are stabilized by the positively charged quaternary amine of the MUTAB ligand, regardless of pH; they are strongly luminescent at pH > 7 and colloidally stable at pH > 5. We performed time-resolved studies of protein adsorption onto these QDs by dual-focus FCS[26-28] and monitored the response of the PL to the adsorption of human serum albumin (HSA), the most abundant protein in human blood serum, as a model protein. We also studied transferrin (Tf) and human blood serum for comparison. Our quantitative analysis indicates that HSA, unlike other serum proteins, induces slow (timescale 30 min) dissociation of MUTAB ligands from the surface, presumably by proton transfer to the QD surface. Removal of the solvating ligands leads to strong (equilibrium coefficient KD ≈ 10 μM) HSA binding. In addition, we investigated the effect of MUTAB-QDs on the viability of human cervical carcinoma (HeLa) cells and observed perforation of cell membranes upon exposure to MUTAB-QD surfaces. The effect was reduced for QDs carrying a pre-adsorbed HSA corona.
Results and Discussion
Preparation and characterization of MUTAB-QDs
We prepared water-soluble MUTAB-QDs by replacing the organic shell of commercial, lipophilic CdSe/ZnS QDs with (11-mercaptoundecyl)-N,N,N-trimethylammonium bromide (MUTAB) in a one-step solvent phase transfer (Figure 1a), during which the MUTAB ligands attach to the QDs surface via covalent Zn-thiolate bonds. Thus, the hydrodynamic radius, RH = 5.5 ± 0.2 nm, determined by dynamic light scattering (DLS) in phosphate buffered saline (PBS), pH 7.4, was significantly greater than the CdSe/ZnS core radius, Rc = 2.8 ± 0.4 nm, measured by transmission electron microscopy (TEM) (Figures 1b, c). A similar size increase was reported for MUTAB adsorption onto gold NPs.[29] The absorption band was centered on 565 nm, and the luminescence peak was at ~600 nm in PBS (Figure 1d). Using Rhodamine 6G as a reference, the PL quantum efficiency was determined as 25 ± 2%. The high ζ-potential of +36 ± 2 mV due to the quaternary amine groups of MUTAB ensures that these QDs are electrostatically well stabilized in water; no aggregation was observed after storage for several months. Even in solvents with high ionic strength such as PBS, these QDs were stable over many hours, as indicated by the constancy of the hydrodynamic radius (Figure 1e).

Protonation-induced quenching of MUTAB-QDs
Thiolates are common ligands for coating QD surfaces to render them soluble and colloidally stable in hydrophobic or hydrophilic solvents.[30, 31] As thiolate is the conjugate base of the weak thiol acid, it can easily be protonated, which destabilizes the covalent bond.[32] This in turn promotes ligand desorption and generates QD surface defects. Trapping of charge carriers at defect sites is a well-known mechanism of QD luminescence quenching. Depending on pH, MUTAB carries a thiol or thiolate on one end; the quaternary amine group on the other end carries a positive charge regardless of pH. To analyze the effect of thiolate protonation, we investigated the PL and colloidal stability (via size determination) of MUTAB-QDs as a function of pH.
Images of vials containing MUTAB-QDs in 40 mM potassium phosphate/citrate buffer adjusted to pH 3—8, taken under 365-nm illumination, show that the emission intensity of MUTAB-QDs is high under basic conditions but sharply drops near pH 7 and is practically zero below (Figure 2a, inset). For quantification, we measured the pH dependence of the emission spectra after incubating the QD samples in buffer for 30 min (Figure 2b). Importantly, the brightness loss observed at lower pH cannot be recovered by raising the pH again (Figure 2b, dotted spectrum), indicating that low pH modifies the QDs irreversibly. The pH dependence of the (normalized) intensity, I(pH), shown in Figure 2a, was fitted with a Hill equation, I(pH) = (1–I0)[1 + 10n(pKa–pH)]–1 + I0, with (1–I0) and I0 representing the overall intensity step and the pH-independent background, respectively. The fit yielded pKa = 7.2 ± 0.1 as the midpoint of the sigmoid curve. The Hill coefficient, n = 3.7 ± 0.1, which controls the steepness of the transition, is much greater than one, implying that a highly cooperative protonation reaction is responsible for the loss of luminescence. Data taken after 3 h show only a minimal reduction of the intensity (red symbols in Figure 2a). Thus, the MUTAB-QDs are stably luminescent for several hours at pH ≥7.

To examine if pH affects the colloidal stability of MUTAB-QDs, we measured the hydrodynamic radius, RH, of the diffusing entities by DLS. RH stayed constant at 5.5 nm between pH 6 and 8, i.e., in the pH range where the luminescence quenching step was observed. Thus, aggregation does not play a role in this process. Below pH 5, however, RH started to increase enormously and reached values >400 nm at pH 3—4 (Figure 2c), revealing formation of huge QD aggregates. The pH dependence of RH can be fitted with a Hill equation as well, RH(pH) = ΔRH[1 + 10n(pH–pKa)]–1 + RH,0, with ΔRH = 451 ± 1 nm and RH,0 = 5.5 ± 0.1 nm representing the overall size increase due to aggregation and the bare MUTAB-QD size, respectively. The fit yielded a transition midpoint of the sigmoid curve, pKa = 4.2 ± 0.1, and a cooperativity parameter, n = 2.9 ± 0.1. As the quaternary amine of MUTAB does not protonate, it ensures colloidal stability as long as there is a ligand shell around the QDs. Thus, we conclude that low pH causes depletion of the MUTAB layer and renders the QDs colloidally unstable.
Interactions of MUTAB-QDs with serum proteins
Protein adsorption and luminescence quenching. For many years, we have carried out elaborate in-vitro studies of the adsorption of model proteins and blood serum onto luminescent NPs using FCS, which allows us to monitor protein adsorption precisely via changes of the hydrodynamic radius, RH.[24, 33-40] In these experiments, the thickness of the adsorption layer was always found to vary with the protein concentration in a sigmoidal fashion, as expected from the Hill equation, and the adsorption process was complete within the time required for the measurement (ca. 3 min from sample mixing and loading till the end of data acquisition). By contrast, HSA adsorption onto MUTAB-QDs showed a surprisingly slow RH increase in the range 1.56 μM ≤ [HSA] ≤ 50 μM (Figure 3a). Within the experimental error, the temporal evolution did not depend on [HSA], only the overall adlayer thickness, ΔRH, grew with increasing [HSA]. Thus, we fitted the entire data set with exponential curves, taking the lifetime parameter of HSA adsorption, τads, as a shared (global) fit variable, to obtain τads = 1,460 ± 140 s (Figure 3a). The RH change with concentration due to the HSA adsorption layer can be described with a relation based on a Langmuir-Hill binding equilibrium (Figure 3b), which has been widely applied to FCS and DLS data on protein corona formation.[24, 41, 42] The fit yielded an overall radius increase of 3.7 ± 0.3 nm, an apparent equilibrium dissociation coefficient, KD1 = 9.8 ± 1.7 μM, and a cooperativity parameter, n = 1.2 ± 0.2.

In the FCS experiments, we observed a pronounced decrease of the MUTAB-QD PL at greater [HSA], limiting the FCS measurements to below 50 μM. By using optical fluorescence spectroscopy with 470-nm excitation, we measured the temporal decay of the emission as a function of [HSA] (Figure 3c). With increasing [HSA], the quenching process accelerated and the residual fluorescence at long times decreased (Figure 2c). Notably, up to ~50 μM HSA, quenching did not proceed to completion. The decay curves are well described by single exponentials plus offset. The saturation levels follow a Langmuir-Hill isotherm, shown in Figure 3d as a red line, using the same parameters as those obtained from fitting the RH change with concentration in Figure 3b. This implies that the extent of PL quenching depends on the degree of surface saturation with HSA. For [HSA] < 50 μM, the pH changes by less than 0.05 upon adding HSA to the solution (Figure S1), and thus does not affect the observed quenching behavior.
Close inspection of the data in Figure 3d indicates that the long-time residual PL (offsets) above 50 μM deviate from the Hill isotherm, which could hint at a different quenching behavior at higher [HSA]. Thus, we further measured the temporal decay of the MUTAB-QD luminescence up to 1,400 μM HSA (Figure 3e). Above 200 μM, we found essentially complete quenching on timescales shorter than τads, the timescale of formation of a strongly bound HSA adlayer with KD1 ≈ 10 μM. Thus, in this concentration regime, quenching precedes the HSA association process seen in the FCS data (Figure 3a). We were able to fit the kinetic data with single exponential decay functions; the obtained rate coefficients are plotted in Figure 3e (inset). Their dependence on [HSA] can be modeled by the expression k([HSA]) = kq[1/(1 + (KD2/[HSA])n)], which assumes that the observed kinetics are governed by an intrinsic, [HSA]-independent quenching rate coefficient times the degree of saturation of the MUTAB-QDs with HSA, as described by a Langmuir-Hill equation. Figure 3e (inset) shows that a fit of the data with this expression works very well, yielding a lifetime, τq = kq–1 = 150 ± 25 s, an apparent equilibrium dissociation coefficient, KD2 = 700 ± 250 μM, and a cooperativity parameter, n = 1.0 ± 0.1. In Figure 3f, the degree of saturation with HSA is plotted against [HSA] together with the corresponding binding isotherm. Thus, at high [HSA], the quenching process reveals a 70-fold decreased HSA affinity. Although HSA binding is weak, it is still effective for PL quenching. We note that, at the highest [HSA] values, slight changes of the solution pH (Figure S1) may also affect quenching.
Dynamics of the protein corona following concentration jumps. As we have shown, HSA adsorption on MUTAB-QDs is a slow process for [HSA] ≤ 50 μM, with a lifetime of about 30 min (Figure 3a). The concentration dependence of the adsorbed HSA follows a Langmuir-Hill isotherm (Figure 3b), which is theoretically based on an underlying dynamic binding equilibrium. However, in earlier studies, we found that protein binding can nevertheless be irreversible, and the saturation curve reflects an equilibrium behavior before the corona turns irreversible due to structural dynamics at the NP-protein binding interface.[38, 39, 42] To address these issues for MUTAB-QDs, we performed concentration jump experiments, in which [HSA] was quickly changed by a factor of four, and the ensuing response of RH and the luminescence intensity were recorded.
Using FCS, we monitored the size increase due to HSA adsorption at 3.125 μM HSA over 4 h (Figure 4a). Subsequently, we quickly raised [HSA] to 12.5 μM and continued with the measurement. Comparison with the curve measured with 12.5 μM HSA from the beginning shows the same final corona thickness. This implies that the protein layer formed at 3.125 μM HSA does not passivate the QD surface, so that it can be loaded with additional protein molecules at higher [HSA]. Note the slow growth response in all steps. In another experiment, we first formed a protein corona at 6.25 μM HSA and then jumped [HSA] down to 1.56 μM. Surprisingly, RH dropped to 5.5 ± 0.2 nm, which is less than the value measured for a protein corona formed at 1.56 μM and close to RH of bare MUTAB-QDs (Figure 4b). This experiment strongly suggests that HSA adsorption in this concentration range led to removal of the MUTAB layer from the QDs, so that HSA desorption leads to a smaller size than expected.

Next, we performed the corresponding concentration jump experiments with monitoring of the PL intensity. We note that this procedure entails mixing of the MUTAB-QD solution at a certain [HSA] with another solution of different [HSA]. Therefore, the intensity must be rescaled to account for the dilution. For jumping the concentration up by a factor of four, the final extent of quenching was essentially identical, regardless of adsorption in one or two steps (Figure 4c). This observation suggests that the additional HSA binding inferred from the RH increase gives rise to additional quenching, and that the final state depends on the HSA occupancy but not on the details of the HSA adlayer formation process, i.e., in one or two steps. For a four-fold reduction of the HSA concentration from 12.5 μM to 3.125 μM by PBS addition, the emission intensity of the MUTAB-QDs dropped immediately upon reducing [HSA] by ~25% and then stayed constant for several hours (Figure 4d). The fact that it did not at all recover to the values corresponding to the lower [HSA] in the mixture further supports our conclusion from the FCS experiment (Figure 4b) that the MUTAB-coating of the QD surface is irreversibly damaged upon tight (KD1 ≈ 10 μM) HSA binding. There is even more quenching after HSA dilution than expected from the experiment at constant [HSA], suggesting a protective effect of HSA adsorption on the surface, which counteracts PL quenching.
Mechanistic interpretation of protein-MUTAB-QD interactions
The MUTAB layer around our QDs is primarily stabilized by Zn-thiolate covalent bonds and, additionally, by van-der-Waals interactions between the undecyl chains. The dense grafting of the ligands on the surface implies that the quaternary amine groups have a destabilizing effect due to charge repulsion. Unlike many other capping layers featuring carboxyl, amine, PEG or sugar moieties,[43-45] quaternary amines expose hydrophobic methyl groups at the surface that cannot form hydrogen bonds at the interface. Thus, proteins can only bind to the QD via (weak) van-der-Waals and charge interactions, with charge stabilization relying on a net attractive interaction at the binding interface. Note that protein charges that are more distant from the binding interface are not relevant, as the high ionic strength of the protein solvent (PBS) ensures effective charge screening (Debye length < 1 nm).[27, 35, 46] Taken together, it is not surprising that HSA binds only weakly to pristine MUTAB-QDs (KD2 = 700 μM, Figure 3f), despite its net negative charge near neutral pH (isoelectric point, pI = 4.7).
We have inferred weak HSA binding from the quenching kinetics of the QD PL at high [HSA], which depends on the occupancy of the QDs with HSA. Such quenching has also been observed upon adsorption of polyacrylic acid (PAA) polymer rather than proteins (Figure S2a).[10] HSA is known to provide an acidic environment[47] and, therefore, we propose that the PL quenching effect originates mainly from a high local density of carboxylic acid sidechains on HSA; minor changes of the solution pH at high [HSA] may further amplify the effect (Figure S1). This hypothesis is supported by quenching studies with charge-modified proteins (Figures S2b—d). We have rendered carboxyl groups on HSA to amines by reacting them with ethylenediamine in the presence of the catalyst 1-ethyl-3-(3-dimethylamino-propyl)-carbodiimide (EDC). As expected, the quenching effect of aminated HSA (HSAam) was less than that of HSA (Figure S2b). By reacting the positively charged ε-amino groups of lysine sidechains of Tf with succinic anhydride,[48] we turn them into negatively charged carboxyl moieties, so that their surface density is markedly increased. Indeed, unlike native Tf, succinylated Tf (Tfsuc) shows a pronounced quenching effect (Figure S2c). Thus, taken together, these experiments support the notion that luminescence quenching depends on the density of carboxylic acid groups on the protein. This raises the question if there are proteins other than HSA that show such a behavior. To address this question, we compared the quenching effect of HSA and human blood serum, which contains ca. 3700 different polypeptides including HSA as the most abundant protein,[49] with a concentration of ~500 μM. Figure S2d shows that the decay kinetics look very similar for HSA solutions and serum diluted such that it has the same [HSA]. Consequently, other serum proteins appear to have only a minor if any quenching effect in comparison with the HSA component. Of course, the concentrations among proteins in serum differ greatly, and we cannot exclude that similar effects arise with proteins that remain unnoticed due to their low abundance.
The initial effect of HSA upon adsorption onto MUTAB-QDs likely involves proton injection into the MUTAB layer by HSA, converting thiolate groups to less stably bound thiols.[32] In this process, characterized by a low HSA affinity (KD2 ≈ 700 μM), surface defects are created that give rise to the observed quenching (Figure 3e). A tightly bound HSA corona develops only slowly (within roughly 30 min), however, as measured by the size increase due to HSA adsorption (Figure 3a), characterized by a greatly enhanced affinity (KD1 ≈ 10 μM) for HSA binding and the accompanying quenching effect (Figures 3b, d). Thus, we suggest that, after proton injection into the MUTAB layer by HSA, less stably bound thiols slowly detach from the surface. This process prepares the ground for HSA binding with high affinity. The modified, less densely grafted MUTAB layer may still provide attractive interactions to carboxylate sidechains and reduce repulsion by positively charged amine groups. Possibly, the presence of bare QD surface patches can also enhance the HSA binding affinity. Experimental support for MUTAB removal from the capping layer comes from the concentration jump experiments (Figure 4). We note that, at [HSA] < 50 μM, quenching appears to saturate according to the HSA occupancy, suggesting that HSA binding protects against further quenching. Presumably, bound HSA prevents or at least hinders free HSA from further proton transfer. However, we cannot exclude that further quenching proceeds slowly at [HSA] < 50 μM but remains unnoticed on our timescale of several hours.
MUTAB-QDs interactions with live HeLa cells
The surface charge of nanomaterials is one of the key factors controlling their interaction with cells.[50] Cell membranes are negatively charged and thus interact strongly with positively charged NPs.[51] Accordingly, high cellular uptake efficiency is seen for positively charged NPs.[52] Such cationic NPs often elicit cytotoxicity due to physical damage to the plasma membrane, e.g., by perforation, or they may interact with membrane proteins such as Ca2+ channels, causing an increase of intracellular Ca2+ levels.[53] Therefore, we assessed the biocompatibility of MUTAB-QDs and their internalization by live HeLa cells, a popular cervical cancer cell line that is frequently used in this context.
A MTT assay showed no obvious adverse effects of MUTAB- QDs on the metabolic activity of HeLa cells for concentrations up to 10 nM (Figure S3). Beyond that level, however, the overall cell viability started to drop markedly. To visualize possible effects of the MUTAB-QDs on the integrity of the cell membrane, we loaded HeLa cells with the cell membrane-permeant calcium indicator Fluo-4 AM before adding the QD solutions. The emission intensity of this dye is a measure of the cytosolic Ca2+ concentration, which is low under normal conditions (typically ca. 100 nM[54]). When the MUTAB-QDs were suspended in PBS with 0.9 mM Ca2+ (PBS/Ca2+), the Fluo-4 emission from the HeLa cells was observed to increase in a stepwise fashion after several minutes, indicative of heavy Ca2+ influx into the cytosol as a result of severe membrane damage (Figures 5a—c). Movie S1 and Figure S4 show both the green Fluo-4 and the red QD emission as a function of time. Frequently, we observed a subsequent intensity (and thus Ca2+ concentration) decrease, as cells responded with membrane repair and the action of Ca2+ pumps until the next major Ca2+ influx event occurred (Figure 5b). After 20 min, however, all cells were brightly fluorescent and therefore dead. Smaller and slower increases of the fluorescence were observed for MUTAB-QDs suspended in PBS without Ca2+, presumably due to the release of Ca2+ ions from internal stores of the cell in response to MUTAB- QD-induced damaging of the plasma membrane (Figure 5a—c). Notably, it is well known that elevated intracellular Ca2+ levels are the key trigger for processes involved in plasma membrane repair.[55, 56] With plain PBS solvent, bright cellular fluorescence indicating cell damage was not observed (Figures 5a—c). We also tested dihydrolipoic acid-functionalized QDs (DHLA-QDs,[57] 20 nM in PBS/Ca2+), which bind to QD surfaces in a bidentate fashion and expose negatively charged carboxylate moieties on the surface, but we found only a decrease of the background intensity due to photobleaching but no indication of cell damage (Figures 5a—c).

Next, we assessed the capacity of MUTAB-QDs to damage cell membranes in a setting that is closer to the physiological situation, for instance, injection of an NP-based diagnostic or therapeutic agent into the blood stream.[18] Thus, we pre-incubated MUTAB- QDs with solutions of varying [HSA] for 10 min before adding the mixture to the HeLa cells. In the light of our in-vitro experiments, a significant fraction of HSA will coat the QD surfaces, and the reduced density of positive charges on the MUTAB-QD surface should eventually relieve cytotoxic effects.[51] Figure 5d shows confocal images from an experiment over 40 min, in which HeLa cells were exposed to MUTAB-QDs incubated with 50 μM [HSA]. Unlike in Figure 5a, there were no bright and thus damaged cells after 10 or 30 min. At longer times, however, the fraction of bright cells increased. We analyzed the fraction of cells that displayed a sudden fluorescence intensity increase due to membrane damage within the first 30 min upon pre-incubation with [HSA] = 10, 50 and 100 μM (Figure 5e, Figure S5). These data clearly prove that HSA coating has a pronounced protective effect on the cells, and further confirm that surface-exposed, positively charged trimethylamine moieties of the MUTAB ligands are responsible for plasma membrane damage.
Conclusions
We have synthesized and characterized positively charged QDs using MUTAB as the capping ligand. The QDs were brightly luminescent and colloidally stable above neutral (and thus at physiological) pH. To assess their properties as luminescent labels in biological applications, we performed detailed kinetic studies of protein corona formation. We found that HSA has a strong quenching effect on the PL of MUTAB-QDs. Experiments with blood serum indicated that HSA is mainly responsible for the effect, while the thousands of other proteins in serum play only a minor role if any. Our study revealed an initially weak tendency of MUTAB-QDs to bind HSA, which nevertheless leads to destabilization of the capping layer. On the timescale of ca. 30 min, the affinity for HSA is enhanced by more than 70-fold, and we have given evidence that this change is induced by the loss of thiol ligands from the capping layer. This will likely occur with thiol ligands in general, albeit to different extents and at different rates, governed by structural details of the capping ligand (other functional groups, length of alkyl chain, etc.). The pronounced PL quenching featured by MUTAB-QDs exposed to HSA provided a unique setting to observe this process in a time-resolved fashion but also shows the limited applicability of MUTAB-QDs for nano- bio applications. Moreover, the positively charged QDs have the tendency to perforate cell membranes in contact with the capping layer. Pre-adsorption of a protein corona greatly relieves the effect.
Experimental
One-pot synthesis of positively charged MUTAB-QDs. MUTAB-QDs were prepared from commercial, non-water soluble CdSe/ZnS QDs (Qdot 585, Life Technologies, Carlsbad, CA) via the solvent phase-transfer method.[58] 200 μL of the CdSe/ZnS QD stock solution was mixed with 500 μL toluene. After adding 500 μL Milli-Q water and 40 μL MUTAB (50 mg/mL, in ethanol), the two phase-mixture was shaken vigorously for 3 min to transfer the QDs to the aqueous phase. Then, the aqueous phase containing the QDs and the organic phase were separated by centrifugation (5,000 g, 5 min). After retrieving the aqueous phase from below the organic phase, it was repeatedly washed with toluene to remove any organic molecules. Finally, the aqueous MUTAB-QD solution was centrifuged twice for 15 min (12,000 g, 20°C) to remove any aggregates and stored at 4°C until further use.
QD characterization. The average core radius of the CdSe/ZnS QDs was determined by using high-resolution transmission electron microscopy (TEM). The hydrodynamic radius, RH, of the MUTAB-QDs suspended in Dulbecco's PBS, pH 7.4 (Thermo Fisher Scientific, Waltham, MA) was determined by dynamic light scattering (DLS) using a Zetasizer Nano-ZS (Malvern Instruments, Malvern, UK) equipped with a 633 nm He-Ne laser at 25°C in PBS (Thermo Fisher, Waltham, MA). The MUTAB-QDs were also dissolved in ten-fold diluted PBS to measure the ζ-potential by laser Doppler anemometry (LDA) using a Zetasizer Nano-ZS (Malvern Instruments). UV-Vis absorption spectra were recorded on a Cary 100 spectrophotometer (Varian, Palo Alto, CA). Emission spectra with the excitation set at 470 nm were collected on a Fluorolog-3 spectrofluorometer (HORIBA Jobin Yvon, Edison, NJ). The PL quantum yield was determined by using Rhodamine 6G as a reference (PL quantum yield in water 90%).[59]
To evaluate the colloidal stability of the MUTAB-QDs as a function of pH, MUTAB-QDs (7.6 nM) were dispersed in 40 mM potassium phosphate (pH 3—8, low pH values obtained by adding HCl) containing 300 mM NaCl and incubated for 30 min. Then, RH of the QDs was determined by DLS. In addition, emission spectra were recorded (excitation at 470 nm). These measurements were repeated after 3-h incubation. We also took pictures of the samples upon illumination with a UV lamp (365 nm).
Protein solutions. Stock solutions of HSA and Tf were prepared in PBS, and purified using micro Bio-Spin chromatography columns (Bio-Rad, Hercules, USA). Different concentrations of HSA (1.56—2,800 μM) and Tf (50 μM) were prepared by diluting the stock solutions with PBS. Serum was diluted with PBS to adjust its HSA concentration. Succinylation of Tf was carried out basically as described by Aitken and Learmonth.[60] 200 μL 0.8 M succinic anhydride solution in 1,4-dioxane was added dropwise to 4 mL 160 μM apo-Tf dissolved in PBS. The mixture was stirred at room temperature for 2 h. The protein was purified by using a PD Midi Trap G-25 column (GE Healthcare, Freiburg, Germany) with PBS as the elution buffer. The modified Tf was concentrated by centrifugation, and the concentration was determined by UV-Vis absorption measurements at 280 nm. Aminated HSA (HSAam) was prepared as described previously.[35, 61]
Optical spectroscopy. The MUTAB-QD stock solution was diluted to 44 nM (in PBS). Equal volumes of MUTAB-QD and protein solutions were mixed in a plastic cuvette immediately before starting to monitor the MUTAB-QDs emission as a function of time using a Fluorolog-3 spectrofluorometer (HORIBA Jobin Yvon). To reduce photobleaching, the anti-photobleaching mode of the Fluorolog-3 was used, i.e., the sample was kept in the dark between individual measurements along the kinetics trace (excitation at 470 nm for 0.1 s every 60 s, detection at 600 nm). As controls, the same measurements were performed on bare MUTAB- QDs and on plain protein solutions (to determine the background). This protocol was also used to monitor the effects of polyacrylic acid (PAA) on the emission intensity of the MUTAB-QDs.
Dual-focus FCS. Dual-focus FCS measurements were performed on a confocal microscope as described previously.[33] We used low laser power (0.4 μW) to avoid QD blinking and home- built glass channels coated with PEG (5 kDa) as sample holders to avoid adsorption of the protein-coated MUTAB-QDs to the surfaces. Equal volumes of MUTAB-QD (44 nM) and protein solutions were mixed in protein low-bind tubes and then filled into the channel for the FCS measurement. For long-term incubation (up to 4 h), samples were kept in low-bind tubes.
Samples were illuminated continuously for 4 min. Intensity autocorrelation functions were calculated from the emission time traces. From fitting the correlation functions, the diffusion coefficient, D, was extracted and converted into a hydrodynamic radius, RH. We have earlier presented a simple model that attributes the increase of RH to the binding of a certain number, N, of proteins with molecular volume, VP, to the QD of volume V0.[24] As the data typically resemble a binding isotherm, we have modeled the dependence of N on the protein concentration by using the Hill equation, N = Nmax/(1 + (K/[P])n), where Nmax is the number of proteins bound in saturation, [P] is the protein concentration, and K is the midpoint concentration, or apparent dissociation coefficient. The Hill coefficient n controls the steepness of the binding curve.
To test the reversibility of HSA adsorption onto the MUTAB- QDs, HSA and MUTAB-QDs were mixed and incubated for 4 h to ensure adsorption equilibrium. Then, the HSA concentration was either decreased four-fold by adding PBS or increased four-fold by adding a few microliters of a concentrated HSA solution before FCS measurements were carried out at different time points to monitor RH.
Live cell confocal imaging. HeLa cells were cultured in Dulbecco's modified Eagle's medium (DMEM, Invitrogen, Carlsbad, California) with 10% fetal bovine serum and antibiotics (100 U penicillin, 100 μg/mL streptomycin) in eight-well LabTek incubation chambers (Nunc, Langenselbold, Germany) overnight at 37°C and 5% CO2. Then, they were washed twice with PBS and incubated for 15 min with 0.9 μM cell-permeable calcium indicator (Fluo-4 AM, Life technologies, Eugene, USA) in calcium-free PBS at room temperature. After washing the cells with calcium-free PBS, images were recorded in two color channels every 10 s for 60 min by using an Andor Revolution XD spinning disk confocal laser scanning microscope (BFi OPTiLAS, München, Germany). MUTAB- QDs or DHLA-QDs (and also PBS as control) were added between the first two frames. QDs and Fluo-4 were excited at 488 nm. The QD emission was collected using a 585/50 (center/width) nm bandpass filter. For collecting the emission of Fluo-4, a 525/50 nm filter was used. To quantitatively analyze the emission intensity of the calcium indicator at different incubation times, all images were analyzed by using the software ImageJ.[62] Emission intensities were normalized to the initial intensity of Fluo-4 and plotted as a function of time.
MTT assay. HeLa cells were seeded in a 24-well plate (1 × 10⁵ per well) and cultured overnight at 37°C and 5% CO2. Then, the cell culture medium was replaced by DMEM containing MUTAB- QDs at concentrations in the range 0—80 nM. After 10 min, the cells were washed thoroughly with PBS and incubated in cell medium for 24 h, followed by the addition of 200 μL fresh medium plus 10 μL thiazolyl blue tetrazolium bromide (MTT, Sigma-Aldrich) solution (12 mM in PBS) to each well. After 4 h, 150 μL solution was removed from each well and mixed with 250 μL DMSO before measuring the absorbance of the solution at 550 nm.
Acknowledgement
This work is dedicated to Professor Erkang Wang on the occasion of his 90th birthday. Since G.U.N. and K.N. first visited his institute in Changchun in 2004 (arranged by Prof. Jin Wang), we have had close interactions with Prof. Wang and Prof. Dong and their coworkers, and our nanoparticle research has greatly benefitted from this exchange. G.U.N. was funded by the Helmholtz Association, program Materials Systems Engineering (MSE).