Simulation of Compression Heat Pump Cycles Using NH3/H2O Mixtures to Estimate Their Working Domains
Abstract
A computer-aided process design methodology is used to determine the limits of NH3/H2O mixtures in different heat pump cycles from 20 °C to 150 °C. The evaluation is based on a defined parameter set consisting of the coefficient of performance, total heat transfer area and volumetric heat capacity. Simple cycles with two heat flows were chosen to meet good process integration capabilities. The results are shown in a sink outlet/temperature lift matrix considering current technical limits. R1366mzz(Z) in a standard compression cycle with internal heat exchanger serves as a benchmark. To provide temperatures up to 150 °C the lift of the heat pump has to increase to about 80 K of which only the wet compressions cycle with NH3/H2O is capable of. The working domains of NH3/H2O and R1366mzz(Z) are similar, when a two-stage compression for NH3/H2O is applied.
1 Introduction
 (1)
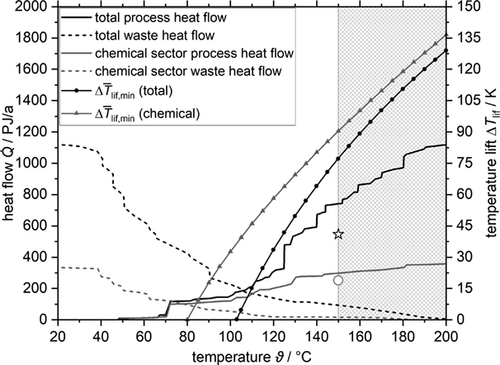
(1)The evaluation of this equation for the chemical and total case are calculated by supposing a typical Carnot efficiency of ζ = 45 % 4 for real heat pumps and the two curves are also part of Fig. 1. At 150 °C the minimal averaged temperature lift required by the heat pump is between 77 K and 90 K.  of the chemical sector is higher than that for all sectors. The greyed area at temperatures above 150 °C in Fig. 1 is out of the scope of this study, due to current technical and economic limitations 4, 5.
-
deficits in presenting the limits of the heat pump cycle and its process integration,
-
future-proof working fluids and
-
lack of high temperature compressors
are addressed here by discussing specific thermodynamic cycles related to the compression heat pumps with solution circuit (CHPSC). The standard CHPSC is the so called Osenbrück cycle 8 shown in Fig. 3a, which requires at least two fluids, i.e., a refrigerant and a solvent. The unique characteristics of this cycle are a significant higher temperature glide during the approximately isobaric phase change of the internal working fluid mixture as compared to typical temperature differences of the external fluids in heat source and sink and, secondly, the contribution of exergy by mechanical energy using a compressor and a liquid pump, so that these cycles are not mistaken as an absorption heat pump, where exergy donation is related to heat. In practical applications the high temperature glide of the mixture leads to an evaporation and condensation, which stops respectively starts within the two-phase region. Thus, a liquid-gas separator below the evaporator is required. Based on Fig. 3a the process will be explained in the following. The vapor phase rich in refrigerant coming from the phase separator is compressed by a compressor and the solvent with a low refrigerant fraction by a liquid pump. Both streams are re-mixed before the condenser yielding a mass flow rich in refrigerant. Heat is transferred from the two-phase rich solution to the heat sink within the condenser during a combined process of condensing and absorbing until the mixture is saturated liquid. Then the rich solution is subcooled by the poor solution in the internal heat exchanger and expanded to low pressure entering the evaporator where heat is transferred from the heat source to the mixture. The internal heat exchanger is usually provided to enhance cycle efficiency. Compared to evaporator and condenser it is small sized due to the liquid-liquid design. When modifying this standard cycle one more general point has to be addressed according to Arpagaus et al. 4. The capability of a simple process integration, which excludes large additional heat flows at further temperature levels at the system boundary, as in some CHPSC cycles introduced by Ahlby 9 and Ziegler 10.
There exist several studies of thermodynamic modified cycles and different working fluid pairs for CHPSC 11, but up to now the limits of these cycles were not systematically investigated with respect to different cycle configurations, boundary conditions and technical limitations of current equipment. One extreme is to adapt a working fluid to a given cycle and its conditions. The other extreme is to adapt a cycle to a given working fluid, but this requires additional degrees of freedom, which arise as working fluid mixtures with high temperature glides are used. This latter strategy will be pursued here to present characteristic diagrams for potential users or vendors showing sink outlet temperature, heat pump temperature lift and some economically relevant parameters as volumetric heat capacity (VHC), heat transfer area ratio (HTA) and coefficient of performance (COP). The sink outlet temperature is defined as the temperature of the external fluid leaving the condenser towards the heat sink.
Ahrens et al. 11 published the most recent review about CHPSC and claimed NH3/H2O to be the most suitable working fluid pair for the CHPSC. The reasons for their choice are the amount of experimental experience already gained and the fact that both working fluids are natural, not highly flammable and without global warming potential (GWP) or ozone depletion potential (ODP). Further these substances do not create trifluoroacetic acid as an atmospheric breakdown product like R245fa, R365mfc, R1243zf, R1234yf or R1336mzz(Z) 12. This low environmental impact of NH3/H2O makes the mixture independent of future F-Gas regulations and interesting for industrial heat pumps. Pure NH3 is already used in standard compression cycles up to 90 °C and the mixture NH3/H2O is used in the Osenbrück cycle with two-stage compression up to 120 °C 4. Within the above-described cycle with one stage compression this mixture achieves temperatures up to 111 °C, when constrained by a 28 bar pressure limit and a maximal compressor discharge temperature (CDT) of 170 °C 13.
 (2)
(2)both natural working fluids heat up at a rate of about 8 K bar−1 whereas for synthetic refrigerants, as R1336mzz(Z) or R245fa, this rate is about 3 K bar−1.
 (3)
(3) (4)
(4)to correctly compare cycle efficiency with different temperature glides and lifts. Two pressure levels, 28 bar and 50 bar, and a maximal CDT of 180 °C were considered in 16. The additional degrees of freedom were fixed by an economically optimization. After converting the results of Brunin et al. 14 and Jensen et al. 16 to the same temperature lift, Eq. 4, the working domains (WD) of the low-pressure cycles are combined in Fig. 2a and the high-pressure results of Jensen et al. 16 are shown in Fig. 2b. Their curves were extrapolated linearly, when cut off by their constraint Tsnk,in < Tsrc,in, since ΔTlif is still positive. Two limits are dominant in the data from Jensen et al. 16. Firstly, the violation of the self-imposed limit Tsrc,out > 0 °C, which is the part with positive slope, and secondly the maximal CDT in all other cases. The WD as calculated by Brunin et al. 14 are limited by the curve with positive slope standing for a low-pressure limit of 1 bar, the constant or slight positive slope is due a restriction in minimal COP of 4 and at 140 °C the high-pressure limit of 20 bar is limiting.
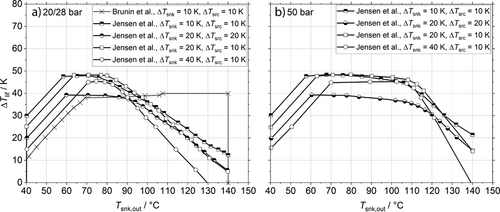
The highest temperature at sink outlet is 140 °C for all cases, but the maximal temperature lift for the standard cycle starts to decrease for temperatures higher than 90 °C for the low-pressure components and at 115 °C for the high-pressure components. In contrast the lift remains nearly constant for the oil cooled screw compressor up to 140 °C.
The current studies show that slight modifications of the CHPSC cycle, especially the path of gas compression, have a great impact on cycle's WD. The most significant constraint arises from the CDT. Constraints chosen by Brunin et al. 14 and Jensen et al. 16 are different and arbitrary, for example the COP limit, so that special care is needed if their results are compared. Due to the additional degrees of freedom by using wide-boiling mixtures, the working domain of the working fluid mixture may be adjusted by cycle modifications as will be presented in this study. Besides the technical limits, economic parameters had not been compared in a basic way so far, but these parameters are also important for decision making if a working fluid is suitable or not. R1336mzz(Z) serves as benchmark working fluid because the industry is more familiar with standard compression heat pump cycles with pure working fluids and this substance is a fluid under investigation which do not operate in vacuum, is not flammable, suitable for high temperatures up to 150 °C and is excluded from current F-Gas regulations 4.
This article initially deals in Sect. 2 with the selection of thermodynamic cycles. It follows a detailed description of the chosen technical constrains for all used devices. Sect. 4 is about the thermodynamic model and the developed algorithm and which software is used. Results about the working domains are found in Sect. 5 and the final Sect. 6 is the conclusion.
2 Selection of Thermodynamic Cycles
The WD of the standard Osenbrück cycles in Fig. 3a, here called STD25 and STD40 with the letters representing the upper high-pressure limit, and the standard Osenbrück cycle including an oil cooled compressor in Fig. 3b were investigated so far 14, 16. STD25 is part of this investigation due to different constraints versus Jensen et al. 16 and also for comparison purposes. STD40 with a 40 bar limit is added in contrast to the 50 bar limit of 16 because a standardized industrial pressure level is 40 bar. The WD of the cycle in Fig. 3b investigated by Brunin et al. 14 is only limited by the definition of the CDT and the maximal pressure difference and it has been shown that this cycle is theoretically suitable for sink temperatures up to 150 °C so that it is not part of this study since little additional information would be added. As the previous studies had shown the limit of using NH3/H2O is a result of the CDT limit. So, two additional cycles were selected in Fig. 3c and 3d, were the CDT is lowered by a wet compression (WETC) or by two two-stage compression cycles with intercooling but different constraints concerning the compressors. 2STPP deals with an equal pressure ratio of the compressors and 2STTT with an equal CDT. The cycle in Fig. 3c is the same for the benchmark fluid R1336mzz(Z), but with the difference that the refrigerant gets fully evaporated. All these cycles except STD40 deal with a high-pressure limit of 25 bar.
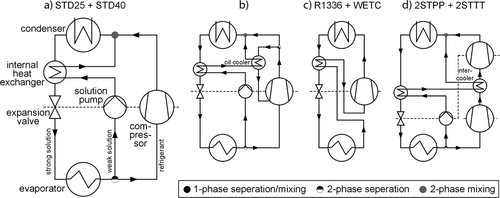
In WETC the working fluid mixture flows completely through the compressor. Strictly speaking it is not a CHPSC cycle due to the missing solution circuit, but a promising solution to lower CDT, as the liquid absorbs some of the emerging thermal energy during compression. This cycle was theoretically compared to wet compression of pure working fluids by Itard 17 and later experimental investigated by Zaytsev 18 and Infante Ferreira et al. 19. An internal heat exchanger is introduced here, which significantly increases the efficiency and also circumvents technical limitations of the compressor. The two-stage compression cycles with intercooling were theoretical and experimental investigated by Nordtvedt 20. By the use of two compressors each compressor has to overcome a lower pressure ratio and the intercooler lowers the inlet temperature of the second compressor.
3 Model Constraints
Most parameters are basically affected by costs, whereas some parameters as the maximal oil-temperature have a physical origin due to chemical decomposition or inadequate viscosity. The temperature range of heat source and sink are orientated at the inquiry of the cumulative waste heat and process heat by Marina et al. 5, cf. Fig. 1. The investigated temperature range is therefore 20 °C to 150 °C.
The temperature glides at source and sink were calculated at 5 K, 10 K, 20 K and 40 K but are hold constant at source and sink to reduce the parameter space. This assumption lowers the total WD for higher temperature glides, as data from Jensen et al. 16 for 20/20 K and 20/10 K in Fig. 2 had shown.
3.1 Compressor
Compressors have a major impact on the WD and efficiency of heat pumps. There exist many different compressor types with individual characteristics. Mostly reciprocating piston and oil cooled twin-screw compressors are used for heating capacities below 10 MW 4 and are obtainable for NH3. Therefore, only these both types are considered in this work. The wet compression cycles are only conceivable with a screw compressor. Tab. 1 lists typical technical limits and parameters of both types.
To not favor a specific pressure ratio, the build in volume ratio of the compressors is assumed to be variable so that isentropic and volumetric efficiencies follow the pressure ratio linearly. This choice will raise the efficiency of the cycles towards low pressure ratios. The screw compressors have two temperature limits, the first one is due to the temperature gradient across the rotors and the second one due to the applied oil. The maximal discharge temperature for reciprocating piston was set to 180 °C, which is 20 K above an experimental proofed limit of 160 °C 20. The isentropic efficiency is an important parameter but depend on other parameters like capacity or rotational speed. The function applied by Brunin et al. 14 is between the best 20 % of Edler's 21 study on semi-hermetic piston compressors of small capacity (< 200 m3h−1) and the data of an unspecified NH3 twin-screw compressor 22. Therefore, for both compressor types the function of Brunin et al. 14 will be applied to the simulation models. For wet compression the volumetric efficiency is the same as for the reciprocating piston compressor because no experimental proof for wet screw compressors for this special purpose exists so far and the experiments by Zaytsev 18 revealed open challenges concerning the sealing of the working clearances of the rotors.
3.2 Heat Exchanger
Different methods to compare condenser and evaporator between CHPSC and standard compression cycles was discussed by Hultén et al. 23. Since the technical WD are of interest, the same pinch points (PP) are used. The secondary fluid in source and sink is liquid water pressurized to 10 bar. So, temperatures below 0 °C were excluded by this assumption, although the cycle might be capable providing these temperatures. Internal heat exchangers typically increase the WD, the smaller their PP is.
To estimating the HTA, constant thermal transmittances for evaporation, condensation, a mixing of both and one phase heat exchange are assumed for both working fluids. Due to high deviations between different heat transfer correlations for pure refrigerants during condensation and evaporation of up to 300 % 24, a detailed calculation of the heat transfer is not undertaken, instead averaged and estimated values are used.
 (5)
(5)These values are significantly lower compared to Jensen et al. 16 and Ommen et al. 26 except for pure refrigerant evaporation, but for NH3/H2O in accordance with experiments 20.
|
|
U [W m−2K−1] |
|
|---|---|---|
|
NH3/H2O |
R1336mzz(Z) |
|
|
evaporator |
1400 |
1500 |
|
condenser |
1100 |
1400 |
|
internal heat exchanger (liquid/liquid) |
2500 |
– |
|
internal heat exchanger (liquid/evaporator) |
1400 |
– |
|
internal heat exchanger/intercooler (gas/liquid) |
250 |
250 |
3.3 Other Devices
For heat exchangers, expansion valves, gas-liquid separators and liquid pumps only the maximal pressure limit is set to 25 bar or 40 bar. The minimal low pressure is 1 bar to avoid inert gases to enter.
4 Thermodynamic Model
 (6)
(6) (7)
(7) (8)
(8) (9)
(9) (10)
(10) (11)
(11) (12)
(12)While the first parameter is an indicator for the operational costs, HTA and VHC are representatives for the investment costs.
4.1 Compressors
 (13)
(13)The compressors are adiabatic. Isentropic and volumetric efficiency follow the equations in Tab. 1. The two-stage compression cycle has additional degrees of freedom and is treated in two different ways. In one case the pressure ration and in the other case the CDT of both compressors is equal.
4.2 Heat Exchangers
All heat exchangers are assumed isobaric, in counter flow with a PP of 5 K. Condensation stops at the saturated liquid curve and evaporation of R1336mzz(Z) at the state of saturated vapor. The PP locations are summarized in Tab. 3.
|
|
NH3/H2O |
R1336mzz(Z) |
|---|---|---|
|
evaporator |
forced to cold side |
cold side |
|
condenser |
forced to hot side |
saturated vapor |
|
internal heat exchanger (liquid/liquid) |
hot side |
– |
|
internal heat exchanger (liquid/evaporator) |
cold side |
– |
|
internal heat exchanger/intercooler (gas/liquid) |
cold side |
cold side |
 (14)
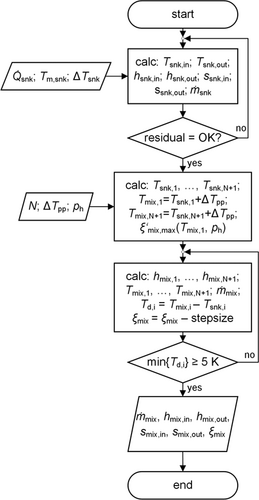
(14) and the enthalpy at both sides of the condenser remain as unknowns. These parameters are calculated with the help of an algorithm, whose program flow chart is shown in Fig. 4. Sink heat flow
  , sink mean temperature Tm,snk and sink temperature difference ΔTsnk are predetermined as they represent the general task of the heat supply. In the first iteration loop temperature, enthalpy and entropy at the inlet and outlet plus the mass flow of the secondary fluid of the sink are calculated to a specified tolerance. In the main routine the number N of parts of which the heat exchanger is divided into, the pinch point temperature difference ΔTpp and the high pressure are predetermined. As the temperature profiles are continuous N has not to exceed a value of 20. The temperature profiles of both streams are calculated by fixing the temperature difference between both streams at the cold and hot end of the condenser to the previous defined value. A maximal value for the mass fraction of the strong solution
  is calculated as well. It is defined by the high pressure and the minimal temperature of the mixture in a state of saturated liquid at the cold side of the condenser. In the second iteration loop the condition of a fixed temperature difference at the cold side is dropped and the mass fraction is lowered step by step until every temperature difference between both streams along the condenser is greater than 5 K. The lowering of the mixture's mass fraction in general results in a change of the shape of the temperature profile from concave to convex, so that the temperature difference of the mixture gets smaller compared to the external fluid. If the second iteration loop was successfully solved to a specific tolerance, the algorithm has calculated the mass fraction, the mass flow of the rich solution as well as the enthalpy and entropy of the mixture at both sides. Due to the coupling of the specific enthalpy difference of condenser and evaporator via
 (15)
(15)the slope of the internal temperature profile in the evaporator is smaller so that this algorithm indirectly solves the PP problem within the evaporator, if the external temperature glides are symmetric, see Fig. 5. If the high pressure is fixed at its technical limit the low pressure level is raised too. This circumstance is beneficial for COP and VHC as ν decreases with higher pressure. Further the pressure ratio decreases increasing the COP and decreasing the CDT.
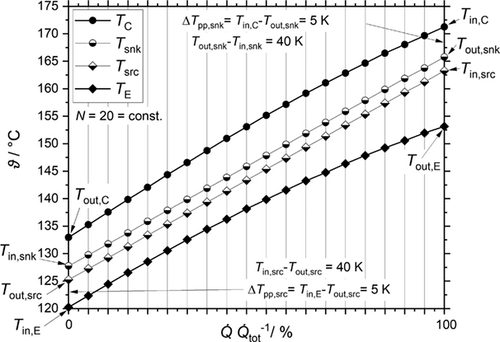
 (16)
(16)where Tm,i are the thermodynamic mean temperatures of both fluid streams calculated by the exact solution in Eq. 4.
4.3 Other Devices
No pressure losses are considered. The solution pumps are reversible. The expansion valves isenthalpic. Separators are adiabatic and the entering and leaving mass flows are equal in pressure and temperature.
4.4 Simulation Environment
The system of equations and individual procedures for each cycle are separately put in an own subroutine of the software engineering equations solver (EES) V10.836-3D. A mesh for Tm,snk and Tm,src with 2.5 K steps is prepared and solved via the parametric table property. Tm,src and Tm,snk start with the lowest values. At first Tm,snk is increased until a defined maximum is reached, then Tm,snc is increased by one step and Tm,snk is decreased to ΔTlif = 2.5 K. This method results in a maximum of 1200 calculations per cycle and individual temperature glide. The resulting waveform is crucial for convergence although the guess values are updated after each successful calculation, because it prevents large steps in ΔTlif. The property data of NH3/H2O is calculated with the help of the external library AWMix 1.0, which includes a Helmholtz Free Energy equation of state developed by Tillner-Roth et al. 27. Property data of R1336mzz(Z) is supplied by EES.
5 Results
In Figs. 6a–d the WD of the cycles STD25, R1336, WETC and 2STTT for four symmetric temperature differences at source at sink between 20 °C and 150 °C are shown. This range is chosen to cover the investigated temperature range by Marina et al. 5. The WD of pure NH3 in a classic compression cycle constrained by a high-pressure limit of 40 bar is added to the figures to outline that above 70 °C to 85 °C CHPSC cycles are able to retain NH3 as working fluid. CHPSC cycles with NH3/H2O are able to operate below this temperature range as well, but the industrial heat demand is negligibly below 60 °C, cf. Fig. 1. As STD40 do not significantly extend the WD compared to STD25, see the detailed results in Figs. S9–S12 in the Supporting Information, and 2STPP is inferior towards 2STTT, Figs. S21–S24, both cycles are excluded from Figs. 6a–d. All the detailed results involving symmetric temperature differences of 5 K, 10 K, 20 K and 40 K at sink and source and the cycles STD25, STD40, R1336, WETC, 2STTT and 2STPP containing the WD, COP, HTA and VHC are given in Figs. S1–S24.
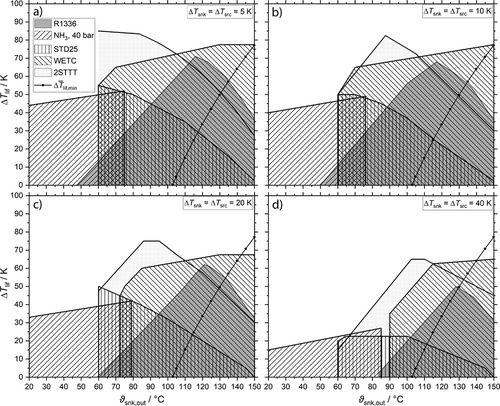
In all cases 2STTT and WETC match the WD of R1336. High temperature lifts up to 85 K are attained by these NH3/H2O cycles, but only WETC is able to provide  up to 150 °C. STD25 reaches 150 °C but without a considerable temperature lift at any ΔTsnk. 2STTT and R1336 come below
  at about 130 °C. In comparison to the reference R1336 the WD are contrary due to the sub atmospheric vapor pressure of R1366mzz(Z) at low temperatures. While the temperature lifts of R1336 and 2STTT decrease towards 150 °C because of the CDT limit, WETC is not affected by the CDT limit. A detailed comparison of these cycles is given in Fig. 7 for ΔTsnk = 10 K, which is closer to the Carnot cycle and therefore beneficial for R1336.
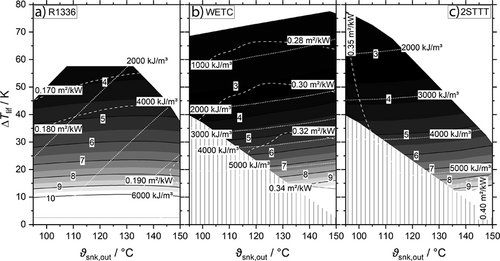
If temperature lifts are greater than 20 K the COP is about one point lower for both NH3/H2O cycles. The HTA in relation to R1336 is twice as large for 2STT and 1.7 times for WETC. The course of the VHC curves is different between the pure working fluid and the mixtures. Due to the change in composition and therefore nearly constant pressures the VHC depends on Tsnk,out weakly, whereas a linear relation is found for R1336 making a direct comparison subject to Tsnk,out. The turning point is at about 130 °C as from where the VHC of R1336 becomes greater. At temperature lifts of about 60 K the VHC of WETC falls below 1000 kJ m−3, while it is 2000 kJ m−3 for 2STTT. R1336 in a single compression cycle is not capable of these temperature lifts.
If ΔTsnk is raised to 20 K and 40 K, cf. Figs. S3, S4, S15, S16, S19 and S20, the COP of both NH3/H2O cycles increases and at 40 K is at about one point higher than R1336. The HTA also decreases to be slightly greater than for R1336 at 40 K where the VHC of WETC and 2STTT is always greater than of R1336. Although it is often highlighted in literature that the temperature profiles in evaporator and condenser are matching better for working fluids approaching the Lorenz cycles, thus leading to less entropy production in these devices, the overall performance of the cycle towards a pure working fluid becomes just higher at about 20 to 30 K in the case of NH3/H2O and the cycles STD25, STD40, 2STTT, 2STPP and WETC.
6 Conclusion
This systematic simulation study has shown that the use of NH3/H2O in high temperature heat pumps with considerable temperature lift and sink flow temperature up to 150 °C opens a large potential for waste heat usage in EU28 industry. Dry compressors in the Osenbrück cycles at pressures limits of 25 bar and 40 bar are indeed only suitable up to 120 °C as was stated by Jensen et al. 16. Two-stage intercooled or wet compression cycles are necessary to significantly overcome the limiting compressor discharge temperature (CDT) of the standard Osenbrück cycle. But above 130 °C, the temperature lift between waste and process heat increases in a way only wet compression is able to deal with. In comparison to R1336mzz(Z) the heat transfer area ratio (HTA) of NH3/H2O is about 1.5–2 times larger, but the COP and volumetric heat capacity (VHC) values are comparable within the working domain (WD) of R1336mzz(Z). The symmetric conditions for ΔTsnk and ΔTsrc chosen here, allow some minor space for a further extension of the WD. Especially ΔTsrc might not be fixed, but since the other constrains were already technically limited, it is questionable if all parameters like WD, COP, VHC and HTA may be maximized simultaneously.
Additional equipment for the two-stage cycles as liquid pump and separator has to be taken into account when costs are specified. These costs are not being tracked by the evaluation parameters. However, the wet compression cycle is simpler and performs likely the two-stage cycles except when it comes to the VHC. The implementation of wet compression is possible with modified screw compressors, whose differential pressure may not exceed 12 bar as was considered here, but these compressors are not commercially available contrary to two-stage compressions cycles, which are already distributed.
This investigation did not consider all compression heat pump with solution circuit (CHPSC) variants and only the temperature range between 20 °C to 150 °C was evaluated. The lift of the investigated cycles at lower temperatures might be higher and the full potential of NH3/H2O in simple thermodynamic cycles needs to be further analyzed.
Supporting Information
Supporting Information for this article can be found under DOI: https://doi.org/10.1002/cite.202200111. This section includes 24 figures with detailed results of each simulation.
Acknowledgements
Open access funding enabled and organized by Projekt DEAL.
Symbols used
-
- A [m2]
-
area
-
- h [kJ kg−1]
-
mass specific enthalpy
-
 [kg s−1]
 -
mass flow
-
- N [–]
-
number
-
- P [kW]
-
power
-
- p [bar]
-
pressure
-
 [kW]
[kW] -
heat flow
-
- q [kJ kg−1]
-
mass specific heat
-
 [kW K−1]
 -
rate of entropy production
-
- s [kJ kg−1K−1]
-
mass specific entropy
-
- T [K]
-
absolute temperature
-
- U [W m−2K−1]
-
thermal transmittance
-
- ν [m3kg−1]
-
specific volume
Greek letters
-
- α [W m−2K−1]
-
heat transfer coefficient
-
- ζ [–]
-
Carnot efficiency
-
- η [–]
-
efficiency
-
- ϑ [°C]
-
Celsius temperature
-
- Λ [K bar−1]
-
isentropic heating rate
-
- λ [–]
-
volumetric efficiency
-
- ξ [–]
-
mass fraction
-
- π [–]
-
pressure ratio
Sub- and Superscripts
-
- ‘
-
saturated liquid
-
- 1, 2, …
-
numerical index
-
- C
-
condenser
-
- CP
-
compressor
-
- d
-
difference
-
- E
-
evaporator
-
- h
-
high
-
- HE
-
heat exchanger
-
- I
-
variable numerical index
-
- in
-
entering
-
- irr
-
irreversible
-
- l
-
low
-
- lif
-
lift
-
- lit
-
literature
-
- m
-
mean
-
- max
-
maximal
-
- min
-
minimal
-
- mix
-
mixture
-
- out
-
leaving
-
- pp
-
pinch point
-
- s
-
isentropic
-
- snk
-
sink
-
- src
-
source
-
- SP
-
solution pump
-
- tot
-
total
Abbreviations
-
- CDT
-
compressor discharge temperature
-
- CHPSC
-
compression heat pump with solution circuit
-
- COP
-
coefficient of performance
-
- EES
-
engineering equation solver
-
- EU28
-
28 member states of the European Union
-
- GWP
-
global warming potential
-
- HTA
-
heat transfer area ratio
-
- ODP
-
ozone depletion potential
-
- PP
-
pinch point
-
- VHC
-
volumetric heat capacity
-
- WD
-
working domain


