Abstract
A consecutive competitive gas-liquid reaction is investigated using a Taylor bubble setup regarding the influence of fluid mixing in the bubble wake on yield and selectivity. The concentration fields behind a Taylor bubble are visualized and measured quantitatively with a novel time-resolved absorption imaging technique based on Beer Lamberts law and an integral selectivity is derived. In addition, the calculation of the local selectivity, often used in numerical approaches, is discussed and the existing experimental limits for its derivation are pointed out. Finally, an increase in selectivity of a competitive consecutive reaction for enhanced mixing is experimentally confirmed.
1 Introduction
 ()
() ()
()The reaction kinetics k and mass transfer determine whether the reaction takes place directly in the boundary layer or in the liquid phase. For the applied model reaction, a clear distinction of these mechanisms is still part of further investigations. The efficiency of a process can be described by the yield and the selectivity. Both quantities depend on local mass transfer processes, i.e., fluid dynamics and reaction kinetics that affect each other 2-6. For a better understanding of the interplay of fluid dynamics, mass transfer and chemical reactions, a well-defined experiment with a high spatial and temporal resolution is necessary. For this purpose, in this study, a single Taylor bubble is fixed through a countercurrent flow in a glass capillary, allowing systematic and detailed investigations of fluid dynamics and concentration fields in the bubble wake ideally unveiling their influences on yield and selectivity 7.
 ()
() ()
()where v is the characteristic velocity. Within this work, the characteristic velocity is set equal to the averaged velocity over the cross section vc that is needed to fix the bubble in the countercurrent flow 11, 12.
Aim of this work is to investigate the influence of the mixing in the wake of the bubble on the selectivity regarding a main product P in a competitive consecutive gas liquid reaction. For this purpose, an integral but spatially and temporally resolved and a local definition of the selectivity are introduced and discussed 11.
2 Material and Methods
2.1 Experimental Setup
The chemical system applied in this study is the oxidation of iron(II) chloride-tetrahydrate, FeCl2·4H2O (Sigma Aldrich; CAS: 13478-10-9; >99 %) and tetraethylammonium iodide, (C2H5)4N(I) (Sigma Aldrich; CAS: 68-05-3; 98 %) using nitric oxide, NO (Westfalen AG, purity 2.0 = 99 vol %) in a methanol solution (ChemSolute, HPLC, gradient grade ≥ 99.9 %). This model reaction follows a consecutive competitive reaction scheme, producing in a first step an intermediate halogenido-mononitrosyliron compound (MNIC) at a reaction rate of k1 (MNIC) = 5.0 · 105 s−1 (20 °C) and a dinitrosyliron compound (DNIC) at a reaction rate of k2 = 0.04 s−1 (20 °C) within the second reaction step 13. As both compounds exhibit a strong light absorption at different wavelengths of the visible light spectrum (MNIC: 470 nm, DNIC: 700 nm), the reaction is traceable by means of UV/VIS spectroscopy. The reactive system is based on the work by In-Iam et al. 14 and has been firstly introduced in 15.
As shown in Fig. 1, the experimental setup consists of a vertical glass capillary (L = 300 mm) that is connected to a reservoir. Valve 1 regulates the volume flow in the capillary necessary to fix the nitrogen monoxide bubble in the field of view of a high-speed camera (Phantom VEO640L, lens: Zeiss 2/50M ZF2.0 Makro Planar). The bubble is injected through a septum below the capillary by using a gastight syringe (Hamilton Gastight1001, 1 mL) and a hypodermic needle (Braun Sterican disposable cannula, 0.40 × 20 mm). To obtain different fluid dynamic conditions two different capillaries are used with diameters of D = 4.0 mm and D = 5.0 mm. The imaging UV/VIS spectroscopy has a field of view of (4 × 60) mm2 and respectively (5 × 60) mm2. Tab. 1 shows the characteristic fluid dynamic quantities, such as rise velocities and corresponding Reynolds number. The capillary is surrounded with a borosilicate glass duct filled with 97 wt % dimethyl sulfoxide (DMSO) (Roth; CAS: 67-68-5; >99.5 % purity) and deionized water to adjust the refractive index (n = 1.473 at 298 ± 1 K). The reservoir is connected to a flask filled with the reaction solution. The experiment is hermetically sealed and rinsed with argon (Westfalen AG, purity 5.0 ≥ 99.999 vol % purity) for 30 min before measurement to get an oxygen-free atmosphere. A volume of VRes = 250 mL methanol is treated with argon for t = 10 min to remove other gases (degassing). The weight of 0.497 ± 0.001 g iron(II)-chloride and 2.572 ± 0.001 g iodided salt are added for a reaction solution (MNIC and DNIC are produced) with a starting concentration of cRes(FeCl2) = 10 mM. The reaction solution is again treated with argon during the entire measurement and held at a constant temperature of T = 288 K ± 1 K.
|
Diameter D [mm] |
4 |
5 |
|---|---|---|
|
Mean countercurrent velocity vc [mm s−1] |
6.83 ± 0.16 |
31.02 ± 1.45 |
|
Countercurrent flow rate QL [mm3s−1] |
85.83 ± 2.01 |
609.08 ± 28.47 |
|
Eötvös-number Eo [–] |
5.48 |
8.56 |
|
Reynolds-number Re [–] |
36 |
207 |
|
Wake structure |
laminar |
turbulent vortices |

To start the measurements, the reaction solution is brought into the capillary with a second gastight syringe (Hamilton Gastight1025, 25 mL) and a nitrogen monoxide bubble with a starting volume of Vb = 200 µL is injected. A 4 M NaOH solution scrubs the NO in advance to remove spurious NO2 from the NO gas flux. The high-speed camera records the decreasing bubble size and the reactions using a LED panel as a back light. Two different LEDs with wavelength peaks of λ1 = 470 ± 5 nm (LED 1: Würth Elektronik, WL-TMRC THT LED) and λ2 = 700 ± 10 nm (LED 2: Panasonic, LN21RPX) that are near to the absorption maximum of the reaction products are installed. The LEDs are triggered with 90 Hz each to get a high temporal resolution so that an overall imaging frequency of 180 Hz results. Fig. 1 shows the resulting gray value images exemplary.
2.2 Determination of Product Concentrations
 ()
() ()
() ()
()Eλ describes the measured extinction, I0 is the initial light intensity without absorbance caused by any reactant, I represents the light intensity due to absorbance, ε is the extinction coefficient, d describes the layer thickness of the liquid phase and c is the concentration. The extinction coefficients are experimentally determined for each wavelength and reaction product, directly within the Taylor bubble setup using the fiber optical UV/VIS spectroscopy probe. Based on the visual information it is assumed that the majority of the chemical reaction takes place at the center axis of the capillary, thus, the layer thickness d is assumed to be equal to the capillary diameter. If the resulting deviation between the assumed layer thickness d and the capillary is integrated over the capillary cross section and the value is divided by the number of pixels, a mean error of about 2 % is obtained. Nonetheless, this simplification tends to underestimate the concentrations close to the capillary boundaries. The deviations are, however, not significant for the determination of the selectivity, since the ratio of the concentrations is considered here. The initial light intensity I0 is determined for each wavelength by averaging ten grayscale images of the educt solution, recorded before the NO bubble is injected. By rearranging Eqs. 6 and 7 the desired concentration fields in the wake of the bubble can be calculated pixel-wise for every pair of images (Fig. 2).

Due to spatial and temporal fluctuations within the initial light intensity I0 the lower sensitivity limit of the concentration regarding the first product MNIC is about cMNIC = 0.125 mmol L−1 and about cDNIC = 0.05 mmol L−1 for the by-product DNIC. Therefore, concentration changes below those limits cannot be determined 15. The evaluation of the wake structures is performed on the basis of the characteristic Eötvös- and Reynolds numbers according to Kastens et al. 16. From the visualized results (videos V.1 and V.2 in the Supporting Information) one can clearly observe a more laminar flow without vortex structures in the D = 4 mm capillary and a more turbulent vortex structure in the D = 5 mm capillary. The vortex structures described in the work of Bugg et al. 17 could not be observed in the laminar flow case, which is probably due to the different media and their deviating viscosity.
 ()
()with the reaction taking place in the interface and the bulk phase respectively 18. Though these assumptions need to be proven in further experimental work.
3 Results
 ()
()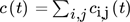 are summed up over a time interval tobs = 4.2 s (750 images), which corresponds to the length of the experiment, for each pixel (i, j) within a fixed control volume, marked red in Fig. 2. Each pixel (i, j) represents a cubic volume element. The heights of the control volumes (hcv,4mm = 0.067 mm and hcv,5mm = 0.346 mm) are determined by the mean velocities vc within the D = 4 mm and 5 mm capillary and the recording frequency (f = 180 Hz), i.e., h = vc/f. In this way, a complete volume exchange can be assumed in between each concentration measurement. The concentration changes for each time step ti of both reaction products can be described by the balance Eqs. 10 and 11
 ()
() ()
()The first terms on the right-hand side are the amount of product produced and consumed in the control volume and the second term represent the substance fluxes going in and out of the volume. Since only the velocity component in the vertical direction is considered for the evaluation, the remaining components are thus negligible and the analysis results in a one-dimensional approach. By solving the balance equation for both products MNIC and DNIC from the concentration fields, the integral selectivity Sint,i at each time step ti can be calculated applying Eq. 9. As the exact amount of converted educts cannot be determined at the outlet by means of UV/VIS spectroscopy (no relevant absorption), the total amount of educts converted is assumed as the sum of the amount of both products, MNIC and DNIC,  since no further reaction step is possible. The temporal progression of the integral selectivity Sint,i for the time period from t0 = 0 s to tobs = 4.2 s is displayed in Fig. 3. Summing the substance amounts of NMNIC and NDNIC within the observed time tobs yields the selectivity SMNIC and SDNIC for the entire process (Tab. 2) by applying Eq. 9.
|
Diameter D [mm] |
4 |
5 |
|---|---|---|
|
Total amount MNIC NMNIC [mmol] |
8.58 · 10−5 |
4.82 · 10−4 |
|
Total amount MNIC NDNIC [mmol] |
1.20 · 10−4 |
2.00 · 10−4 |
|
Total amount converted Ntot [mmol] |
2.06 · 10−4 |
6.82 · 10−4 |
|
Selectivity SMNIC [–] |
0.42 |
0.71 |
|
Selectivity SDNIC [–] |
0.58 |
0.29 |

 ()
() ()
()where it is assumed that  . In order to evaluate whether the intermediate MNIC or the second product DNIC is the dominating species, the calculated temporally and spatially resolved selectivity for both products are merged into one comparing plot. As the selectivity cannot exceed values greater than 1, each pixel where SMNIC ≥ 0.5 is marked with a green color map otherwise, when SDNIC > 0.5 it is marked with a red one. The resulting Fig. 4 shows the data for one time step (ti = 1.5 s), the corresponding videos V.3 and V.4 for all time steps can be found in the Supporting Information. Due to the lack of sensitivity at low concentrations, the error made at the calculations of the selectivity is about ± 0.213 for the intermediate MNIC and about ± 0.2561 for the by-product DNIC.

 ()
()The first reaction step forming the intermediate MNIC takes place rather instantaneously. The second reaction step for the formation of DNIC is taking longer due to the slower reaction kinetics and therefore benefits more from the longer contact time at high NO concentrations closer to the bubble. Nevertheless, the mixing conditions behind the bubble have a decisive influence on the selectivity, as can be seen in Fig. 4b, where its relative importance increases, when the contact time at the bubble is reduced due to faster flow velocities. Here, an exact measurement of the concentration boundary layer was not feasible. The influence of the liquid film and the residence time at the interface of bubbles has been addressed by Rüttinger et al. 19 and in case of Taylor bubbles in viscous media at laminar flow conditions has been addressed in Bugg et al. 17 and Meyer at al. 20.
4 Discussion and Summary
 ()
() ()
()The deviation of the data show that an adjustment of the numeric approaches to the experimentally considered case is necessary. However, it becomes also clearer that a direct comparison between numerically determined local selectivity and experimentally determined selectivity data is challenging and illustrates a clear knowledge gap, which needs to be closed in the future, by improved numerical approaches or experiments that are more sophisticated. Within numeric approaches all the initial parameters like mass flux, fluid dynamic conditions, concentrations of all reactants and reaction rates are exactly known or defined. This allows to describe all occurring dependencies mathematically and to solve them subsequently for each computational cell (schematically shown in Fig. 5). Thus, the local selectivity describes only the selectivity changes due to the reaction but neglects the convective mass flux. This is in contrast to the integral selectivity, which is evaluating the total amount of a product and cannot distinguish the local changes.

A local consideration of selectivity using experimental data would thus be desirable, not only for a better comparison to numeric approaches, but also for a deeper understanding of the influence of the local flow phenomena. However, measuring the required terms experimentally is very demanding. In order to determine the local selectivity in the wake of the bubble within future experimental studies, the substance flux due to inflow from different cells must be known in addition to the concentration fields, e.g., by superimposing 3D time-resolved flow field measurements by measurements techniques such as tomographic PIV. In addition, the measuring principle of imaging UV/VIS spectroscopy needs to be improved in sensitivity, as very small concentration changes cannot be evaluated yet, which is indispensable to visualize the small concentration changes occurring within a single cell or pixel in time. Since the experimental determination of local selectivity is to date unfeasible in absorption imaging, we suggest that numeric studies could in turn additionally determine spatio-temporally resolved integral selectivity for comparison.
By applying a newly developed UV/VIS imaging method we visualize the formation of several reaction products simultaneously at high temporal and spatial resolution. Based on the concentration fields in the wake of a fixed NO bubble the integral selectivity describing the complete reaction after different process times ti is calculated. With the aid of a spatio-temporally resolved integral selectivity we observe the influence of mixing on a chemical competitive consecutive reaction.
Supporting Information
Supporting Information for this article can be found under DOI: 10.1002/cite.202000241. Movies: V.1: Concentration field behind the D = 4 mm capillary. V.2: Concentration field behind the D = 5 mm capillary. V.3: Temporally and spatially resolved selectivity in the bubble wake of the D = 4 mm capillary. V.4: Temporally and spatially resolved selectivity in the bubble wake of the D = 5 mm capillary. For further information please contact the corresponding author.
Acknowledgements
The authors gratefully acknowledge the financial support provided by the German Research Foundation (DFG) within the Priority Program “Reactive Bubbly Flows”, SPP 1740 (SCHL 617/12-2) and the working group of Prof. Klüfers (KL 624/18-2) for providing the chemical system used in this study. Open access funding enabled and organized by Projekt DEAL.
Symbols
-
- A [m2]
-
area
-
- c [mol m−3]
-
concentration
-
- D [m]
-
capillary diameter
-
- d [cm]
-
layer thickness
-
- Da(I) [–]
-
first Damköhler number
-
- E [–]
-
extinction
-
- Eo [–]
-
Eötvös number
-
- Ha [–]
-
Hatta number
-
- h [m]
-
height
-
- I [cd]
-
light intensity
-
- k [s−1]
-
reaction rate constant (1st order reaction)
-
- L [m]
-
length
-
- n [–]
-
refractive index
-
- N [mol]
-
amount of substance
-
- r [mol L−1s−1]
-
reaction rate
-
- Re [–]
-
Reynolds number
-
- S [–]
-
selectivity
-
- T [K]
-
temperature
-
- t [s]
-
time
-
- u [m s−1]
-
velocity
-
- v [m s−1]
-
flow velocity
-
- V [m3]
-
volume
Greek letters
-
- ε [L mol−1cm−1]
-
extinction coefficient
-
- η [Pa s]
-
dynamic viscosity
-
- λ [m]
-
wavelength
-
- ρ [kg m−3]
-
density
-
- σ [N m−1]
-
surface tension
-
- τ [s]
-
residence time
Sub- and Superscripts
-
- 0
-
initial strength
-
- A
-
reactant A
-
- B
-
reactant B
-
- b
-
bubble
-
- c
-
counter flow
-
- cap
-
capillary
-
- conv
-
convective
-
- crit
-
critical value
-
- G
-
gas phase
-
- i
-
time step
-
- int
-
integral
-
- L
-
liquid phase
-
- loc
-
local
-
- m
-
molar
-
- obs
-
observed value
-
- r
-
reaction
-
- res
-
reservoir
-
- tot
-
total
Abbreviations
-
- DNIC
-
dinitrosyl compound
-
- LED
-
light emitting diode
-
- MNIC
-
mononitrosyl compund