Extraction on a Robotic Platform – Autonomous Solvent Selection under Economic Evaluation Criteria
Abstract
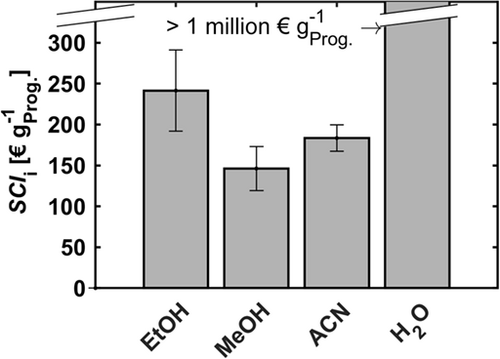
Steps and necessary decisions for a liquid-liquid extraction were pointed out for its automatic design on a robotic platform. A tool for solvent selection based on Hansen parameters was developed to simplify solvent selection. An approach was developed for automatic, visual phase boundary detection. Key performance indicators are used to ensure economically motivated decisions. The autonomous design of an extraction process is demonstrated for the separation of progesterone from a fermentation broth. The method leads to the selection of methanol and acetonitrile, with separation cost indicators of 146 and 183 € gProg.−1. This work constitutes the prospects of using autonomous robotic systems to design entire production processes.
1 Introduction
Performance and efficiency of biochemical processes depend largely on the decisions taken in early process development stages. However, in the early design stages, only limited data is available. For fast and reliable process design, automation of process steps and overall optimization is mandatory 1. Industrial automation increases the overall production efficiency. Not only the automation of already established production processes or process steps is important, but also the smart automatic design and development of completely new processes. Moreover, fermentation broths are often complex, with various phases containing unknown, newly developed products 2, 3. Heuristics are limited in their application and thermodynamic model parameters are not available during early process design stages 4, 5. Therefore, in biochemical process design, experiments are indispensable. Furthermore, human and material resources are limited and the time to market is crucial. Consequently, an automated process design approach including experiments and decision making can lead to an overall improved production process 1, 6.
During the last decades, automation of the upstream section has been well established 7-11. The improvements in the upstream section shifted the bottleneck towards downstream processing concerning the tremendous influence on the overall economics 3, 12. Automation during downstream processing is currently applied to high-throughput screening (HTS) systems 3, 6, 12-14, to single-unit operations 13, 15, and to established platform processes 16, 17. Robotic systems designed for specific experiments, such as liquid-liquid extractions (LLE) have been overviewed recently 18. In robotic LLE, the pre-set workflow can be executed reproducibly. For example, the Mettler-Toledo automated LLE workstation (ALLEX) dispenses and aspirates solvents and detects phase boundaries by sensors 19. However, such robotic systems are used only for experimental purposes. Versatility is missing for executing different processes on the same platform. The possibility to respond in a self-determined way by the corresponding software to changes in the purification task is limited.
The question arises which steps and decisions are necessary to generate an intelligent platform for various purification purposes. Therefore, this work addresses the development of a flexible and versatile robotic platform. The concept is introduced and developed based on the autonomous design of an automated LLE. Thereby, the focus lies on the autonomous suggestion and selection of suitable solvents. For this purpose, a systematic solvent selection tool combined with the automatic detection of phase boundaries between two liquids or a gas and a liquid is presented. The final selection of the best-performing solvent is based on the overall extraction performance considering economic issues. All decisions leading to the selection are made autonomously by the software, well-founded by key performance indicators (KPI). Here, no platform dedicated to LLE is needed. The screening experiments are executed automatically on a custom-built robotic platform. The platform utilized is introduced in the following section.
2 Materials and Methods
2.1 Robotic Platform
The custom-built robotic platform in Fig. 1 has been presented in detail by Schuldt and Schembecker 15 and Thygs et al. 20. The control of the robotic platform is ensured using the Zinsser WinLissy software (Zinsser Analytic GmbH).
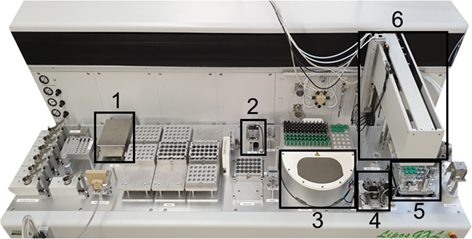
The modules are: an analytical scale, a camera, a centrifuge, a capping/decapping station for 1.5- and 8-mL vials, and a tempered shaking plate. A moveable robotic arm ensures sample transport into the 8- and 1.5-mL vials. Additionally, it is equipped with two liquid-dosing and two powder-dosing pipettes.
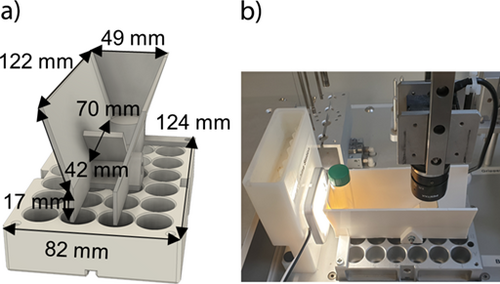
During the design of an LLE, many different solvents must be investigated regarding miscibility gaps. Generally, all liquid-handling pipettes on the robotic platform are equipped with capacitive sensors for liquid level detection. However, for many of the solvents utilized (Sect. 3), the differences in capacitance between two phases are too small to be detected by the sensors. Thus, the camera is utilized for visual liquid phase boundary detection. Since phase boundaries can only be detected laterally, an additional experimental setup was developed (Fig. 2a). It consists of a fixed platform for positioning vials, and a mirror is mounted at a slight angle, resulting in a lateral perspective in the pictures taken from above (Fig. 2b). The images recorded in grayscale are evaluated by MATLAB® R2018b. The methodology is explained in detail in the Supporting Information (SI). Because of the curvature of the liquid surface and the perspective distortion by the mirror, the phase volumes can only be approximated. Nevertheless, they can be applied for adjusting the liquid height for automatic phase sampling after extraction on the robotic platform and for solvent exclusion in the absence of a miscibility gap.
2.2 Model System
For method development and validation, a mixture of the following components mimicked a fermentation broth without biomass. The broth consisted of an aqueous phase with demineralized water prepared with a Milli-Q Synthesis system using a Millipak®-Express filter (0.22 µm; Millipore) and a soybean oil phase (Carl Roth). Progesterone (≥ 99 % purity; Sigma Aldrich) was the target component with a concentration of 1.5 g LFB−1. β-Sitosterol (≥ 70 % purity; Sigma Aldrich) was one impurity with a concentration of 0.5 g LFB−1. Other components were Tween®-80 (Merck) at 1 g LFB−1, corn steep liquor (Sigma Aldrich) at 5 g LFB−1, sodium nitrate (VWR) at 1.5 g LFB−1, and diammonium hydrogen phosphate (VWR) at 1 g LFB−1. The composition followed the fermentation medium described in the handbook edited by Barredo and Herráiz 21. The mass fraction of progesterone in the oily phase was 16 mg g−1. Consequently, the aqueous phase was separated and discarded due to the low content of the target component. The remaining oily phase was utilized for further experiments.
2.3 Analytics
The samples generated were analyzed by a high-pressure liquid chromatography (HPLC) system (Knauer) equipped with a diode array detector, an EC 250/4 Nucleodur 100-3 C8 column (Macherey-Nagel), and a Universal C18 4/3 guard column (Macherey-Nagel). The oven temperature was set to 30 °C. All samples were filtered by a syringe top filter (0.2 μm; Wicom). Progesterone was detected at a wavelength of 240 nm after 4.5 min. The main impurities were detected at a wavelength of 208 nm. The mobile phase consisted of acetonitrile (VWR) and demineralized water. The gradient applied can be seen in the SI.
2.4 Key Performance Indicators
 ()
()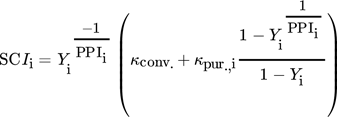 ()
()The SCIi approximates the cost efficiency of single process steps or step combinations without the need for a finalized process concept. Under the assumption that each purification step performs equally, the single-step performance is extrapolated towards complete purification. Purification steps with low SCIi values tend to be more cost-efficient than those with a higher SCIi 22, 23. The SCIi is utilized for fast and automated decisions in early process stages with the aid of the robotic platform. Relevant parameters for the SCIi can be found in the SI.
3 Method Development for Autonomous Solvent Selection
The success of an LLE method depends mainly on the solvent selection in the beginning. Besides costs, toxicity, viscosity, and safety, two main criteria are the selectivity towards the target compound and the presence of a miscibility gap between the feed solvent and the extraction solvent 25. To simplify solvent selection and reduce the experimental effort, different solvent selection tools have been developed in the past years 25-27. Two similar tools were developed by Gmehling and Schedemann 25 and Gani 27. Both tools utilize thermodynamic models to calculate mixture properties and are connected to several solvent databases. Hereby, handling complex fermentation broths with unknown structures, various impurities, several phases, and incomplete physical data proves to be challenging. A high number of experiments are necessary to obtain the information needed for the tools. Bergs et al. 26 developed a solvent selection guide for natural plant extraction in Microsoft® ExcelTM. The tool is connected to a database with around 83 solvents and contains their physical and chemical properties. The solvent suggestion is based on a solubility ranking regarding the 1-octanol/water partition coefficient, the Hildebrand parameters, and the Hansen solubility parameters (HSP) 26. This tool was developed for the design of a solid-liquid extraction process and therefore does not consider the interactions between a feed solvent and an extraction solvent. Thus, the tool is not applicable to an automatic solvent selection for LLE. Up to now, there is no systematic approach to identify suitable solvents with minimal experimental effort, especially based on lacking information about the system present. Thus, a concept for systematic solvent suggestion is introduced here.
To reduce the number of necessary experiments, the broad range of commercially available solvents must be limited from the very start. Furthermore, the remaining solvents should cover a wide range of physical properties to ensure the possibility of finding suitable solvents for various purification purposes. Initially, the database from the tool developed by Bergs et al. 26 is utilized, leading to a list of 83 solvents. The HSP posed the sound basis of the approach developed to characterize the reciprocal solubility of two materials in each other. The HSP consist of three different parts of the total energy of vaporization: dispersion forces δD, dipole forces δP, and hydrogen bonding δH 28. Materials with similar HSP are more likely to be soluble in each other 28. The HSP of the solvents are pictured in Fig. 3a and are listed in the SI. Apparently, the respective HSP for atomic dispersion forces are in a similar range around 15 MPa0.5 for the selected solvents. Furthermore, dispersion forces in solutions are mostly negligible, according to Strauss et al. 29. For the subsequent steps, the two-dimensional (2D) Hansen room referring to the dipole forces δP, representing the polarity of the solvents, and to the hydrogen bonding forces δH, representing the proticity of the solvents, is chosen (Fig. 3b). Most of the solvents have low δP and δH parameters. Furthermore, none could be identified with extremely low polarity, δP < 3 MPa0.5, but high proticity, δH > 20 MPa0.5 (Fig. 3b).
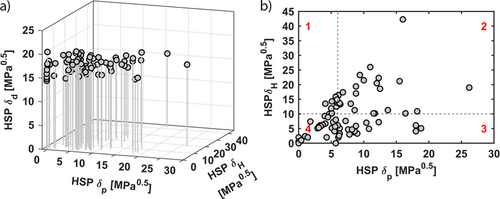
Since setting a defined boundary between, e.g., nonpolar and polar solvents is impossible, the 2D Hansen room is roughly divided into four different areas, each with a similar number of solvents (Fig. 3b). Although such classification looks arbitrary at the first view, the rough division into four different regions results in an estimated boundary between long-chain alcohols (section 1) and short-chain alcohols (section 2), and between ketones (section 3) and acetates (section 4). Additionally, ketones (section 3) and acetates (section 4) are differentiated from alcohols (sections 1 and 2). Overall, solvents with high abilities to split off protons or to form hydrogen bonds are positioned in sections 1 and 2. Solvents in sections 1 and 4 tend to be nonpolar, whereas solvents in sections 2 and 3 are more polar.
To reduce the number of solvents for the screening experiments, green solvent selection guides are applied to exclude hazardous solvents from the screening set 30. To further limit the experimental effort, representative solvents for each section are selected from the remaining ones. Hereby, the focus is on covering a broad spectrum of polarities and proticities, meaning that solvents near to the boundaries and solvents nearly centrally positioned in each section are selected. The procedure leads to three solvents in each area (Tab. 1). Additionally, water is selected in section 2 because it generally represents a potentially good solvent for a purification step. Since five different solvents can be used simultaneously in the robotic system without any further manual intervention, five different solvents are selected to form a first universal screening set (Fig. 4a). Thereby, four solvents, n-hexanol, butyl acetate, ethanol, and acetone, are chosen as they have nearly central positions in each section of the 2D Hansen room.
|
Section |
Solvents for the first screening |
Solvents for the second screening |
|---|---|---|
|
1 |
n-Hexanol |
n-Octanol, n-butanol |
|
2 |
Ethanol |
Methanol, n-propanol |
|
3 |
Acetone |
Acetonitrile, cyclohexanone |
|
4 |
Butyl acetate |
n-Heptane, ethyl acetate |
|
2/3 |
Water |
Methanol, acetonitrile |
- a) If a solvent forms a miscibility gap with the feed phase, the corresponding solvents in each section, namely, solvents of the second screening, are tested. The HSP of the solvents used can be found in the SI.
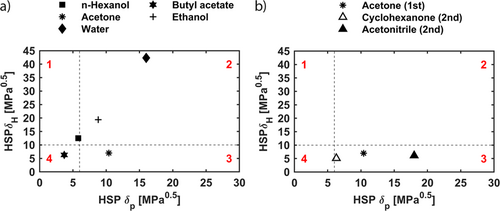
Additionally, water is selected as mentioned before. By this, a broad spectrum of polarities and proticities is covered during the initial screening experiments. Of the first screening set, only n-hexanol is located near the area boundaries in section 1, which can be traced back to the lack of solvents with δP < 3 MPa0.5 but high proticity of δH > 20 MPa0.5.
All solvents are investigated automatically under standardized conditions: 1 gSolv.gOil−1, 25 °C, single stage, 20 min of extraction time on the shaker at 1000 rpm, and 10 min of centrifugation time at 1500 rpm on the robotic platform. If no miscibility gap can be detected at the initial phase ratio of 1 gSolv.gFeed−1, the solvent will result in an inefficient extraction even when a phase split could be detected at higher solvent-to-feed solvent ratios. The high cross-solubility would always result in tremendous solvent loss or low purities of the extract phase.
Since a low cross-solubility is necessary for efficient extraction, the samples of the first screening are investigated automatically regarding the presence of a phase boundary between two liquids (Sect. 2.1; see also the SI). If a phase boundary is detected, the corresponding section of the solvent appears promising for efficient extraction. Thus, in each section with a detected liquid-liquid phase boundary, two solvents, one near the left and one near the right area boundaries in the 2D Hansen room, are tested in the next screening run (Fig. 4b, Tab. 1). All solvents of the second screening set are listed in Tab. 1 and plotted in the SI. Overall, more extreme solvents regarding polarity and proticity replace the initially centrally positioned solvents.
The concept is expandable to more solvents for specific systems, as it ensures fast identification of suitable solvent candidates without further knowledge of the system. Thereby, the focus does not lie on identifying an optimal solvent for extraction but more on fast data generation of a possible complex unknown system and fast process design. The approach represents a reliable start even for limited data at the beginning of the process design procedure and can be executed in a fully automated way on the robotic platform.
4 Results and Discussion
Merging the automated solvent suggestion tool (Sect. 3) and the liquid phase boundary detection (Sect. 2.1) leads to an automatic design of an entire LLE process on the robotic platform. All decisions made are well-founded on SCIi as the KPI (Sect. 2.4). The implemented autonomous workflow on the robotic platform coupled with external analytics is pictured in Fig. 5.
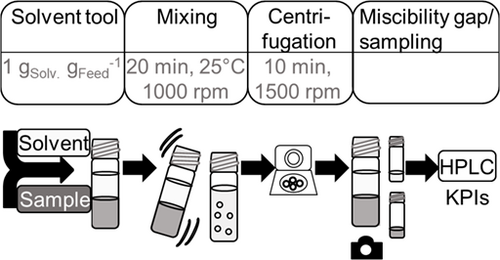
The target compound progesterone and the feed solvent soybean oil are both nonpolar. Thus, a solvent must be found that forms a miscibility gap with soybean oil, providing high solubility for progesterone, and which thereby should be medium polar. Nevertheless, to demonstrate the solvent selection approach presented in Sect. 3, n-hexanol, water, ethanol, butyl acetate, and acetone are tested regardless of the physical properties of the current system. For each solvent, the automated workflow on the robotic platform is executed according to Fig. 5.
During the first screening, water and ethanol form a miscibility gap with the feed phase (Fig. 6a). Due to the absence of a miscibility gap for butyl acetate and n-hexanol, solvents of sections 1 and 4 are excluded from the further screening (Fig. 6b). The solvent neighbors of ethanol in section 2, methanol and n-propanol, are tested in the second screening (Tab. 1). Additionally, the miscibility gap with water leads to the subsequent solvents: methanol in section 2 and acetonitrile in section 3.
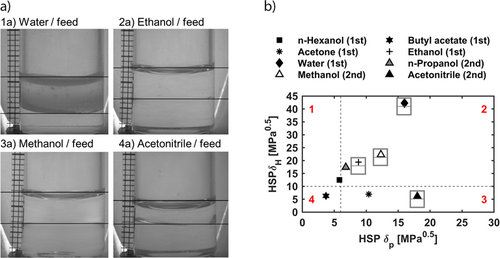
During the second screening run, only the solvents methanol and acetonitrile show a miscibility gap with the feed phase (Fig. 6). Thus, solvents close to the boundary of δP = 6.0 MPa0.5 from sections 2 and 3 are no longer considered for LLE. The procedure demonstrates that a second screening is always necessary since the solubility of solvents in the same section towards the feed phase might differ. Due to the stepwise screening, the number of experiments necessary to identify potential solvents for an LLE is reduced.
To evaluate the performance of the extraction step, the KPI introduced in Sect. 2.4 are utilized (see the SI). The PPIi values are calculated based on the initial weight fraction of progesterone and the peak area purity obtained by HPLC analysis. Furthermore, the experimental yields of progesterone are compared (Fig. 7). Accordingly, ethanol leads to a PPIi of 40 % and an experimental yield of 53 %. Compared to methanol and acetonitrile, the lower purification performance can be traced back to a higher cross-solubility between ethanol and soybean oil 31. A low PPIi of 37 % is obtained for the extraction with water and yields around 1 %.
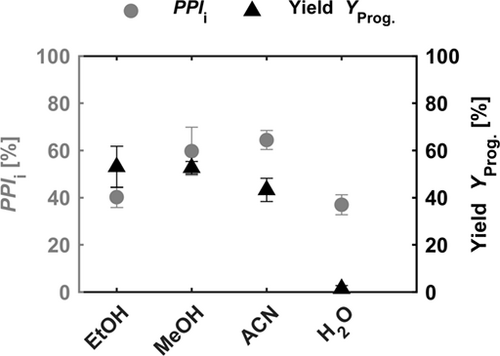
Nevertheless, due to the selection of water, the solvent tool suggests acetonitrile for the next round, which achieves higher yields and purities. Acetonitrile results in a slightly higher PPIi of 64 % and methanol leads to a PPIi of 60 % (Fig. 7). The extraction with acetonitrile leads to an experimental yield of 43 % and with methanol, to 53 %. Besides water, each solvent shows a similar extraction performance. To further narrow down the solvent selection, purification costs must be taken into account as well.
The resulting SCIi values are pictured in Fig. 8, aiming at low values for an efficient overall process. The SCIi values shown are based on one purification step extrapolated towards an entire process, under the assumption of identical step performance. The highest SCIi of > 1 million € gProg.−1 is calculated for the extraction with water. Thus, water can be excluded. Extraction with ethanol leads to an SCIi of 242 € gProg.−1, which is significantly higher than the SCIi for extraction with methanol. Thereby, ethanol can be excluded from further screening as well. The software of the robotic platform selects the solvent with the lowest SCIi for the process step. In this case, the selection is not explicit due to the overlapping error bars of methanol and acetonitrile (Fig. 8). Thus, for subsequent experiments, methanol and acetonitrile are suggested. Nevertheless, the stepwise screening gradually leads to solvents with low cross-solubility with the feed phase and high solubility towards the target component.
By further experiments, it should be investigated whether a possibly better performance compensates the higher purification costs of acetonitrile. Here, the solvent-to-feed ratio and the number of extraction stages should be automatically varied to highlight potentially different performances and to identify the optimal operating point, meaning the lowest SCIi. Since the steps mentioned can be covered by the basic workflow of liquid handling platforms, they are not discussed further in the present work.
5 Conclusion and Outlook
This work addresses steps necessary for the intelligent and automatic design of an extraction process on a robotic platform. The extraction is designed and executed by the robotic platform itself. Thereby, the combination of automatic solvent suggestion, autonomous detection of liquid phase boundaries, and economic rating by KPI leads to a powerful tool for downstream process design. The experiments confirm, for the system tested, that the tool developed leads to two suitable solvents, methanol and acetonitrile. Thus, the solvent set, reduced from the very start, results in an intelligent, fast, and systematic approach for solvent selection for an LLE. To identify optimal operating conditions concerning the temperature and the solvent-to-feed ratio, further experiments can be executed on the same robotic platform. Thereby, the most suitable solvent for the specific purification task should be selected.
The methodology can be applied to further purification tasks as well. Since the method has already proven its suitability for the purification of progesterone out of a fermentation broth, various dissolved high-value steroids or steroid precursors, like cholesterol, further gestagens, or even estrogens can also be purified out of fermentation broths. Additionally, in future works, the developed methodology can be utilized for the purification of heat-sensitive materials like flavors. Another opportunity is the removal of high-boiling organics from wastewater, e.g., phenol.
Furthermore, the tool developed will be utilized for the design of entire downstream processes on the robotic platform. For this purpose, the methodology developed for extraction will be transferred to further unit operations in future works. Here, systematic approaches are also necessary for the screening of, e.g., adsorbents for adsorption steps. Those must cover a broad range of physical properties to ensure that suitable candidates are identified, like in the present study. Each decision is based on the comparison of KPI, resulting in the ranking of process alternatives. Afterward, the obtained results are compared to the boundaries set at the beginning of the process design. This methodology will ensure efficient automatic process development of entire production processes, independent of initial data and even for complex systems.
Supporting Information
Supporting Information for this article can be found under DOI: 10.1002/ceat.202100171. This section includes additional references to primary literature relevant for this research 32, 33.
Acknowledgements
The research has received funding from the Federal Ministry of Education and Research (funding code: 161B0620). This work forms part of the Syntheroids project (“Synthetic biology for industrial production of steroids”; ERA-CoBioTech 1st call). Open access funding enabled and organized by Projekt DEAL.
The authors have declared no conflict of interest.
Symbols used
-
- c [g L−1]
-
concentration
-
- PPIi [%]
-
purification performance index
-
- SCIi [€ g−1]
-
separation cost indicator
-
- x [–]
-
purity
-
- Y [%]
-
yield
Greek letters
-
- δ [MPa0.5]
-
solubility parameter
-
- κ [€ g−1]
-
cost factor
Sub- and superscripts
-
- 0
-
initial
-
- conv.
-
conversion
-
- D
-
dispersion forces
-
- f
-
final
-
- FB
-
fermentation broth
-
- Feed
-
feed phase
-
- H
-
hydrogen bonding forces
-
- i
-
step
-
- in
-
inlet
-
- Oil
-
soybean oil
-
- out
-
outlet
-
- P
-
dipole forces
-
- Prog.
-
progesterone
-
- pur.
-
purification
-
- Solv.
-
solvent
Abbreviations
-
- HPLC
-
high-pressure liquid chromatography
-
- HSP
-
Hansen solubility parameter
-
- KPI
-
key performance indicator
-
- LLE
-
liquid-liquid extraction


