Characterization of the Biochemical Recurrence Prediction Ability and Progression Correlation of Peroxiredoxins Family in Prostate Cancer Based on Integrating Single-Cell RNA-Seq and Bulk RNA-Seq Cohorts
Funding: This research was supported by grants from the National Natural Science Foundation of China (82373166) and Guangzhou Municipal Science and Technology Project (202201020346) to W.Z.; Research Program of Health Commission of Hunan Province (No: 202204053584) to S.T.; The National Key clinical specialty Major Scientific research Project (No: Z2023145) to H.L.; Youth Medical Innovation and Practice Research Program of Guangzhou (2023QNYXZD004) to J.Y.
Shan Tang, Jinchuang Li, and Weicheng Tian contributed equally to this work.
ABSTRACT
Introduction
The peroxiredoxins (PRDXs) family plays a crucial role in balancing reactive oxygen species (ROS) levels in tumor cells. However, its potential role in prognosis and therapy response of prostate cancer (PCa) remains unknown.
Methods
In this study, we utilized 2 public single-cell RNA datasets and 8 bulk-RNA datasets to investigate the clinical value of six PRDXs family members in PCa. Expression comparison, biochemical recurrence analysis, and therapy response analysis were measured. Pathway enrichments were utilized to predict the potential down-stream pathway it may involve. In vitro experiments were used to validate the function of PRDX5 in the progression of castration-resistant prostate cancer (CRPC) cell lines.
Result
Among the PRDXs family, PRDX5 was most related to the advancement of prostate cancer. A nomogram integrating the expression of PRDX5 with clinical features was developed to better predict clinical outcomes in PCa patients compared to 30 published signatures. Immunohistochemistry was used to verify that PRDX5 expression was higher in advanced levels of PCa tissue. Gene Set Enrichment Analysis (GSEA) and pathway predictive analysis revealed that the PRDX5 related genes were mainly relevant to ROS Pathway, Mitochondria-related functions, cellular respiration, and oxidative phosphorylation. In vitro cell proliferation assays, ROS determination assay, and apoptosis assay together revealed that depletion of PRDX5 induces apoptosis via ROS accumulation in CRPC cells. Moreover, the expression of PRDX5 in CRPC cells also affects the sensitivity to the ARSI therapy.
Conclusion
This study offers new evidence for determining that the expression of PRDX5 is associated with advanced tumor grade, poor prognosis, and suboptimal response to multiple therapies in PCa within the PRDXs family. Last but not least, our study provides new insights into precision medicine in PCa and provides a reference for further research on PRDX5.
1 Introduction
Prostate cancer (PCa) is one of the most prevalent cancers in the world, with 299,010 new cases in the United States in 2024 and 1,466,680 new cases globally in 2022 [1, 2]. Most PCa is indolent at the time of diagnosis. Biochemical recurrence (BCR) is a critical stage in the progression of PCa [3]. Approximately 35% of patients experience BCR after receiving radical prostatectomy (RP) or radiation therapy (RT), with elevated prostate-specific antigen (PSA) levels commonly used as a reference in clinical practice [4]. Once PCa progresses to a more advanced stage, it advances rapidly and significantly increases the mortality rate of patients [5]. Without proper treatment, about 40% of patients will experience prostate cancer-specific death within 15 years [6]. Drug resistance is a major cause of treatment failure in PCa. Thus, clinicians must assess whether patients require personalized therapy. Exploring a reliable criteria to identify high-risk patients and the underlying mechanisms of BCR are urgently needed.
Reactive oxygen species (ROS), a wide set of unstable oxygen-containing molecules, are typical by-products of cellular metabolism and serve as signaling agents, impacting a range of cellular processes [7]. An alteration in the equilibrium of redox homeostasis, whether due to excessive or inadequate generation of ROS, can have detrimental effects and is associated with several clinical diseases [8, 9]. Elevated ROS levels can inhibit tumor cell growth by inducing oxidative DNA damage, enhancing cell cycle arrest, and promoting apoptosis [10-12]. The capacity to manage ROS from mitochondrial oxidative metabolism determines the proliferative outcome of cancer cells [13]. In addition, commonly used chemotherapeutic medications exhibit anti-tumor actions, partially by inducing high levels of ROS [14]. The capacity of cancer cells to adapt to inherent or drug-induced oxidative stress plays a role in their resistance to chemotherapy and ultimately contributes to the progression of the disease [15, 16].
Peroxiredoxins (PRDXs) are a group of peroxidases that are widely preserved across species and have the capability to remove peroxides, such as hydrogen peroxide (H2O2), organic hydroperoxides, and peroxynitrite, from the system [17-19]. The human PRDXs family currently comprises six members which are increasingly recognized as potential therapeutic targets for major diseases, including cancer [20-22]. The PRDXs family functions as an enzymatic antioxidant defense system within cells, protecting against oxidative and nitrosative damage induced by ROS [23]. Numerous studies have demonstrated that PRDXs family members are altered in various cancer types and are associated with progression and therapy resistance [24-27]. Nevertheless, the involvement of PRDXs in cancer is intricate. In most solid tumor progression, PRDXs transform their role from oncogenic molecules to cancer protectors by maintaining redox homeostasis within tumor cells [28, 29]. Thus, the role of the PRDX family in prostate cancer needs to be further explored.
In this study, we utilized 2 public single-cell RNA datasets and 8 bulk-RNA datasets to investigate the clinical value of six Peroxiredoxin family members in prostate cancer. The study investigated the expression comparison and BCR of the members. After determining PRDX5 as the most significant prognostic factor in the PRDX family, we developed a nomogram integrating PRDX5 expression with clinical features to better predict clinical outcomes in prostate cancer patients than 30 other 30 public gene signatures. PRDX5 was also found to be related to several clinical aspects such as prognosis in various molecular subtypes, responses to chemotherapy, and androgen receptor signaling inhibitor (ARSI) therapy in PCa. Further, immunohistochemistry (IHC) in tissue microarray was used to verify the correlation between PRDX5 and PCa progression. Pathway prediction results indicated that the PRDX5 expression level group was primarily related to Oxidative Phosphorylation, Fatty Acid Metabolism, ROS Pathway, cell cycle, glycolysis, and Peroxisome. In vitro cell proliferation assays, ROS determination assays, and apoptosis assays together revealed that depletion of PRDX5 induces apoptosis via ROS accumulation in CRPC cells. Moreover, the expression of PRDX5 in CRPC cells also affects the sensitivity to ARSI therapy. In conclusion, the objective of our study is to determine the value of PRDX5 as a biomarker influencing prognosis and response to treatment for prostate cancer.
2 Materials and Methods
2.1 Data Source and Procession
RNA-sequencing data from 100 normal prostate tissue samples were retrieved from the Genotype-Tissue Expression (GTEx, https://gtexportal.org/). Seven independent public datasets (including TCGA, CancerMap (GSE94767), DKFZ, GSE54460, GSE70769, Cambridge (GSE70768) and GSE116918) were accessed from The Cancer Genome Atlas (TCGA, http://portal.gdc.cancer.gov/) and Gene Expression Omnibus (GEO, https://www.ncbi.nlm.nih.gov/geo/). Single-cell sequencing analysis data were obtained from the sequencing results of GSE157703 and GSE141445 in GEO. Information on 545 drugs from the Cancer Therapeutics Response Portal (CTRP) database and 198 drugs from the Genomics of Drug Sensitivity in Cancer (GDSC) database was retrieved. Furthermore, data pertaining to ARSI therapy cohorts were obtained from Github (https://github.com/cBioPortal/datahub/tree/master/public/prad_su2c_2019).
To further validate the predictive performance of the PRDX5-Nomo signature, the C-indexes and hazard ratios (HR) of 30 gene expression prognostic signatures trained with the robust Cox-Ridge algorithm were downloaded from the PCaDB database (http://bioinfo.jialab-ucr.org/PCaDB/) [30]. We then computed the C-index and HR for each prognostic signature in these cohorts.
2.2 Gene Alteration Analysis
In order to look for somatic mutations linked to PRDXs, we used the cBioPortal website for our investigation (https://www.cbioportal.org), generating waterfall plots and bar charts. Additionally, we performed a copy number variation (CNV) analysis of PRDXs using the R package “Maftools,” which produced lollipop plots and Circos plots. These visualizations illustrate the mutation distribution of PRDXs in TCGA prostate cancer patients.
2.3 Single-Cell RNA-Seq Data Analysis
We analyzed the single-cell sequencing data using the “Seurat” package. Firstly, in the GSE157703 dataset, data quality control (QC) was conducted by retaining cells with less than 40% mitochondrial gene content and genes expressed in at least three cells within a range of expression greater than 200. In the GSE141445 dataset, QC was performed by retaining cells with less than 20% mitochondrial gene content and genes expressed in at least three cells within a range of expression between 200 and 5218. Subsequently, highly variable genes were identified for further analysis, with the number of highly variable genes set to 2000. Batch effects within individual sample data were corrected using the “Harmony” package. Cell clusters were constructed using the “FindClusters” and “FindNeighbors” functions, and visualized using the “Umap” method. Finally, cell annotation based on marker genes for different cell types was performed.
2.4 Survival Analysis and Construction of a Predictive Nomogram
Patients from datasets were categorized into high-expression and low-expression groups based on the optimal cutoff value of PRDXs gene expression levels. Subsequently, we conducted KM curve analysis using the “survminer” package in R to investigate whether there were significant differences in BCR between the high-expression and low-expression groups. Furthermore, the “timeROC” program was used to conduct ROC curve analysis to assess the sensitivity and specificity of PRDXs in predicting BCR in PCa patients. We also compared the area under the curve (AUC) of PRDXs with other clinical features. Furthermore, we explored the correlation between PRDX5 and several clinical features, including Gleason score and Pathological T stages. Univariate and multivariate Cox regression analyses were conducted on the TCGA-PRAD dataset to determine if PRDX5 is an independent prognostic factor for predicting survival in PRAD patients. In order to enhance the prognostic precision and prediction capacity of our model, we created a nomogram that measures the predicted survival of PRAD patients by combining PRDX5, Gleason score, and Pathological T stages [31]. Finally, we evaluated the accuracy and precision of the nomogram using ROC curves, the C-index, and calibration curves, as well as assessing its net clinical benefit using decision curve analysis.
2.5 PAM50 Clustering
PAM50 clustering was performed based on the original algorithm by Parker et al. [32]. The source code was downloaded from the University of North Carolina Microarray Database.
2.6 Drug Sensitivity Analysis
To achieve personalized therapy, R package “oncoPredict” was utilized to predict chemotherapy sensitivity in prostate cancer patients from TCGA. To attempt to determine the half-maximal inhibitory concentration (IC50), “oncoPredict” matches the tissue gene expression patterns of patients to the expression profiles of cancer cell lines. The relationship between each patient's level of PRDX5 expression and each medication was assessed using Spearman correlation, with p < 0.05 being regarded as statistically significant.
2.7 Immunohistochemistry Staining Analysis
We accessed IHC staining images of PRDX5 in normal prostate tissue, low-grade, and high-grade prostate cancer tissue from the Human Protein Atlas database to preliminarily identify the expression pattern of PRDX5.
Subsequently, we employed IHC to detect the expression of PRDX5 (67599-1-Ig, Proteintech) in Chinese tissue microarrays (HProA150CS01, OUTDO BIOTECH), employing adjacent non-tumor prostate tissue and tumor tissues of different pathological T-stages of prostate cancer. Following staining, we quantified staining intensity scores and generated box plots and violin plots for analysis. The criteria used to score the staining of the tissue samples were based on the percentage of cells stained: 0% stained cells, score 0; 1%–10% stained cells, score 1; 11%–50% stained cells, score 2; 51%–80% stained cells, score 3; and 81%–100% stained cells, score 4. The criteria used to score the tissue sample staining based on intensity were as follows: no staining, score 0; weak staining intensity, score 1; moderate staining intensity, score 2; high staining intensity, score 3; and strong staining intensity, score 4.
2.8 Functional Enrichment Analysis
We performed a differentially expressed gene (DEGs) analysis comparing the high and low PRDX5 expression groups using the “DESeq2” software and conducted Gene Set Enrichment Analysis (GSEA) based on the method described in past research [33]. This analysis adhered to stringent criteria, with qvalue < 0.05 and |NES| > 1, employing the R package “clusterProfiler” for pathway annotation and enrichment. Then, we conducted Pearson correlation analysis to identify the genes most closely related with PRDX5 expression in the TCGA_PRAD dataset with a filtering criterion of |cor| > 0.6. Enrichment analyses were performed to elucidate the biological significance of PRDX5 using these genes.
2.9 Cell Lines
Human PCa cell lines 22Rv1 and C4-2B were obtained from the American Type Culture Collection (ATCC HTB-81 and ATCCCRL1435, Manassas, VA, USA). All cell lines were grown in Roswell Park Memorial Institute 1640 medium (MA0215, Meilunbio, Dalian, China) containing 10% fetal bovine serum (HF1032-05, Holocene, Guangzhou, China) and 1% penicillin–streptomycin solution (15140-122, Gibco, Grand Island, NY, USA). Cells were maintained at 37°C with 5% CO2.
2.10 Cell Proliferation Assay
Cell proliferation was measured by CCK-8 (Cell Counting Kit-8, MA0218, Meilunbio) assay and colony formation assay. 5000 cells per well of 22Rv1 and 3000 cells per well of C4-2B were seeded in 96-well plates for CCK-8 assay. 800 cells per well of all cell lines were seeded in 12-well plates for colony formation assay. Abiraterone (S2246, Selleck) and Enzalutamide (S1250, Selleck) were used in the drug sensitivity assay.
2.11 RNAi Transfection of 22Rv1 and C4-2B Cell Lines
Human PRDX5-specific siRNA and negative control siRNA were purchased from Genepharma Co. Ltd. (Shanghai, China). The siRNA sequences are shown as follows.
| siRNA | ||
|---|---|---|
| PRDX5 | 5′–3′ | |
| si-1 | Sense | GAGUGUUAAUGAUGCCUUU(dT)(dT) |
| Antisense | AAAGGCAUCAUUAACACUC(dT)(dT) | |
| si-2 | Sense | CCCUGGAUGUUCCAAGACA(dT)(dT) |
| Antisense | UGUCUUGGAACAUCCAGGG(dT)(dT) | |
| si-3 | Sense | CAGAGCUGUUCAAGGGCAA(dT)(dT) |
| Antisense | UUGCCCUUGAACAGCUCUG(dT)(dT) | |
| si-NC | Sense | UUCUCCGAACGUGUCACGUTT |
| Antisense | ACGUGACACGUUCGGAGAATT | |
2.12 Western Blot Assay
The lysis products were quantified using the BCA Protein Assay Kit (#23227, Thermo Scientific). The protein expression level of the target gene was measured and quantified by western blot analysis according to the protocol of our previous studies [34]. Antibodies applied in the assay are in the dilution as follows: β-Actin (1:5000; ab8227, Abcam, Cambridge, UK), PRDX5 (1:1000; 17724-1-AP, Proteintech).
2.13 Determination of Reactive Oxygen Species (ROS) Levels
The levels of intracellular ROS were monitored by using a ROS assay kit (Beyotime, China). Briefly, cells were collected and stained with 10 μM DCFH-DA at 37°C for 30 min. ROS levels were measured by flow cytometry (BD FACSVerse, BD Biosciences, Franklin Lakes, NJ, USA) and a fluorescent microscope.
2.14 Apoptosis Assay
Cells were harvested after different treatments. After that, cells were stained with Annexin V-APC and 7-AAD (AP105, MultiSciences, Hangzhou, China). Finally, cells were subjected to a flow cytometer (BD FACSVerse, BD Biosciences, Franklin Lakes, NJ, USA). Analysis was conducted with FlowJo software. The ROS scavenger N-acetylcysteine (NAC) was bought from MedChemExpress (HY134495). The cells in the NAC group were pretreated with 3 mM NAC for 1 h.
2.15 Statistical Analysis
All statistical analyses were performed using R software (version: R 4.3.2). The Wilcoxon test was utilized as a non-parametric method to estimate differences between two non-normally distributed variables.
3 Results
3.1 Landscape of the Genome Alteration Features of the Peroxiredoxin Family in PCa
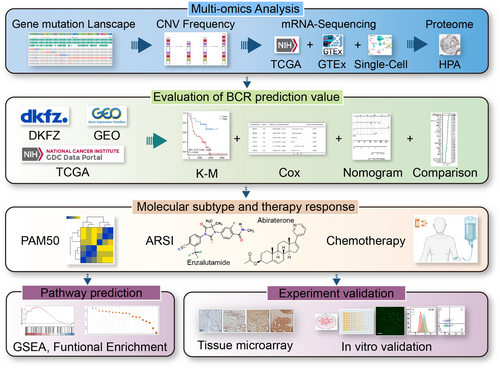
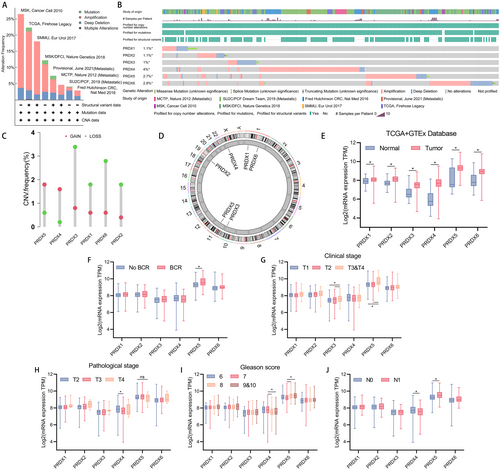
A total of 6 main types of peroxiredoxin from published papers were included in our study. Figure 1 depicts the workflow of the research. Copy number alterations (CNAs) are a prominent kind of genetic modification in human cancer and play a crucial role in the advancement of cancer, particularly in prostate cancer [35]. Germline genetic testing and tumor-directed somatic sequencing hold significant potential for treatment and assessing familial risk, which can aid in guiding treatment decisions [36]. We found that amplifications in PRDXs occupied a larger change frequency across multiple databases (MSK, TCGA, SMMU, MSK/DFCI, Provisional, MCTP, SU2C/PCF, and Fred Hutchinson CRC) using cbioportal (Figure 2A). After integrating data from 8 databases, PRDX4 was found to have the highest alteration frequency (4%), followed by PRDX6 (2.8%) and PRDX5 (2.7%), while PRDX1 (1.1%) and PRDX2 (1.1%) had the lowest frequency (Figure 2B). Additionally, in TCGA, PRDXs exhibited distinct CNV frequencies, with PRDX5 showing the highest CNV frequency amplifications (Figure 2C,D).
3.2 Landscape of the Bulk mRNA Expression Features of the Peroxiredoxin Family in PCa
Following that, the mRNA expression of PRDXs was examined by combining data from the TCGA database (483 prostate cancer tissues and 51 adjacent non-cancerous tissues) and the GTEx database (100 benign prostate tissues). Compared to benign prostate tissues, prostate cancer tissues demonstrated significantly elevated expression levels of PRDXs (p < 0.05) (Figure 2E). The expression level of PRDX5 were higher in patients with BCR compared to those who did not (Figure 2F, p < 0.05). Furthermore, in patients clinically staged as T3&T4 compared to T1, and T3&T4 compared to T2, PRDX3 and PRDX5 exhibited higher expression levels (Figure 2G, T3&T4 vs. T1, p < 0.05; T3&T4 vs. T2, p < 0.05). Patients of pathological stage T3 and T4 exhibited higher PRDX5 levels compared to patients staged as T2, although the difference was not statistically significant. The expression of PRDX4 in patients with pathological stage T2 was significantly higher than in T3 (Figure 2H, p < 0.05). Interestingly, compared to patients with Gleason scores of 8 and 9&10, patients with Gleason score of 7 exhibited higher expression levels of PRDX4, while PRDX5 showed the opposite trend, with higher expression levels in patients with higher Gleason scores (Figure 2I, Gleason score = 8 vs. 7, p < 0.05; Gleason score = 9&10 vs. 7, p < 0.05). Regarding lymph node staging, PRDX4 showed higher expression levels in patients staged as N0 compared to N1, while PRDX5 exhibited higher expression levels in patients with lymph node metastasis (Figure 2J, p < 0.05).
3.3 Tissue Sublocalization Expression of Peroxiredoxin Family in PCa
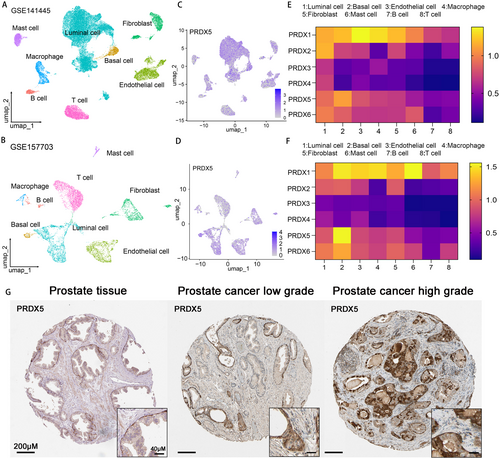
To further elucidate the role of PRDXs in prostate cancer, we performed studies utilizing two single-cell datasets collected from the GEO database (30,000 cells from GSE141445 and 7000 cells from GSE157703), comprising a total of 15 single-cell sequencing data samples of prostate cancer tissues. Uniform Manifold Approximation and Projection (UMAP) plots demonstrated effective separation of prostate cancer tissue samples into 8 distinct cell clusters, including luminal cells, basal cells, endothelial cells, macrophages, fibroblasts, mast cells, B cells, and T cells (Figure 3A,B). The markers identified by the differences in the main cell types were visualized as a bubble plot (Figure S1). Notably, all members of the PRDX family exhibited significantly higher expression levels in luminal cells and basal cells in accordance with the UMAP and heatmap (Figure 3C, Figure S2). Regarding the proteomics, IHC staining analysis of prostate tissue or PCa tissue from the Human Protein Atlas database showed that higher staining of PRDX3 and PRDX5 was found in higher grade of prostate cancer (Figure 3G, Figure S3).
3.4 Relationship Between mRNA Levels of Peroxiredoxin Family and Prognosis in Prostate Cancer
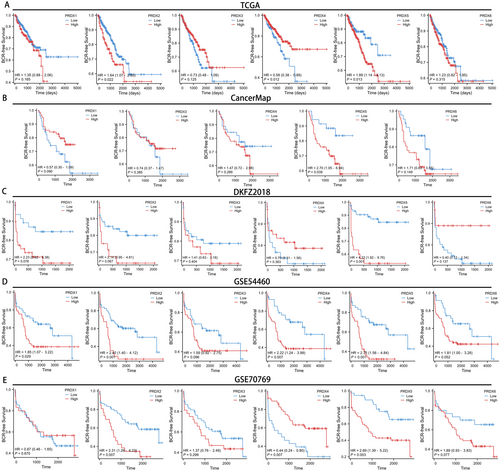
To comprehensively evaluate the prognostic significance of PRDXs in prostate cancer, we generated BCR-free survival curves for PRDXs across 7 databases (TCGA, CancerMap, DKFZ2018, GSE54460, GSE70769, Cambridge and GSE116918). In the TCGA database, patients with high expression levels of PRDX2 and PRDX5 increased a tendency towards BCR, with respective p-values of 0.022 and 0.013. On the contrary, higher expression of PRDX4 tends to decrease the likelihood of BCR (Figure 4A, p = 0.012). In the CancerMap and DKFZ2018 databases, only patients with high expression levels of PRDX5 were more prone to BCR, with respective p-values of 0.039 and < 0.001 (Figure 4B,C). In the GSE54460 database, patients with high expression levels of PRDX1, PRDX2, PRDX4, and PRDX5 showed a tendency towards increased likelihood of BCR, with respective p-values of 0.029, 0.001, 0.007, and < 0.001 (Figure 4D). In the GSE70769 database, patients with high expression levels of PRDX2 and PRDX5 exhibited a tendency towards increased probability of BCR, with respective p-values of 0.007 and 0.003. Consistent with the result from TCGA, higher expression of PRDX4 tends to decrease the probability of BCR (Figure 4E, p = 0.007). In the Cambridge dataset, patients with high expression levels of PRDX2 exhibited worse prognosis (Figure S4A, p = 0.008). In the GSE116918 dataset, patients with low expression levels of PRDX6 exhibited worse prognosis (Figure S4B, p = 0.015). Notably, across all 7 databases, patients in 5 datasets with high expression of PRDX5 were more likely to reach BCR, indicating that PRDX5 is the most promising biomarker within the PRDX family associated with BCR in prostate cancer.
3.5 Identification of PRDX5 as the Reliable Prognostic Biomarker for Prostate Cancer Within PRDX Family
As previously mentioned, patients with high expression of PRDX5 exhibited worse BCR outcomes compared to those with low expression of PRDX5 in several datasets. Univariate Cox regression analysis revealed that PRDX5, Age, gleason score, and pathological T stage were risk factors for BCR in prostate cancer patients, with PRDX5 exhibiting the highest hazard ratio among the PRDX family (Figure 5A,B). To explore the relationship between six family members and prognosis in different stages of prostate cancer, we performed univariate cox regression analysis after classifying patients in the TCGA-PRAD database into different stages. PRDX5 was a risk factor for BCR in prostate cancer patients with greater Gleason score, lymph node metastases, and higher pathological T stage (Figure S5, p < 0.05). Refer to the results above, PRDX5, Gleason score, and pathological T stage were included in a multivariate Cox regression analysis. The results demonstrated that PRDX5 (p = 0.038) and pathological T stage (p < 0.01) emerged as independent prognostic factors for prostate cancer (Figure 5C).
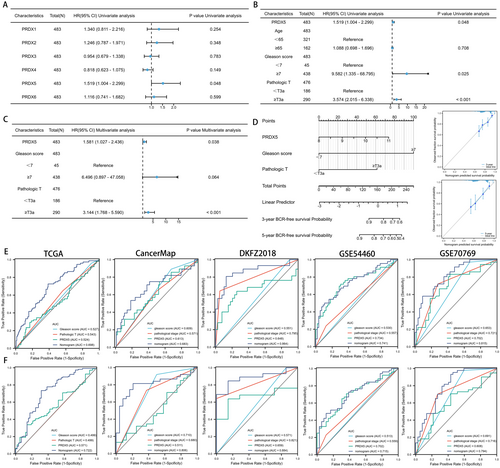
Given the notable prognostic significance of PRDX5 and its association with tumor staging and Gleason score in prostate cancer, we developed nomograms to predict patients' 3-year and 5-year BCR-free survival outcomes. Calibration curves illustrated that these nomograms exhibited predictive performance close to the ideal model (Figure 5D). Figure 5E,F revealed that the area under the curve (AUC) of the PRDX5-nomogram for 3-year/5-year BCR ranged from 0.698/0.722, 0.683/0.806, 0.864/0.884, 0.741/0.715, to 0.815/0.794 across five databases respectively. These AUC values of the nomogram surpassed those of individual predictive factors (i.e., PRDX5, pathological T stage, and Gleason score), strengthening the advantage of integrating these risk factors for prostate cancer prognosis.
3.6 Prognostic Value of the PRDX5-Nomo Model
To evaluate the prognostic value of the PRDX5-Nomo model, we calculated the C-index of our model and PRDX5, Gleason score, Pathological_stage, Gleason score + PRDX5, Pathological_stage + PRDX5, and Gleason score + Pathological_stage in five independent cohorts. We found that the PRDX5-Nomo model has the highest C-index in five long-term cohorts, with all C-indices greater than 0.6 (Figure 6A).

We then collected the published 30 signatures associated with various biological features. The C-index was used to estimate the probability that the predicted results will agree with the actual observed results [37] and HR was applied to represent the impact of PRDX5-Nomo on the risk of BCR. Figure 6B illustrates the 31 signatures in each. The results showed that PRDX5-Nomo had the highest C-index for predicting BCR for prostate cancer in CancerMap and GSE70769, ranked second in the TCGA, fifth in the DKFZ, and eighth in the GSE54460. Both C-indices are greater than 0.66. Our results showed that the HR of PRDX5-Nomo ranked top 1 in CancerMap, top 3 in GSE70769, top 8 in DKFZ and GSE54460, and top 17 in TCGA. All the log2(HR) of PRDX-Nomo were greater than 1.2, suggesting that PRDX-Nomo may have a negative impact on BCR (Figure 6C). Last but not least, we observed that the C-index of PRDX-Nomo was not consistent with the ranking of HR in TCGA, which may be caused by the heterogeneity of the cohort.
3.7 Value of the PRDX5 in Predicting ARSI Therapy and Chemotherapy Benefits in PCa
The PAM50 algorithm is able to differentiate between luminal- and basal-like subtypes in prostate cancer. These subtypes exhibit distinct clinical characteristics and show varying responses to postoperative androgen deprivation therapy (ADT) [38, 39]. The initial step is to classify the samples from the TCGA dataset into luminal A (LumA), luminal B (LumB) and basal phenotypes. The expression of PRDX5 across different PAM50 subtypes is illustrated in Figure 7A. The expression in LumB and basal phenotypes was higher than that in the LumA phenotype (p < 0.05). Significant shortening in BCR-free survival time among patients in LumB and basal phenotypes compared to that in LumA subtypes is shown (Figure 7B). We further constructed BCR-free survival curves for patients within each of the three PAM50 subtypes, respectively. Notably, patients with higher PRDX5 expression in both the basal and luminal A subtypes exhibited a higher propensity for BCR. Similarly, this trend was evident within the luminal B subtype, though there was a lack of statistical support (Figure 7C).

The next-generation ARSIs, especially enzalutamide and abiraterone acetate, were identified to perform significant advancement in PCa therapy. However, both histology, genomics, and transcriptomics factors may be associated with the failure of treatment and lead to disease progression [40-43]. Novel prognostic markers in metastatic castration-resistant prostate cancer were urgently needed. We explored the value of the PRDX5 in predicting patient response to ARSI within an independent ARSI cohort [44]. As shown in Figure 7D, the frequency of patients in the high PRDX5 group was higher after exposing them to ARSI therapy, and there was a reverse trend in patients who did not receive treatment. Patients with low PRDX5 expression levels had a longer duration of ARSI therapy compared to those with high PRDX5 expression levels. The proportion of patients who remained on ARSI treatment was lower in the high PRDX5 expression level group than in the low PRDX5 expression level group (Figure 7E). Notably, patients with low PRDX5 expression levels exhibited a more favorable outcome in terms of living compared to those with high PRDX5 expression. The high PRDX5 expression level group showed a significantly higher proportion of deceased patients compared to the low PRDX5 expression level group (Figure 7F).
So as to evaluating PRDX5's predictive capacity for drug sensitivity, we conducted analyses using the CTRP and the GDSC datasets (Figure 7G–J). Intriguingly, PRDX5 exhibited a positive correlation with sensitivity to MK-1775, MK-2206, Erlotinib, Olaparib, Afatinib, Gefitinib, Staurosporine, AZD4547, BMS-754807, Ibrutinib, Cediranib, BIBR-1532, Cyclophosphamide, KU-55933, Fulvestrant, Entinostat, NVP-ADW742, Nelarabine, Crizotinib and Navitoclax in both the CTRP and GDSC databases. Furthermore, PRDX5 exhibited a negative correlation with sensitivity to Pevonedistat, Gemcitabine. In summary, our data indicate that PRDX5 may have a significant influence on the clinical use of ARSI or chemotherapeutic medications.
3.8 Immunohistochemistry Assay Confirmed a Positive Correlation Between PRDX5 Expression and Malignant Progression in PCa
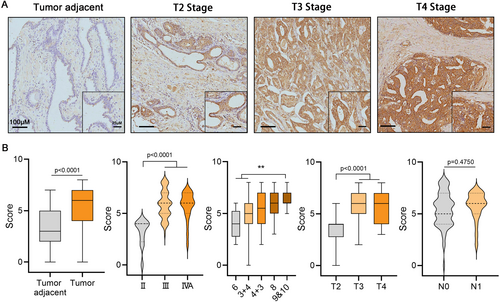
IHC was utilized to validate the expression of PRDX5 in PCa tissues. The staining intensity of PRDX5 in PCa tissues was significantly higher compared to adjacent non-cancerous tissues (Figure 8A,B, p < 0.0001). Moreover, the staining intensity was notably elevated in AJCC stage III and stage IVa compared to stage II (p < 0.0001). Additionally, tissues with Gleason scores of 9&10 exhibited stronger staining intensity compared to those with Gleason scores of 6 and 3 + 4 (p < 0.01). The staining intensity in Gleason score of 4 + 3 or 8 was higher than that in the score of 3 + 4 or 6, though there was no statistical significance. Furthermore, the staining intensity in pathological T stages T3 and T4 was significantly higher than in T2 (p < 0.0001). Although not statistically significant, a trend was observed where the staining intensity in lymph node metastasis stage N1 was higher than in N0.
3.9 Biological Mechanisms Prediction of PRDX5 in PCa
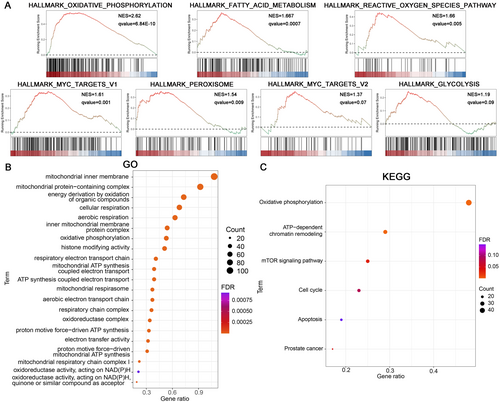
Following the high/low PRDX5 expression level groups were generated in the TCGA-PRAD dataset, the differential expression analysis between groups was performed. GSEA results indicated that the DEGs in the high PRDX5 expression level group were primarily enriched in Oxidative Phosphorylation (NES = 2.62, q < 0.001), Fatty Acid Metabolism (NES = 1.667, q < 0.001), ROS Pathway (NES = 1.66, qvalue = 0.005), Myc Targets V1 (NES = 1.61, qvalue = 0.001), Peroxisome (NES = 1.54, qvalue = 0.009), Myc Targets V2 (NES = 1.37, qvalue = 0.07), Glycolysis (NES = 1.19, qvalue = 0.09) (Figure 9A). GO and KEGG pathway enrichment analysis revealed that the PRDX5 related genes (RGs) were mainly involved in Mitochondria-related functions, Cellular Respiration, and Oxidative phosphorylation (Figure 9B,C).
3.10 Depletion of PRDX5 Induces Apoptosis and Affects the Sensitivity of ARSI Therapy via ROS Accumulation
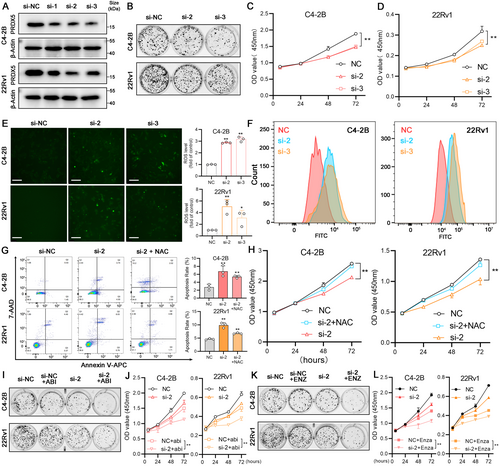
PRDX5 downregulation in 22Rv1 and C4-2B cell lines was successfully achieved and verified by western blotting (Figure 10A, p < 0.05). The second siRNA showed better protein depletion efficacy in both cell lines and followed by the third siRNA (Figure S6B, p < 0.05). We found that downregulating PRDX5 reduced the colony formation ability of both 22Rv1 and C4-2B cells (Figure 10B, Figure S6B, p < 0.05). Moreover, when PRDX5 was downregulated, the growth curves of 22Rv1 and C4-2B cells were inhibited (Figure 10C,D, p < 0.05). As the main function of PRDX5 is to remove excess ROS to maintain the relative stability of the redox state in the cell, we measured ROS levels of two cell lines after interfering with the PRDX5 expression. As shown in Figure 10E, green fluorescence represents the DCFH-DA staining, and we found that the intracellular ROS production enhanced significantly. Similar results can be obtained from flow cytometry experiments (Figure 10F, Figure S6C, p < 0.05). Next, the annexin V-APC/7-AAD double-staining assay showed that the depletion of PRDX5 induced apoptosis in 22Rv1 and C4-2B cells. Meanwhile, these apoptosis alterations were significantly reversed by pretreatment with N-acetylcysteine (NAC), a ROS scavenger (Figure 10G). CCK-8 assays revealed a similar result in the two cell lines (Figure 10H, p < 0.05). Taken together, these results showed that the enhanced ROS levels contribute to the cytotoxicity of PRDX5 depletion in two CRPC cell lines. Moreover, the expression of PRDX5 in CRPC cells also affects the sensitivity to the ARSI therapy. As shown in Figure 10I,J, cells with lower PRDX5 levels exhibited higher sensitivity to abiraterone therapy (Figure S6D, p < 0.05). Similarly, depletion of PRDX5 also enhanced the sensitivity to enzalutamide therapy in 22Rv1 and C4-2B (Figure S6E, p < 0.05), consistent with the result in Figure 7.
4 Discussion
The current primary methods for clinically assessing the aggressiveness of prostate cancer include TNM staging, digital rectal examination (DRE), repeated prostate tissue needle biopsies to determine the Gleason score, and serum PSA testing [45]. However, large amounts of patients still face overtreatment or undertreatment due to insufficient predictive accuracy even after considering all these indicators [46, 47]. Oxidative stress is a hallmark of cancer. Tumorigenesis and progression have been correlated with elevated amounts of ROS and a corresponding upregulation of antioxidant expression. Among the most crucial antioxidants are PRDXs, which are widely distributed across various types of cancer. In this study, we investigated the value of the PRDXs family in the occurrence, progression, prognosis, and treatment response of PCa and predict the potential function of the key character, PRDX5, may participate.
The level of DNA CNAs across the genome, which refers to the fraction of the tumor genome impacted by CNAs, was found to be linked with BCR and post-surgery metastasis in PCa [48]. We found that the PRDXs family exhibits various extents of CNAs in PCa across multiple public databases, with PRDX5 showing the highest frequency of amplification within. The expression analysis in the TCGA transcriptome aligns with this finding, showing that PRDX5 was significantly upregulated in tumors compared to normal tissues, with higher expression levels observed in samples with advanced clinical grades and higher Gleason Score. Combining single-cell transcriptome and IHC both from online and in tissue microarray results, it was discovered that cells exhibiting elevated levels of PRDX5 expression are mainly localized in epithelial cells. This indicates that the raised expression of PRDX5 in prostate cancer epithelial cells plays a pivotal role in the advancement of tumors. This finding aligns with previous observations regarding the antioxidant function of PRDXs family members in tumor cells.
Meanwhile, by integrating results from multiple databases, we found that different PRDXs family members have varying impacts on the prognosis of PCa, with PRDX5 playing the most significant role. Furthermore, PRDX5 has been recognized as a distinct predictive risk factor for PCa. These findings indicated that PRDX5 may have a more prominent involvement in the development of prostate cancer compared to other members of its family. Prior research has observed increased expression levels of PRDX1 in numerous cancer types, including non-small cell lung cancer (NSCLC), ovarian cancer (OC), prostate cancer, colorectal cancer, and gastric cancer [49-52]. Oral squamous cell carcinoma was indicated to have overexpression of PRDX1, PRDX2, and PRDX6 [53-56]. Studies have demonstrated that downregulation of PRDX2 inhibits tumor cell proliferation, migration, and invasion in gastric cancer and colorectal cancer [57, 58]. Moreover, PRDX2 has been shown to promote the progression of prostate cancer by activating the androgen receptor (AR) signaling pathway [59]. Regarding PRDX3, research suggested its association with metastasis and poor survival rates in uveal melanoma [60, 61], and silencing PRDX3 has been found to inhibit liver cancer cell growth and promote invasion [51]. Furthermore, the tumorigenic role of PRDX4 has been confirmed in lung cancer, leukemia, and glioblastoma [20, 62, 63]. PRDX6, the only non-selenocysteine glutathione peroxidase in the PRDXs family, has been implicated in promoting late-stage G2/M arrest in liver cancer cells, inhibiting tumor proliferation in hepatocarcinoma [64]. Additionally, PRDX6 knockout has been shown to suppress the malignant progression of intrahepatic cholangiocarcinoma [65]. On the basis of these past studies, our research innovatively compared the prognostic impact of all six family members in prostate cancer and found that PRDX5 has the strongest predictive value for poor prognosis in PCa patients and is most closely associated with adverse outcomes. After validation by in vitro experiments, we found that depletion of PRDX5 induces apoptosis and regulates the sensitivity of ARSI therapy via ROS accumulation.
PRDX5 is an atypical 2-Cys antioxidant with broad substrate specificity, capable of counteracting endogenous and exogenous peroxides, including H2O2, alkyl hydroperoxides, and peroxynitrite [66, 67]. It is widely distributed in cells. Since mitochondria and peroxisomes are the main sources of ROS/reactive nitrogen species within cells, recent studies have highlighted the upregulation of PRDX5 in various tumor tissues, enhancing tumorigenic phenotypes and metastatic potential [68]. Studies have shown that PRDX5 protects gastric cancer cells from apoptosis by reducing intracellular ROS accumulation, thus promoting their proliferation and invasiveness [69, 70]. In xenograft mouse models, PRDX5 overexpression has been shown to promote tumor growth of colorectal cancer cells [71]. Moreover, PRDX5 has been found to play a tumor-promoting role in thyroid cancer [72]. Research on PRDX5 in PCa is limited, and its mechanisms in this context are not well understood. Previous work has demonstrated that the expression of PRDX5 in PC-3 cells, a type of human prostate cancer, notably rises when exposed to oxidative stress [73]. Recent studies have shown that PRDX5 promotes resistance to AR inhibitors and the development of castration-resistant prostate cancer (CRPC). Specifically, inhibiting PRDX5 can suppress DTP cell proliferation in culture, hinder CRPC progression in animal models, and stabilize PSA progression and metastatic lesions in patients, indicating that PRDX5 could be a therapeutic target for treatment-resistant prostate cancer [74]. This aligns with our findings on promoting prostate cancer progression and regulating the ARSI therapy response.
GSEA and pathway enrichment analysis indicated that high PRDX5 expression is often accompanied by the enrichment of certain pathways, including mitochondria-related functions, cellular respiration, fatty acid metabolism, ROS pathway, Myc Targets, peroxisome, and glycolysis. Elevated ROS levels have been shown to trigger apoptosis through various downstream pathways, with mitochondrial dysfunction being the most critical [75]. On the contrary, energy metabolism processes related to oxidative phosphorylation and the tricarboxylic acid (TCA) cycle will be altered. The TCA cycle provides intermediates for the production of lipids, proteins, and nucleotides [76]. ROS mainly mediates signal processes, crosstalk with metabolism, tumor microenvironment, and immune functions in cancer [77]. Integrating with the bioinformatics analysis, high expression of PRDX5 may enhance energy supply for tumor cells, thereby promoting cell cycle progression, which indicates that the metabolism impact of ROS or PRDXs family in PCa may merit further investigation.
In an effort to conduct a more thorough examination of the medical importance of PRDX5, a nomogram was created using PRDX5 and clinical characteristics. The calibration curves for 3-year and 5-year survival predictions closely approximated the ideal values. The AUC values for the 3-year and 5-year nomograms were greater than the AUC values for each individual clinical predictor. Therefore, our novel nomogram can provide clinical assistance based on the individual characteristics of PCa patients. Comparing with published 30 signatures associated with various biological features, the PRDX5-Nomo model showed good predictive power for BCR in clinical patients. In addition, our model merely needs one expression of gene, which is easier to assist clinicians than the rest of the polygenic models. Except for predicting prognosis, PRDX5 can also distinguish molecular subtypes and predict drug response in PCa. Notable among primary tumor classification systems is the predictive analysis of microarrays 50 (PAM50) gene panel developed from large-scale transcriptome assessments of breast cancer [78]. Given that prostate and breast cancer are both hormonally driven tumors and share many oncogenic pathways, PAM50 was proved to identify luminal and basal-like subtypes in prostate cancer and these subtypes could differ in clinical outcomes and treatment response [38]. Additionally, PRDX5 exhibited a negative correlation with sensitivity to Pevonedistat, Gemcitabine, suggesting that it could be a novel option for PCa patients with high levels of PRDX5.
5 Conclusion
In conclusion, this study offers new evidence for determining that the expression of PRDX5 is associated with advanced tumor grade, poor prognosis, and the suboptimal response to multiple therapies in PCa within the PRDXs family. The expression of PRDX5 and the Gleason score and pathologic T stage of PCa patients were included to construct a nomogram to improve the current BCR prediction clinically. Combining the bioinformatics and in vitro experiment results, PRDX5 induces apoptosis and affects the sensitivity of ARSI therapy via ROS accumulation in CRPC. Last but not least, our study provides new insights into precision medicine in PCa and provides a reference for further research on PRDX5.
Author Contributions
Shan Tang: funding acquisition, project administration, conceptualization. Jinchuang Li: data curation, formal analysis. Weicheng Tian: formal analysis. Yuanfa Feng: validation. Yulin Deng: validation. Zeheng Tan: validation. Zhaodong Han: data curation, visualization. Huichan He: investigation, visualization, validation, data curation. Yongding Wu: data curation, visualization. Chuyang Huang: investigation, resources. Keping Ning: investigation, resources. Feng Liu: data curation, visualization. Hongwei Luo: writing – original draft, funding acquisition, methodology. Shanghua Cai: writing – review and editing, formal analysis. Jianheng Ye: writing – original draft, funding acquisition, methodology. Weide Zhong: writing – review and editing, funding acquisition, conceptualization, supervision.
Acknowledgments
We all authors sincerely acknowledge the contributions from the TCGA and GEO projects.
Consent
The authors have nothing to report.
Conflicts of Interest
The authors declare no conflicts of interest.
Open Research
Data Availability Statement
RNA-sequencing data from 100 normal prostate tissue samples were retrieved from the Genotype-Tissue Expression (GTEx, https://gtexportal.org/). Seven independent public datasets (including TCGA, CancerMap (GSE94767), DKFZ, GSE54460, GSE70769, Cambridge (GSE70768) and GSE116918) were accessed from The Cancer Genome Atlas (TCGA, http://portal.gdc.cancer.gov/) and Gene Expression Omnibus (GEO, https://www.ncbi.nlm.nih.gov/geo/). Single-cell sequencing analysis data were obtained from the sequencing results of GSE157703 and GSE141445 in GEO. Information on 545 drugs from the Cancer Therapeutics Response Portal (CTRP) database and 198 drugs from the Genomics of Drug Sensitivity in Cancer (GDSC) database was retrieved. Furthermore, data pertaining to androgen receptor signaling inhibitor (ARSI) therapy cohorts were obtained from Github (https://github.com/cBioPortal/datahub/tree/master/public/prad_su2c_2019). To further validate the predictive performance of PRDX5-Nomo signature, the C-indexes and hazard ratios (HR) of 30 gene expression prognostic signatures trained with the robust Cox-Ridge algorithm were downloaded from the PCaDB database (http://bioinfo.jialab-ucr.org/PCaDB/).


