Integrated analysis of long noncoding RNA interactions reveals the potential role in progression of human papillary thyroid cancer
Abstract
Recent scientific evidence has suggested that long noncoding RNAs (lncRNAs) play an important part in tumorigenesis as an important member of competing endogenous RNAs (ceRNAs). Hundreds of RNA sequence data and relevant clinic information are freely accessible in The Cancer Genome Atlas (TCGA) datasets. However, the role of cancer-related lncRNAs in papillary thyroid cancer (PTC) is not fully understood yet. In this study, we identified 461 RNA sequencing data from TCGA. Subsequently, 45 lncRNAs, 21 miRNAs, and 78 mRNAs were chosen to construct a ceRNA network of PTC. Then, we analyzed the correlation between these 45 PTC-specific lncRNAs and clinic features and patient outcome. Thirty-seven of these lncRNAs were found to be closely related to age, race, gender, lymph node metastasis, TNM staging system, and patient outcome. Additionally, three of them were linked to PTC patient overall survival. Eventually, we selected eight lncRNAs randomly and performed quantificational real-time polymerase chain reaction (qRT-PCR) in 28 newly diagnosed patients with PTC to verify the reliability of the above results. The results of qRT-PCR are totally in agreement with the bioinformatics analysis. Additionally, it was found that HAND2-AS1 was negatively related to tumor size (P < 0.05). The results were consistent with the bioinformatics analysis in TCGA. Taken together, we identified the differentially expressed lncRNAs and constructed a PTC ceRNA network. The study provides a new perspective and supplement for our understanding of lncRNAs in PTC development and reveals potential diagnostic and prognostic markers in PTC.
1 INTRODUCTION
Thyroid cancer remains the most prevalent malignant endocrine disorder with low mortality but increased incidence and recurrence. According to the United States cancer statistics, approximately 726 646 people lived with thyroid cancer in 2014, and there would be 56 870 new cases diagnosed as thyroid cancer in 2017.1 Moreover, by 2030, thyroid cancer was expected to be the fourth leading cancer diagnosis.2 Papillary thyroid cancer (PTC) is the most common pathological type, accounting for 80% of thyroid cancer. In the long run, the prognosis of PTC is excellent and the 5-year survival rate could reach 98.2%; however, its recurrence rate is relatively high.3, 4 On the other hand, anaplastic thyroid cancer (ATC) is less frequent even if it has more aggressive biological behavior and worse prognosis. Recent studies showed that genetic and epigenetic alterations were involved in PTC pathogenesis and could be markers for prognosis, such as BRAF mutations,5-7 RAS mutations,8, 9 and RET rearrangements.10, 11
LncRNAs are described as transcripts with longer than 200 nucleotides without translation function. It plays an essential part in the regulation of gene transcription, post-transcription, and epigenetic modulation.12-14 Amounting evidence indicate that lncRNAs are crucial in oncogenesis and tumor development.15-17 It was also found that plenty of lncRNAs was differentially expressed in thyroid cancer compared with normal adjacent tissues. These lncRNAs were expected to be correlated with diagnosis and prognosis of PTC.18
The competing endogenous RNA (ceRNA) hypothesis was first proposed about how messenger RNAs (mRNAs), transcribed pseudogenes, and lncRNAs connect to each other using microRNA response elements (MREs).19 Recently, ceRNA hypothesis was proved to be essential in physiologic and pathological conditions such as cancer.20
Thousands of lncRNAs were found aberrantly expressed in PTC samples compared with normal thyroid tissues using genomewide analysis.21 With further research, more and more lncRNAs were found to be closely related to the initiation and development of PTC. For instance, 218 aberrantly expressed lncRNAs were identified in genomewide expression screening, and two lncRNAs (XLOC-051122 and XLOC-006074) were found significantly related to lymphatic metastasis.22 Another study performed by Li et al23 described four lncRNAs signature (RP11-536N17.1, RP11-508M8.1, AC026150.8, and CTD-2139B15.2) predicting PTC prognosis. Differentially expressed RNAs in 348 cases were identified in three PTC variants and were selected to construct the ceRNA network by Yanjing Zhao.24 However, the ceRNA network of PTC is still poorly investigated in a larger cohort, and the validation analysis needs to be performed. In this study, dysregulated RNAs (including lncRNAs, miRNAs, and mRNAs) were detected in different stages and lymph node status, and these RNAs were used to construct the ceRNA network of PTC. Next, quantificational real-time polymerase chain reaction (qRT-PCR) validation was performed to confirm the credibility of bioinformatics analysis results. GO terms and KEGG pathways were performed to identify the differentially expressed mRNAs. Our results indicate that ceRNA network plays an important part in the development of PTC, and the study also provides a novel perspective for the better understanding of lncRNA-miRNA-mRNA interactions in PTC initiation and development.
2 MATERIALS AND DESIGN
2.1 Patients and samples
Our study was granted approval by the ethics committee of Nanjing Drum Tower Hospital. Firstly, we collected 503 PTC cases and 59 normal thyroid cases from the The Cancer Genome Atlas (TCGA) database (https://cancergenome.nih.gov/). Then, we set the exclusion criteria as below: (a) pathologic diagnosis is not PTC; (b) suffering from other cancers except PTC; (c) patients samples without integrated clinical information. Overall, 461 PTC tumor cases and 55 normal thyroid cases were identified in the study. On the basis of the 7th American Joint Committee on Cancer (AJCC) TNM staging system, among these 461 patients with PTC, there were 256 patients with stage I PTC, 51 patients with stage II PTC, 104 patients with stage III PTC, and 50 patients with stage IV PTC. Additionally, there are 219 PTC cases with lymphatic metastasis and 242 PTC cases without lymphatic metastasis.
Additionally, 28 paired frozen PTC samples (thyroid tumor samples and adjacent normal thyroid samples) were obtained from Nanjing Drum Tower Hospital for qRT-PCR. Tissues were immersed in RNAlater (GenStar BioSolutions, Beijing, China) immediately after surgical resection and stored at −80°C until use. Pathology reports and quality assessment reports were required to verify the collected tumor tissues and normal thyroid tissues. Demographic and clinical features of these patients were shown in Table 1. Informed consent agreements were signed by all patients in this study.
| Parameters | Cohort (n = 28) % |
|---|---|
| Age (mean ± SD) | 39.8 ± 9.8 |
| Gender | |
| Female | 20 (71.4) |
| Male | 8 (28.6) |
| Pathologic staging | |
| I-II | 22 (78.6) |
| III-IV | 6 (21.4) |
| Tumor size | |
| T1-T2 | 17 (60.7) |
| T3-T4 | 11 (39.3) |
| Lymph node | |
| N0 | 10 (35.7) |
| N1 | 18 (64.3) |
| Metastasis | |
| M0 | 28 (100) |
| M1 | 0 (0) |
2.2 RNA sequence data analysis
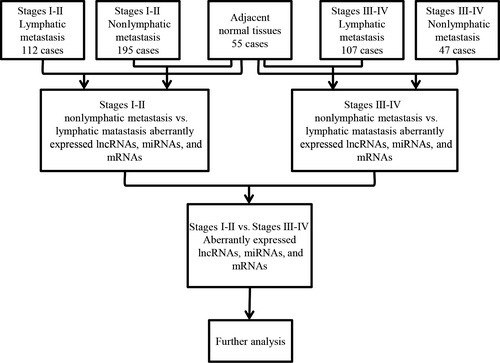
Firstly, we obtained all RNA expression profiles (level 3) of patients with PTC from the TCGA data portal (up to May 05, 2016). The raw data of lncRNAs and mRNAs were processed and normalized by TCGA RNASeqv2 system. The PTC level 3 miRNA data were normalized and provided by Illumina HiSeq 2000 microRNA sequencing platforms (Illumina Inc., Hayward, CA, USA). No further normalization was needed as all the RNA sequencing data have already been normalized already. Then, all samples collected in TCGA were divided into three groups to perform the differential analysis of lncRNAs, miRNAs, and mRNAs. Thus, all collected samples were grouped as: (a) PTC tumor samples and normal thyroid samples; (b) PTC samples with lymphatic metastasis and PTC samples without lymphatic metastasis; (c) PTC samples with stages I-II and PTC samples with stages III-IV. Four groups were listed as follows: stages I-II with/without lymphatic metastasis and stages III-IV with/without lymphatic metastasis, and these groups contained 112, 195, 107, and 47 cases, respectively. The intersected lncRNAs, miRNAs, and mRNAs were then chosen to construct the ceRNA network which shows the genetic regulation related to PTC. The bioinformatics analysis is illustrated in the flowchart (Figure 1).
2.3 Gene functional enrichment analysis
The intersected mRNAs were selected following the above methods and were analyzed to detect the potential biologic functions and pathways. The Database for Annotation, Visualization, and Integrated Discovery (DAVID) Bioinformatics resources (http://david.abcc.ncifcrf.gov/) were employed to analyze the potential functions and pathways. The biological functions and pathways were considered significant when an enrichment score of Gene Ontology (GO) and Kyoto Encyclopedia of Genes and Genomes (KEGG) analysis exceeds 1.5 (P < 0.05).
2.4 The ceRNA network in PTC
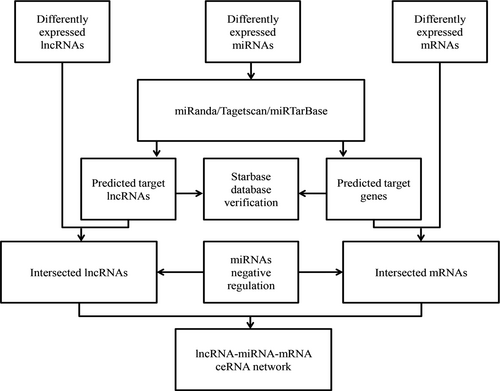
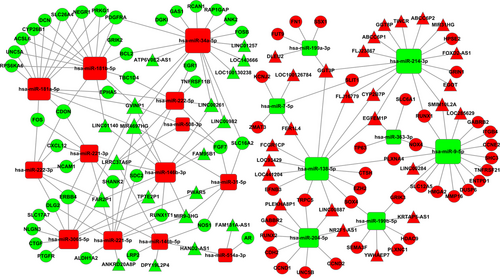
The interactions among lncRNAs, miRNAs, and mRNAs contribute to the post-transcriptional regulation of mRNAs. The ceRNA network is built based on miRNA sponge25 in our study. This theory indicates that lncRNAs conjunct with miRNAs to regulate mRNAs expression. Furthermore, the miRNA-lncRNA and miRNA-mRNA relationships were collected in the starBase v2.0 database (http://starbase.sysu.edu.cn/),26 and only differentially expressed intersection lncRNAs, miRNAs, and mRNAs with fold change (FC) >2.0 or FC <0.5 and P < 0.05 were selected. Subsequently, miRanda tools (http://www.microrna.org/microrna/home.do), the miRNAs target prediction tool, were employed to detect the lncRNA-miRNA interactions. Then, the mRNA-miRNA interactions were analyzed by miRTarBase (http://mirtarbase.mbc.nctu.edu.tw/) and TargetScan (http://www.targetscan.org/). The summary results were identified to determine the specific interacted lncRNAs and mRNAs. Then, according to ceRNA theory, the negatively regulated lncRNA-miRNA and mRNA-miRNA pairs were analyzed in the ceRNA network in PTC.27 Finally, the ceRNA network was built using Cytoscape v3.0.28 The ceRNA network construction is illustrated in a flowchart (Figure 2).
2.5 Clinical features analysis and qRT-PCR verification
Specific lncRNAs involved in ceRNA network and bioinformatics analysis were selected to assess the clinical characteristics including age, race, gender, lymphatic metastasis, TNM staging system, and patient outcome in TCGA. In addition, qRT-PCR validation of eight randomly selected lncRNAs in 28 paired frozen tissues was performed to examine the credibility of the bioinformatics analysis results.
Following the manufacturer's protocol, total RNAs were extracted and purified using TRIzol reagent (Pufei, Shanghai, China). Then, concentration and purity of total RNA were detected by the spectrophotometer from BioTek (Shoreline, WA, USA). According to the manufacturer's protocol, a total of 1000 ng RNA was used to perform cDNA synthesis, and reverse transcription reaction was conducted using PrimeScript™ from Takara (Dalian, China). Candidate lncRNA expression was amplified with TAKARA SYBR® Premix Ex Taq™ (Dalian, China) on an Applied Biosystems ViiA™ 7 System (Foster City, CA, USA) using specific primers in duplicate. All primers were designed and synthesized by Generay Biotech (Shanghai, China), and the sequences of selected lncRNAs primers were presented in Table 2. qPCR primers were determined to anneal at 60°C according to the instructions. The comparative CT method was used to measure the relative expression of candidate lncRNAs.29 β-actin is used as the internal control in our experiment. FC values were shown as 2−∆∆Ct, where ∆∆Ct = (CtRNAs − Ctβ-actin)tumor − (CtRNAs − Ctβ-actin)adjacent normal samples.
| Forward primer (5′→3′) | Reverse primer (5′→3′) | |
|---|---|---|
| β-ACTIN | CTACCTCATGAAGATCCTCACCGA | TTCTCCTTAATGTCACGCACGATT |
| LOC100130238 | CAAAACGAAACCCCTTACTGC | ATCCCCTAGATCAAGCCATGC |
| HAND2-AS1 | GGAGTCACAGGCAGTCGTAGA | GAAGGCACAGATCATTCATGG |
| MIR9-3HG | CTCTGCCCTCCTACTTACGCT | CTGCTGGTCATCTGCATTCCT |
| LOC143666 | CTCCCTGTGGTGCTTGAATGA | TCTACCGCTATCTACTACGAACTT |
| EGFEM1P | AATTGAGACACTGGAAGGTGAT | TTGAGTAGCGGTTGATTTGGT |
| LINC00284 | AGGTTTCCCTCCTTGGCTTAC | TCACATCAGGTCCTTTGCTCC |
| TINCR | CCACTGTCATCTCCCCTCTTT | TCTCCCTCCCTATCTTCCATT |
| ABCC6P1 | TACAGAAACTGCCAGGTCAAG | AGAAGACAGAGGAGCAGACAAA |
2.6 Statistical analysis
The Student's t test was performed to detect the statistical significance for two groups, and ANOVA for multiple groups using the GraphPad Prism 6.0. All data are expressed as mean ± SD (standard deviation). The threshold of false discovery rate (FDR) was set as 0.001 to reduce the false positives in multiple tests in bioinformatics analysis, and the threshold of P value was set as 0.05 to evaluate the null hypothesis. Box plots were used to present the FC and clinical relevance of the specific lncRNAs in donor samples. The upper and lower boundaries of the boxplots are at 25th and 75th percentiles. The vertical lines below and above the box represent the minimum and the maximum. And the band inside the box is always the median.
3 RESULTS
3.1 PTC-specific lncRNAs
Totally, 1806 lncRNAs were identified from TCGA database (Data S1). We compared the expression of lncRNAs in 461 patients with PTC tumor tissues with adjacent normal tissues and identified 199 differentially expressed lncRNAs (FC > 2, P < 0.01). Further analysis was carried out between tumor tissues and adjacent normal thyroid tissues on tumor stages and lymph node status. For patients without lymphatic metastasis, there are 99 aberrant expression lncRNAs between stages I-II PTC tumors samples and normal thyroid samples, and 122 aberrant expression lncRNAs between stages III-IV PTC tumors samples and normal thyroid samples. For patients with lymphatic metastasis, 160 aberrant expression lncRNAs were identified between stages I-II PTC tumors samples and normal thyroid samples, and 177 aberrant expression lncRNAs were identified between stages III-IV PTC tumors samples and normal thyroid samples (Figure 3A). The intersected 83 specific intersected lncRNAs were selected initially for further analysis on ceRNA network to improve the credibility of bioinformatics analysis results (Table 3).

| lncRNAs | Gene ID | Regulation | Average FC |
|---|---|---|---|
| LOC400794 | 400794 | Up | 55.465 |
| RPSAP52 | 204010 | Up | 15.625 |
| TINCR | 257000 | Up | 11.360 |
| ABCC6P1 | 653190 | Up | 8.105 |
| PRSS3P2 | 154754 | Up | 7.165 |
| EGFEM1P | 93 56 | Up | 6.810 |
| NR2F1-AS1 | 441094 | Up | 6.600 |
| FLJ16779 | 100192386 | Up | 6.365 |
| MIR31HG | 554202 | Up | 6.095 |
| MIR924HG | 647946 | Up | 5.490 |
| LINC00284 | 121838 | Up | 5.455 |
| ABHD11-AS1 | 171022 | Up | 5.190 |
| FBLL1 | 345630 | Up | 4.650 |
| CYP1B1-AS1 | 285154 | Up | 4.585 |
| LOC100126784 | 100126784 | Up | 4.585 |
| FLJ23867 | 200058 | Up | 4.290 |
| LINC00887 | 100131551 | Up | 4.130 |
| YWHAEP7 | 284100 | Up | 4.060 |
| SFTA1P | 207107 | Up | 3.955 |
| LOC93429 | 93429 | Up | 3.935 |
| LOC441204 | 441204 | Up | 3.865 |
| FER1L4 | 80307 | Up | 3.860 |
| HCG22 | 285834 | Up | 3.595 |
| GGT8P | 645367 | Up | 3.465 |
| FOXD2-AS1 | 84793 | Up | 3.340 |
| PP14571 | 100130449 | Up | 3.260 |
| EGOT | 100126791 | Up | 3.255 |
| ABCC6P2 | 730013 | Up | 3.035 |
| LBX2-AS1 | 151534 | Up | 2.880 |
| FCGR1CP | 100132417 | Up | 2.760 |
| SMIM10L2A | 399668 | Up | 2.740 |
| GGT3P | 2679 | Up | 2.725 |
| KRTAP5-AS1 | 338651 | Up | 2.590 |
| LINC00152 | 112597 | Up | 2.575 |
| CYP2B7P | 1556 | Up | 2.450 |
| DLEU2 | 8847 | Up | 2.345 |
| LOC285629 | 285629 | Up | 2.255 |
| MBL1P | 8512 | Up | 2.240 |
| ESPNP | 284729 | Up | 2.210 |
| LINC01366 | 257358 | Up | 2.150 |
| PLEKHA8P1 | 51054 | Up | 2.125 |
| AADACP1 | 201651 | Down | −11.976 |
| LINC00473 | 90632 | Down | −11.236 |
| SLC26A4-AS1 | 286002 | Down | −10.582 |
| TPTE2P1 | 646405 | Down | −10.363 |
| LOC100130238 | 100130238 | Down | −10.152 |
| FAM167A-AS1 | 83656 | Down | −7.143 |
| LINC01139 | 339535 | Down | −7.143 |
| TDH | 157739 | Down | −5.128 |
| HAND2-AS1 | 79804 | Down | −5.000 |
| LINC00092 | 100188953 | Down | −4.762 |
| LINC01257 | 116437 | Down | −4.444 |
| VLDLR-AS1 | 401491 | Down | −4.348 |
| LOC143666 | 143666 | Down | −4.348 |
| DPY19L2P4 | 442523 | Down | −4.167 |
| MIR9-3HG | 254559 | Down | −4.082 |
| LINC00982 | 440556 | Down | −4.082 |
| B3GALT5-AS1 | 114041 | Down | −3.846 |
| LINC01550 | 388011 | Down | −3.774 |
| GOLGA8IP | 283796 | Down | −3.571 |
| LINC00602 | 441177 | Down | −3.509 |
| MIR4697HG | 283174 | Down | −3.448 |
| FAM181A-AS1 | 283592 | Down | −3.448 |
| ANKRD20A8P | 729171 | Down | −3.390 |
| ATP6V0E2-AS1 | 401431 | Down | −3.279 |
| FAM95B1 | 100133036 | Down | −3.125 |
| LINC00652 | 29075 | Down | −3.030 |
| SNORD116-4 | 100033416 | Down | −3.030 |
| ST7-AS1 | 93653 | Down | −2.817 |
| LINC01140 | 339524 | Down | −2.817 |
| TERC | 7012 | Down | −2.778 |
| PWAR5 | 8123 | Down | −2.778 |
| LINC01126 | 100129726 | Down | −2.740 |
| MIR22HG | 84981 | Down | −2.667 |
| ZNF826P | 664701 | Down | −2.667 |
| LRRC37A6P | 387646 | Down | −2.632 |
| PGM5-AS1 | 572558 | Down | −2.632 |
| LINC00261 | 140828 | Down | −2.597 |
| LINC00936 | 338758 | Down | −2.597 |
| FAR2P1 | 440905 | Down | −2.597 |
| AGPAT4-IT1 | 79992 | Down | −2.532 |
| SNORD116-20 | 100033431 | Down | −2.532 |
| GVINP1 | 387751 | Down | −2.353 |
- 83 PTC-specific lncRNAs for ceRNA network construction with absolute fold change (FC) >2.0, P < 0.05. I, II, III, and IV, TNM stages I, II, III, and IV. Lym, lymph node metastasis; nLM, nonlymph node metastasis; normal represents adjacent nontumor thyroid tissues.
3.2 Functional enrichment analysis
DAVID bioinformatics resources were employed to predict the biological functions and pathways of aberrantly expressed intersection mRNAs. A total of 18 633 mRNAs was identified from TCGA database, and 3531 mRNAs were aberrantly expressed in PTC tumor samples compared with normal thyroid samples (FC >2, P < 0.01). For patients without lymphatic metastasis, 2209 aberrant expression mRNAs were identified between stages I-II PTC tumors samples and normal thyroid samples, and 2457 aberrant expression mRNAs were identified between stages III-IV PTC tumors samples and normal thyroid samples. For patients with lymphatic metastasis, 2903 aberrant expression mRNAs were identified between stages I-II PTC tumors samples and normal thyroid samples, and 3128 aberrant expression mRNAs were identified between stages III-IV PTC tumors samples and normal thyroid samples. Finally, we identified 1822 mRNAs from the intersection of the four groups for further functional analysis.
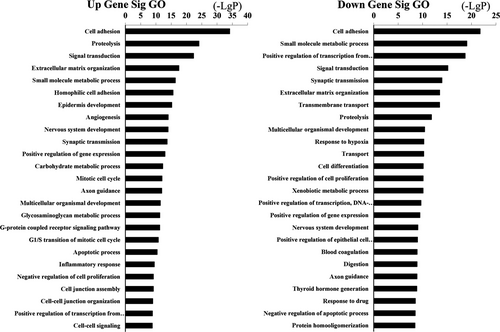
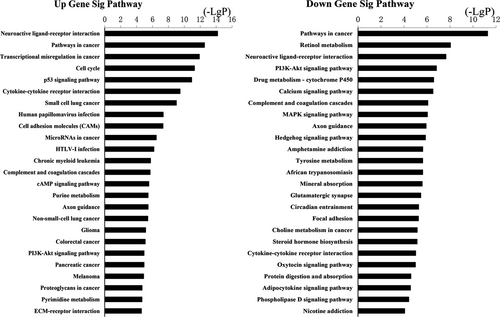
The upregulation and downregulation of these intersected mRNAs were further analyzed, respectively. GO analysis revealed 531 biological processes corresponding to these upregulated genes and 692 biological processes corresponding to these downregulated genes. Cell adhesion (GO:0007155) was the most enriched function for both upregulation and downregulation transcripts (Figure 4). KEGG pathway indicated 100 pathways matching with upregulated genes, and the top pathway was neuroactive ligand-receptor interaction. Furthermore, pathway analysis showed 101 pathways matching with downregulated genes and the top pathway was pathways in cancer (Figure 5). Among these pathways, “MAPK signaling pathway” has already been demonstrated as the main cause of genetic alterations and PTC development. Targeting “MAPK signaling pathway” has shown an effective antitumor effect in preclinical studies and ongoing clinical trials.30
3.3 Prediction of miRNAs targets and construction of ceRNA network
A total of 1030 miRNAs were obtained from TCGA database to identify potential differentially expressed miRNAs. And it was found that 87 miRNAs were aberrantly expressed in PTC tumor samples compared with normal thyroid samples (FC > 2, P < 0.05). According to the comparisons of four groups described above, 36 miRNAs were selected from the intersections of 87 PTC-associated miRNAs to build the ceRNA network. Consequently, miRNAs target prediction including lncRNAs and mRNAs were conducted following the instructions described above. Firstly, 83 intersected lncRNAs and 36 specific miRNAs were collected to analyze the potential relationship in PTC. The potential miRNA-lncRNA interactions were predicted using StarBase v2.0 which could explore the candidate MREs. Finally, according to the analysis results, there were 29 specific miRNAs interacting with 54 specific lncRNAs (Table 4).
| lncRNAs | miRNAs |
|---|---|
| ABCC6P1 | hsa-miR-214-3p |
| ABCC6P2 | hsa-miR-214-3p |
| ABHD11-AS1 | hsa-miR-34a-5p |
| AGPAT4-IT1 | hsa-miR-214-3p |
| ANKRD20A8P | hsa-miR-221-5p, hsa-miR-9-5p |
| ATP6V0E2-AS1 | hsa-miR-204-5p, hsa-miR-34a-5p, hsa-miR-9-5p |
| CDC14C | hsa-miR-9-5p |
| CYP2B7P | hsa-miR-138-5p, hsa-miR-214-3p |
| DLEU2 | hsa-miR-187-3p, hsa-miR-199a-3p |
| DPY19L2P4 | hsa-miR-146b-5p |
| EGFEM1P | hsa-miR-138-5p, hsa-miR-181a-5p, hsa-miR-181b-5p, hsa-miR-214-3p, hsa-miR-222-5p, hsa-miR-363-3p, hsa-miR-509-3p |
| EGOT | hsa-miR-214-3p |
| FAM181A-AS1 | hsa-miR-138-5p, hsa-miR-514a-3p |
| FAM95B1 | hsa-miR-146b-3p |
| FAR2P1 | hsa-miR-138-5p, hsa-miR-146b-3p, hsa-miR-199a-3p, hsa-miR-214-3p, hsa-miR-221-3p, hsa-miR-221-5p, hsa-miR-222-3p, hsa-miR-3065-5p |
| FCGR1CP | hsa-miR-138-5p |
| FER1L4 | hsa-miR-138-5p, hsa-miR-146b-3p, hsa-miR-187-3p, hsa-miR-34a-5p, hsa-miR-7-5p |
| FLJ16779 | hsa-miR-138-5p, hsa-miR-181a-2-3p, hsa-miR-187-3p, hsa-miR-214-3p, hsa-miR-221-5p, |
| FLJ23867 | hsa-miR-214-3p |
| FOXD2-AS1 | hsa-miR-214-3p |
| GGT3P | hsa-miR-138-5p, hsa-miR-199a-3p, hsa-miR-214-3p |
| GGT8P | hsa-miR-214-3p |
| GVINP1 | hsa-miR-144-5p, hsa-miR-146b-3p, hsa-miR-181a-5p, hsa-miR-181b-5p, hsa-miR-199a-3p, hsa-miR-204-5p, hsa-miR-214-3p, hsa-miR-3065-5p, hsa-miR-34a-5p, hsa-miR-508-3p, hsa-miR-7-5p, hsa-miR-9-5p |
| HAND2-AS1 | hsa-miR-138-5p, hsa-miR-144-5p, hsa-miR-146b-5p, hsa-miR-204-5p, hsa-miR-509-3p, hsa-miR-514a-3p |
| KRTAP5-AS1 | hsa-miR-146b-3p, hsa-miR-199b-5p |
| LBX2-AS1 | hsa-miR-675-3p |
| LINC00261 | hsa-miR-138-5p, hsa-miR-146b-3p, hsa-miR-204-5p, hsa-miR-222-5p, hsa-miR-34a-5p, hsa-miR-9-5p |
| LINC00284 | hsa-miR-9-5p |
| LINC00652 | hsa-miR-214-3p |
| LINC00887 | hsa-miR-138-5p, hsa-miR-181b-5p, hsa-miR-204-5p |
| LINC00982 | hsa-miR-146b-3p, hsa-miR-34a-5p, hsa-miR-9-5p |
| LINC01140 | hsa-miR-138-5p, hsa-miR-146b-3p, hsa-miR-181b-5p, hsa-miR-204-5p, hsa-miR-214-3p |
| LINC01257 | hsa-miR-34a-5p |
| LINC01366 | hsa-miR-34a-5p |
| LINC01550 | hsa-miR-675-3p |
| LOC100126784 | hsa-miR-1247-5p, hsa-miR-34a-5p, hsa-miR-451a, hsa-miR-7-5p |
| LOC100130238 | hsa-miR-34a-5p |
| LOC143666 | hsa-miR-34a-5p |
| LOC285629 | hsa-miR-146b-3p, hsa-miR-31-5p, hsa-miR-9-5p |
| LOC441204 | hsa-miR-138-5p |
| LOC93429 | hsa-miR-138-5p |
| LRRC37A6P | hsa-miR-146b-3p, hsa-miR-146b-5p, hsa-miR-187-3p, hsa-miR-199a-3p, hsa-miR-221-3p, hsa-miR-222-5p, hsa-miR-508-3p |
| MIR31HG | hsa-miR-214-3p |
| MIR4697HG | hsa-miR-146b-3p, hsa-miR-181a-5p, hsa-miR-204-5p, hsa-miR-221-5p, hsa-miR-31-5p, hsa-miR-34a-5p, hsa-miR-486-5p, hsa-miR-7-5p |
| MIR9-3HG | hsa-miR-146b-3p, hsa-miR-214-3p, hsa-miR-221-5p, hsa-miR-31-5p |
| NR2F1-AS1 | hsa-miR-199b-5p, hsa-miR-204-5p, |
| PLEKHA8P1 | hsa-miR-204-5p |
| PRSS3P2 | hsa-miR-34a-5p |
| PWAR5 | hsa-miR-3065-5p, hsa-miR-31-5p |
| RPSAP52 | hsa-miR-222-5p |
| SMIM10L2A | hsa-miR-146b-3p, hsa-miR-187-3p, hsa-miR-214-3p, hsa-miR-221-5p, hsa-miR-34a-5p, hsa-miR-9-5p |
| TINCR | hsa-miR-1247-5p, hsa-miR-214-3p |
| TPTE2P1 | hsa-miR-146b-3p, hsa-miR-199b-5p, hsa-miR-214-3p, hsa-miR-3065-5p, hsa-miR-7-5p, hsa-miR-9-5p |
| YWHAEP7 | hsa-miR-199b-5p |
In the further analysis, the miRNA-targeted mRNAs were predicted using TargetScan and miRTarBase. It was found that 30 miRNAs interacted with 130 mRNAs (Table 5). Then, we built a ceRNA network based on the above results (Tables 4 and 5). Cytoscape 3.0 was performed to depict the ceRNA network (Figure 6). The ceRNA network contains 45 lncRNAs, 21 miRNAs, and 78 mRNAs finally.
| miRNAs | mRNAs |
|---|---|
| hsa-miR-1179 | HDAC4, NCAM1, NRCAM, RUNX1, RUNX1T1, SGCD |
| hsa-miR-138-1-3p | CCND1, CCND2, EFNB3, ENPP1, FUT9, GPR83 |
| hsa-miR-138-5p | CTSH, EFNB3, ERBB4, EZH2, PLXNA4, PPARGC1A, RELN, SHANK2, SLC16A2, SLC17A7, SOX4, TCF7L1, TRPC5, UNC5A |
| hsa-miR-144-3p | ERBB4, FGF7, FOSB, GABRB2, IRS1, ITPR1, LRP2, PLXNC1, RARB, SMAD9 |
| hsa-miR-146b-3p | CCND2, NRCAM, PPP1R1B, RUNX1T1, ERBB4, LRP2, MMP16, NOS1 |
| hsa-miR-181a-2-3p | EFNB3, ERBB4, GLS2, HPSE2, OPRK1, SLC17A7 |
| hsa-miR-181a-5p | ACSL6, CDON, CYP26B1, DCN, EPHA5, FOS, NEGR1, PDGFRA, PRKG1, RPS6KA6, SHC3, SIPA1L2, SLC12A5, SLC26A4, TGFBR1, UNC5A |
| hsa-miR-181b-5p | ACSL6, BCL2, CDON, CYP26B1, DCN, GRIK2, GRIK3, HEY2, NEGR1, PDE5A, PDGFRA, PLAU, PRKG1, RPS6KA6, SHC3, SIPA1L2, SLC26A4, TBC1D4, TGFBR1, UNC5A |
| hsa-miR-199a-3p | DIO2, ERBB4, FN1, FUT9, RPS6KA6, SSX1 |
| hsa-miR-199b-5p | ERBB4, GRIK3, HDAC9, PLXNC1, PPARGC1A, RUNX1T1, SEMA3F, SGCD, SOX4 |
| hsa-miR-204-5p | AGPAT4, BCL2, CCND1, CCND2, CDH2, EPHA5, GABBR2, GPC3, PPARGC1A, RPS6KA5, RUNX2, SGCD, SLC22A3, TRPC5, UNC5B |
| hsa-miR-214-3p | BMP8A, FOSB, GRIN1, HPSE2, KCNJ13, NOS1, NTN1, OPRK1, PPARGC1A, PTCH2, RUNX1, RUNX1T1, SEMA3D, SGCD, SLIT1, SV2B |
| hsa-miR-221-3p | CDON, CXCL12, ERBB4, FOS, NCAM1, PLXNC1, SHANK2 |
| hsa-miR-221-5p | ADRA1B, ALDH1A2, CCND1, DLG2, HRH1, PLCD3, PPP1R1B, RUNX1T1, SDC2, SHANK2, SLC6A1, TP63 |
| hsa-miR-222-3p | CDON, CXCL12, DLG2, ERBB4, FOS, NCAM1 |
| hsa-miR-222-5p | CD44, EGR1, EPHA5, FGF7, SDC2, TBC1D4, TNFRSF11B |
| hsa-miR-3065-5p | CTGF, DLG2, ERBB4, ETV5, FUT9, NLGN3, PTGFR, SLC17A7, SLIT1, SOX4 |
| hsa-miR-31-3p | CYP1B1 |
| hsa-miR-31-5p | CACNG4, FGF7, IL1RAP, NOS1, PLXNA4, RAPGEF5, SLC16A2 |
| hsa-miR-34a-5p | ANK2, BCL2, CCNE2, DGKI, F2RL2, FOSB, FUT9, GABBR2, GAS1, MET, PDGFRA, RAP1GAP, RCAN1, SLC16A2, SLC6A1, SOX4 |
| hsa-miR-363-3p | NOX4, SLC6A1, STEAP2, TP63 |
| hsa-miR-375 | SLC16A2 |
| hsa-miR-486-5p | EPHA3, GABRB3, SLC12A5, SRF |
| hsa-miR-508-3p | FGF7, HMGA2, RAPGEF5 |
| hsa-miR-509-3p | ZMAT3 |
| hsa-miR-514a-3p | AR |
| hsa-miR-551b-3p | ERBB4 |
| hsa-miR-7-2-3p | BCL2, ETV5, GABBR2, GAS1, HDAC9, PDE5A, PPP1R1A, SHANK2 |
| hsa-miR-7-5p | CYTH3, EPHA3, IRS1, KCNJ2, SHANK2, SLIT1, WASF3, ZMAT3 |
| hsa-miR-9-5p | ANK2, CCNE2, CNTFR, DIO2, DUSP6, ENTPD1, GABRB2, GRIK3, HMGA2, ID4, ITGB4, LIFR, MMP16, NOX4, PLXNA4, RPS6KA6, RUNX1, RUNX1T1, SDC2, SGCD, SHANK2, SHC3, SLC12A5, SLC39A14, TBC1D4, TNFRSF21 |
3.4 The association between clinical characteristics and PTC-specific lncRNAs
In the following analysis, the 45 specific lncRNAs identified in ceRNA network were evaluated to detect their clinical relevance, such as age, gender, race, lymphatic metastasis, TNM staging system, and patient outcome in TCGA database. It was found that a total of 37 specific lncRNAs expressed differentially correlated with PTC clinical features (P < 0.05, Table 6). Seven lncRNAs (ATP6V0E2-AS1, FOXD2-AS1, LINC01257, EGFEM1P, MIR9-3HG, MIR31HG, and FER1L4) were differentially expressed in age, 4 lncRNAs (YWHAEP7, LINC00887, MIR4697HG, and MIR9-3HG) were differentially expressed in race, 1 lncRNA (LINC00887) was differentially expressed in gender, 30 lncRNAs (ATP6V0E2-AS1, LINC00982, NR2F1-AS1, LOC100126784, DPY19L2P4, FLJ23867, TINCR, ANKRD20A8P, EGOT, FAM95B1, LOC143666, MIR4697HG, LRRC37A6P, LOC100130238, MIR31HG, TPTE2P1, FAR2P1, LINC01257, FAM181A-AS1, FLJ16779, EGFEM1P, LOC93429, GGT8P, FER1L4, GGT3P, ABCC6P1, LINC00284, KRTAP5-AS1, FOXD2-AS1, and HAND2-AS1) were differently expressed in lymphatic metastasis, 31 lncRNAs (LINC00982, FLJ23867, ABCC6P1, FAM181A-AS1, FOXD2-AS1, NR2F1-AS1, EGOT, TINCR, LRRC37A6P, LOC100126784, TPTE2P1, LOC100130238, FLJ16779, DPY19L2P4, GGT3P, MIR4697HG, MIR9-3HG, ANKRD20A8P, SMIM10L2A, GGT8P, FAM95B1, KRTAP5-AS1, LOC441204, GVINP1, LINC00887, MIR31HG, HAND2-AS1, EGFEM1P, LOC93429, ATP6V0E2-AS1, and LINC01257) were aberrantly expressed in different tumor sizes, and six lncRNAs (PLEKHA8P1, LOC100130238, GGT3P, MIR9-3HG, LINC00284, and EGFEM1P) were differentially expressed in prognosis.
| Comparisons | Upregulation | Downregulation |
|---|---|---|
| Age (≥45 vs <45 years old) | ATP6V0E2-AS1, FOXD2-AS1, LINC01257 | EGFEM1P, MIR9-3HG, MIR31HG, FER1L4 |
| Race (white vs Asian) | YWHAEP7, LINC00887 | MIR4697HG, MIR9-3HG |
| Gender (male vs female) | LINC00887 | |
| Lymphatic metastasis (yes vs no) | NR2F1-AS1, LOC100126784, FLJ23867, TINCR, EGOT, MIR31HG, FLJ16779, EGFEM1P, LOC93429, GGT8P, FER1L4, GGT3P, ABCC6P1, LINC00284, KRTAP5-AS1, FOXD2-AS1 | ATP6V0E2-AS1, LINC00982, DPY19L2P4, ANKRD20A8P, FAM95B1, LOC143666, MIR4697HG, LRRC37A6P, LOC100130238, TPTE2P1, FAR2P1, LINC01257, FAM181A-AS1, HAND2-AS1 |
| TNM staging system (T3 + T4 vs T1 + T2) | FLJ23867, ABCC6P1, FOXD2-AS1, NR2F1-AS1, EGOT, TINCR, LOC100126784, FLJ16779, GGT3P, GGT8P, KRTAP5-AS1, LOC441204, LINC00887, MIR31HG, EGFEM1P, LOC93429 | LINC00982, FAM181A-AS1, LRRC37A6P, TPTE2P1, LOC100130238, DPY19L2P4, MIR4697HG, MIR9-3HG, ANKRD20A8P, SMIM10L2A, FAM95B1, GVINP1, HAND2-AS1, ATP6V0E2-AS1, LINC01257 |
| Patient outcome (dead vs alive) | LOC100130238 | PLEKHA8P1, GGT3P, MIR9-3HG, LINC00284, EGFEM1P |
The univariate Cox proportional hazards regression model was performed to detect the prognostic value of 45 specific lncRNAs. We found that three specific lncRNAs closely related with PTC patient overall survival (OS, log-rank P < 0.05). There are two lncRNAs (GGT3P and KRTAP5-AS1) positively relating to OS, and only one lncRNA (DPY19L2P4) negatively relating to OS (Figure 7).

3.5 qRT-PCR validation
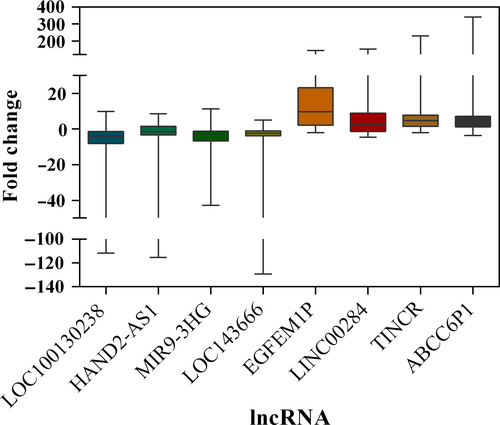
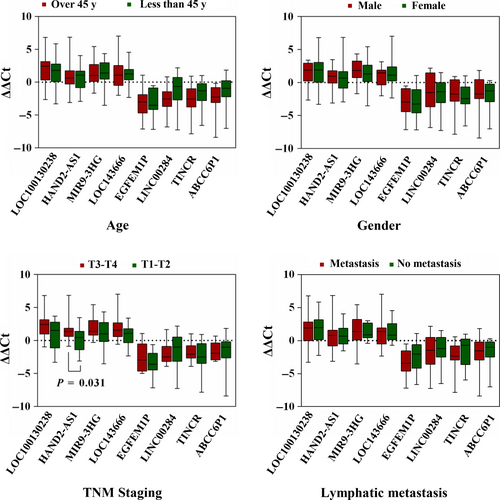
Evaluation of randomly selected eight lncRNAs (LOC100130238, HAND2-AS1, MIR9-3HG, LOC143666, EGFEM1P, LINC00284, TINCR, and ABCC6P1) was performed to prove the reliability of the above bioinformatics analysis (Table 7). Firstly, the expression status of the eight specific lncRNAs was detected in 28 newly diagnosed patients with PTC using qRT-PCR (Data S2). Compared with paired normal thyroid tissues, four lncRNAs (LOC100130238, HAND2-AS1, MIR9-3HG, and LOC143666) were downregulated in PTC tumor tissues, whereas the remaining four lncRNAs (EGFEM1P, LINC00284, TINCR, and ABCC6P1) were upregulated in PTC tumor tissues (Figure 8). All the eight lncRNAs were aberrantly expressed with the same trend and reached statistical significance (P < 0.05). Thus, the results were coherent with the above bioinformatics analysis. Subsequently, we performed the analysis of these eight lncRNAs and clinic features, and we found that HAND2-AS1 was significantly related to tumor size (Figure 9, P < 0.05). The result was identical with the analysis in TCGA database. Thus, our bioinformatics analysis is convincing based on the evaluation results.
| Names (lncRNAs) | Gene ID | Regulation | Average FC |
|---|---|---|---|
| LOC100130238 | 100130238 | Down | 9.69 |
| HAND2-AS1 | 79804 | Down | 4.82 |
| MIR9-3HG | 254559 | Down | 4.44 |
| LOC143666 | 143666 | Down | 4.35 |
| EGFEM1P | 93556 | Up | 6.94 |
| LINC00284 | 121838 | UP | 5.05 |
| TINCR | 257000 | Up | 10.84 |
| ABCC6P1 | 653190 | Up | 7.69 |
4 DISCUSSION
Thyroid cancer is a common malignant endocrine disorder worldwide with increasing incidence in last few decades. According to the National Cancer Center, PTC is the most frequently diagnosed cancer among Chinese women before 30 years old.31 We cannot overlook the rapid rising in PTC, although the use of ultrasonography and fine needle aspiration in clinical may lead to overdiagnosis and overtreatment of PTC. In general, PTC has a relatively favorable prognosis; however, there are still about 5%-10% of patients suffering from an aggressive form of PTC.32 Under such circumstances, thyroid cancer medicine is facing a huge challenge nowadays since concerns may cause overtreatment of PTC. Conventionally, risk evaluation for PTC is only based on clinicopathologic factors, such as age and lymphatic metastasis, which are definitely insufficient to accurately distinguish high-risk patients from low-risk patients. Thus, it is urgent to explore the underlying genetic background of PTC in order to identify the aggressive PTC and avoid overtreatment clinically. Research concerning the genetic regulatory mechanism in thyroid cancer has shown sustained development.
It is evident that aberrant expression of lncRNAs is closely related to oncogenesis in various cancer types.33 It is notable that lncRNAs are crucial in the genetic regulation and are responsible for cellular hemostasis.34, 35 Moreover, many studies showed that lncRNAs play an important part in tumorigenesis and are regulated by tumor suppressors or oncogenes transcriptionally. However, there are only a few studies focusing on lncRNAs in PTC using whole genome and transcriptome sequencing technologies,18, 36, 37 which demonstrated that dysregulated lncRNAs are essential in PTC carcinogenesis and may serve as diagnostic, prognostic biomarkers, and even therapeutic targets. Genomic analysis of PTC was firstly conducted using microarray in 2015 by Lan Xiabin et al,21 which identified thousands of differentially expressed lncRNAs and mRNAs in PTC tissues compared with normal thyroid cancer. Additionally, genomewide expression screening in 12 paired PTC tumor tissues and normal thyroid tissues identified 218 differentially expressed lncRNAs in PTC, and two lncRNAs (XLOC-051122 and XLOC-006074) were found closely related to lymphatic metastasis.22 Du et al38 have performed a genomewide analysis in 18 PTC patients’ tissues and 4 healthy donors’ tissues, and build the coexpression network of lncRNA–mRNA. By now, much is unknown about lncRNAs and mRNAs, or lncRNAs and miRNAs in PTC based on ceRNA hypothesis. The ceRNA network in cancer research has drawn increasing attention as it was proposed in 2011.19 It presented a hypothesis about how ceRNAs regulated other RNA transcripts by competing for miRNAs. It could be seen that ceRNA network has been built in many cancer types, such as colorectal cancer39 and lung cancer.40 These results indicate that lncRNAs prove to be significant in tumorigenesis.
TCGA is the largest cancer genetic information database to study the genomic profiles of PTC. The ceRNA (lncRNA-miRNA-mRNA) network of PTC was once constructed based on the 348 PTC samples in TCGA.24 In this study, dysregulated RNAs were identified in three PTC variants, including classical PTC, follicular PTC, and tall-cell PTC. However, the study missed part of the data in TCGA and lacked laboratory-based studies to validate the bioinformatics results. We aimed to identify the specific lncRNAs with diagnostic and prognostic roles in the study. Firstly, we retrieved the lncRNAs, miRNAs, and mRNAs profiles correlated with PTC stage and lymphatic metastasis in 461 PTC cases from TCGA database. Subsequently, the ceRNA network was built to predict the genetic interactions among the specific lncRNAs, miRNAs, and mRNAs. Next, we selected the intersected lncRNAs, miRNAs, and mRNAs in ceRNA network to assess their values in clinical relevance and prognosis based on the RNA sequencing data of 461 PTC samples and 55 normal samples. To validate the analysis results, the expression level of eight randomly selected lncRNAs (LOC100130238, HAND2-AS1, MIR9-3HG, LOC143666, EGFEM1P, LINC00284, TINCR, and ABCC6P1) was detected in 28 newly diagnosed tumor tissues and paired normal tissues in PTC patients using qRT-PCR. The evaluation displayed the consistent trend of up- and downregulation of selected lncRNAs with the expression level in TCGA. Eventually, the clinical information of donor samples was collected and compared with the data of TCGA. Similarly, the clinical relevance of lncRNAs was consistent with that of TCGA.
We classified PTC patients in TCGA into four groups based on TNM staging and lymph node status. Then, we compared the RNA sequence data of tumor tissues with that of normal thyroid tissues. The intersected mRNAs were finally decided accordingly. GO enrichment analysis and KEGG pathway analysis of intersected mRNAs were performed to reveal the potential mRNA functions. The top 25 GO enrichment terms indicated metastasis-associated functions, such as cell adhesion, proteolysis, and extracellular matrix organization. As for KEGG pathway analysis, top 25 pathways of intersected mRNAs included many cancer-specific pathways, such as MAPK, PI3K/Akt, and p53 signaling pathway. The results were consistent with the integrated genomic analysis in TCGA which demonstrated in detail about the importance of somatic genetic mutations, such as BRAF and RAS mutation, in the MAPK and PI3K pathways in PTC.41 Many studies have shown that BRAF gene mutations increased the MAPK signaling pathway activation which could promote the initiation and development of PTC.42-44 Generally, BRAF gene mutations are linked to larger tumor size, multifocality, extrathyroid extension, and lymphatic metastasis and predict poor prognosis.7, 45, 46 It was reported that AZD6244, a MAPK pathway inhibitor, was strongly promising to treat thyroid cancer.47 As the second most common gene mutation in thyroid cancer, RAS mutation mainly activates PI3K/Akt pathway.48, 49 Moreover, many drugs, such as temsirolimus and everolimus, targeting PI3K/Akt have been investigated in phases I to III clinical trials and proven to be effective in treating thyroid cancer.50 In addition, abnormal p53 activation is closely related to the development of thyroid cancer.51, 52 In conclusion, the functional analysis was closely related to the development of PTC, which was also coherent with the classification standards.
A great number of studies have presented that lncRNAs may function as ceRNAs and play an essential role in regulating gene expression.53-56 For instance, lncRNA H19 and HULC may act through a ceRNAs manner by regulating let-7a/let-7b and miR-372/miR-373 which play an essential part in cholangiocarcinoma development.57 We constructed ceRNA network of PTC with aberrantly expressed lncRNAs, miRNAs, and mRNAs in TCGA. Moreover, it was also found some cancer-specific lncRNAs, such as LINC01140, LINC00261, ABHD11-AS1, and TINCR,58-61 served as important biomarkers in other different cancer types as well. We also found certain lncRNAs in ceRNAs played important roles in carcinogeneses, such as FOXD2-AS, DLEU2, FER1L4, HAND2-AS1, and TPTE2P1.62-66 Next, we analyzed the biologic functions and pathways of identified mRNAs in ceRNA network. The results revealed many important functions and pathways, including MAPK, PI3K/Akt, and p53 signaling pathway.
We analyzed the correlation of 45 PTC-specific lncRNAs and clinic features, including age, race, gender, lymph node metastasis, TNM staging system, and patient outcome. The result showed that 37 specific lncRNAs were correlated with the above clinic characteristics. Eleven of these 37 lncRNAs have been reported to be closely related to various cancer types. For instance, lncRNA MIR31HG might function as an endogenous “sponge” for competing miR-193b binding to regulate gene expression and promote tumor progression in pancreatic ductal adenocarcinoma.67 So far, there are few reports on the clinical relevance of these specific lncRNAs and PTC. More laboratory-based work needs to be done to verify the interaction of lncRNAs, miRNAs, and mRNAs in PTC. Eventually, we also analyzed the association between these 45 lncRNAs with patient OS. It was found that six lncRNAs (LOC100130238, PLEKHA8P1, GGT3P, MIR9-3HG, LINC00284, and EGFEM1P) were linked to PTC OS.
Subsequently, qRT-PCR validation of 8 lncRNAs in 28 paired samples was performed to assess the credibility and accuracy of the bioinformatics results. The results of qRT-PCR were consistent with the expression data in TCGA. Next, we assessed the clinical relevance of these eight lncRNAs based on our collected clinical information. The results suggested that HAND2-AS1 was closely related to tumor size, which is in coherence with the results of TCGA analysis. Hence, the bioinformatics analysis results of our study are credible and convincing.
Our study intended to identify the specific lncRNAs in PTC and investigate their genetic regulation by constructing the ceRNA network. Moreover, the expression status and clinical relevance of identified lncRNAs from TCGA database were assessed and compared with the data of donor samples. Finally, the credibility of bioinformatics analysis results was demonstrated and confirmed by qRT-PCR. Taken together, our results suggested that lncRNA-related ceRNA network might play an important role in the initiation and development of PTC. We also hope that our study can inspire researchers in this field to carry out further work.
ACKNOWLEDGMENT
The present study was supported by the technology development project of Nanjing (YKK10080). We appreciate Mr. Cheng donglin for his technical assistance.


