MAGE-C3 promotes cancer metastasis by inducing epithelial-mesenchymal transition and immunosuppression in esophageal squamous cell carcinoma
Qingnan Wu and Weimin Zhang contributed equally to this work.
Abstract
Background
Evading immune surveillance is necessary for tumor metastasis. Thus, there is an urgent need to better understand the interaction between metastasis and mechanisms of tumor immune evasion. In this study, we aimed to clarify a novel mechanism that link tumor metastasis and immunosuppression in the development of esophageal squamous cell carcinoma (ESCC).
Methods
The expression of melanoma-associated antigen C3 (MAGE-C3) was detected using immunohistochemistry. Transwell assays were used to evaluate the migration and invasion ability of esophageal squamous cell carcinoma (ESCC) cells. Metastasis assays in mice were used to evaluate metastatic ability in vivo. Lymphocyte-mediated cytotoxicity assays were performed to visualize the immune suppression function on tumor cells. RNA sequencing was performed to identify differentially expressed genes between MAGE-C3 overexpressing ESCC cells and control cells. Gene ontology (GO) enrichment analyses was performed to identify the most altered pathways influenced by MAGE-C3. The activation of the interferon-γ (IFN-γ) pathway was analyzed using Western blotting, GAS luciferase reporter assays, immunofluorescence, and flow cytometry. The role of MAGE-C3 in the IFN-γ pathway was determined by Western blotting and immunoprecipitation. Furthermore, immunohistochemistry and flow cytometry analysis monitored the changes of infiltrated T cell populations in murine lung metastases.
Results
MAGE-C3 was overexpressed in ESCC tissues. High expression of MAGE-C3 had a significant association with the risk of lymphatic metastasis and poor survival in patients with ESCC. Functional experiments revealed that MAGE-C3 promoted tumor metastasis by activating the epithelial-mesenchymal transition (EMT). MAGE-C3 repressed antitumor immunity and regulated cytokine secretion of T cells, implying an immunosuppressive function. Mechanistically, MAGE-C3 facilitated IFN-γ signaling and upregulated programmed cell death ligand 1 (PDL1) by binding with IFN-γ receptor 1 (IFNGR1) and strengthening the interaction between IFNGR1 and signal transducer and activator of transcription 1 (STAT1). Interestingly, MAGE-C3 displayed higher tumorigenesis in immune-competent mice than in immune-deficient nude mice, confirming the immunosuppressive role of MAGE-C3. Furthermore, mice bearing MAGE-C3-overexpressing tumors showed worse survival and more lung metastases with decreased CD8+ infiltrated T cells and increased programmed cell death 1 (PD-1)+CD8+ infiltrated T cells.
Conclusion
MAGE-C3 enhances tumor metastasis through promoting EMT and protecting tumors from immune surveillance, and could be a potential prognostic marker and therapeutic target.
Abbreviations
-
- CCL20
-
- chemokine (C-C motif) ligand 20
-
- CFSE
-
- 5,6-carboxyfluorescein diacetate,succinimidyl ester
-
- CTA
-
- cancer/testis antigen
-
- CTL
-
- cytotoxic T lymphocyte
-
- CTLA-4
-
- cytotoxic T lymphocyte antigen 4
-
- DMEM
-
- Dulbecco's modified eagle medium
-
- EDTA
-
- ethylenediaminetetraacetic acid
-
- EMT
-
- epithelial-mesenchymal transition
-
- ESCC
-
- esophageal squamous cell carcinoma
-
- FBS
-
- fetal bovine serum
-
- FDA
-
- Food and Drug Administration
-
- GO
-
- gene ontology
-
- IFNGR1
-
- IFN-γ receptor 1
-
- IFN-γ
-
- interferon gamma
-
- IL-10
-
- human interleukin 1β
-
- IRF1
-
- interferon regulatory factor 1
-
- LNM
-
- lymph node metastasis
-
- MAGE-C3
-
- melanoma-associated antigen C3
-
- MHD
-
- MAGE homology domain
-
- NCBI
-
- National Center for Biotechnology Information
-
- OS
-
- Overall survival
-
- PBMC
-
- peripheral blood mononuclear cell
-
- PBS
-
- phosphate-buffered saline
-
- PD-1
-
- programmed cell death protein 1
-
- PD-L1
-
- programmed death-ligand 1
-
- PI
-
- propidium iodide
-
- PVDF
-
- ployvinylidene difluoride
-
- SDS-PAGE
-
- sodium dodecyl sulphate-polyacrylamide gel electrophoresis
-
- siRNA
-
- small interfering RNA
-
- STAT1
-
- signal transducer and activator of transcription 1
-
- TGF-β
-
- transforming growth factor beta
-
- TMB
-
- 3,3',5,5'-Tetramethylbenzidine
-
- TNF-α
-
- tumor necrosis factor
-
- US
-
- United States
1 INTRODUCTION
Cancer metastasis is a complex process and a primary cause of cancer death. Metastasis is not only driven by tumor-intrinsic signaling but also regulated by the tumor-extrinsic microenvironment [1]. Primary tumor cells exhibit strategies for intravasation into the circulatory system and the establishment of secondary tumors. First, oncogenic signaling in tumor cells is frequently hyperactivated to improve cellular mobility and invasion. Several investigations showed that in the tumor-extrinsic microenvironment, tumor cells avoid recognition and ablation by cytotoxic T lymphocytes (CTLs) during metastasis [2]. For instance, tumor cells are dependent on the expression of cytotoxic T lymphocyte antigen 4 (CTLA-4), programmed cell death ligand 1 (PDL1) and β2 microglobulin to inhibit clearance by phagocytes and CTLs [3-5]. Moreover, tumor-infiltrating immunosuppressive cells, such as tumor-associated macrophages, myeloid-derived suppressor cell and regulatory T cells, are recruited to protect tumor cells from immune surveillance by inhibiting T cell proliferation and activation or secreting immunosuppressive cytokines [6-8]. In particular, recent findings have focused on the mechanisms by which cancer cells undergo epithelial-mesenchymal transition (EMT), and these mechanisms may facilitate immune escape and metastasis formation in tumor cells [9]. A patient-derived, pan-cancer EMT signature analysis has revealed a strong correlation between EMT and high expression of immune checkpoints and other druggable immune targets [10]. Mechanistically, the acquisition of a mesenchymal phenotype has been reported to be associated with resistance to CTLs and natural killer cells owing to activation of transforming growth factor beta (TGF-β)/chemokine (C-C motif) ligand 20 (CCL20) signaling or high PD-L1 expression [11, 12]. Nevertheless, an understanding of the reciprocal communication between the EMT and tumor evasion requires further elucidation.
Esophageal squamous cell carcinoma (ESCC) is a common malignant gastrointestinal tumor with a high mortality rate. Systemic treatment for advanced ESCC mainly depends on cytotoxic agents, which lead to limited survival benefits [13, 14]. At present, immune checkpoint inhibitors have presented the broadest efficacy and safety, with several United States Food and Drug Administration (US-FDA)-approved antibodies targeting CTLA-4 or PDL1- programmed cell death protein 1 (PD-1) in various cancer types [15]. Based on the promising results of KEYNOTE-181, pembrolizumab was first permitted as a second-line therapy in patients with PD-L1-positive esophageal cancer [16]. Subsequently, in 2020, the US FDA approved nivolumab for patients with unresectable advanced, recurrent, or metastatic ESCC, independent of PD-L1 expression [17]. Thus, immune checkpoint blockade therapy is promising for ESCC treatment, and the mechanisms of immune evasion are worthy of further investigation.
Melanoma-associated antigen C3 (MAGE-C3) is a member of the MAGE family and shares a common and conserved MAGE homology domain (MHD) [18]. According to protein expression patterns and gene locations, members of the MAGE family are divided into two types. Of the two types, the type II MAGE family members including MAGE-A, MAGE-B, and MAGE-C, are known as cancer/testis antigens (CTA) and exhibit restricted expression in germline tissues but are often aberrantly expressed in different types of cancers [19]. The aberrant expression pattern of type II MAGE family members, especially MAGE-As, have been associated with poor survival in several cancers, such as non-small cell lung cancer, breast cancer and ovarian cancer [20-22]. Furthermore, the MAGE family has been reported to intensify metastasis, invasion and tumorigenesis [23, 24]. In particular, using sequencing technology, Eng et al. [25] reported that MAGE-C3 might be involved in earlier onset of ovarian cancer. MAGE-C3 has also been shown to correlate with lymph node metastasis (LNM) and poor relapse-free survival in patients with breast cancer [26, 27]. Although these studies indicate that MAGE-C3 may promote tumor metastasis, the molecular mechanisms by which MAGE-C3 enhances the development of such malignancies remain largely unknown. Here we aimed to identify a novel mechanism of MAGE-C3 in promoting tumor metastasis and altering the tumor microenvironment in ESCC.
2 MATERIALS AND METHODS
2.1 Cell culture
The ESCC cell lines KYSE30, KYSE410, and KYSE140 were gifts from Yoshikazu Shimada of Kyoto University (Sakyo-ku, Kyoto-shi, Kyoto, JAPAN) and cultured in RPMI 1640 medium with 10% fetal bovine serum (FBS) (Gibco, Thermo Fisher, Waltham, MA, USA). The Jurkat cell line was bought from national infrastructure of cell line resource and cultured in RPMI 1640 medium with 10% FBS. The B16f10 cell line was bought from national infrastructure of cell line resource and cultured in Dulbecco's modified eagle medium (DMEM) with 10% FBS. These were authenticated using short tandem repeat profiling. The stable overexpression cell lines KYSE30, KYSE140, and KYSE410 were cultured in RPMI 1640 with 10% FBS and 0.5μg/mL puromycin (Sigma, St Louis, MO, USA). The cells were culture condition was maintained at 37°C with 5% CO2. For IFN-γ treatment, cells were incubated with 50ng/mL IFN-γ (Sigma,) for 24 h. For WP1066 treatment (S2796, Selleck Chemicals, Houston, Texas, USA), cells were incubated with 5μM WP1066 for 20 h. For Ruxolitinib treatment (HY-50856, MedChemExpress, NJ, Princeton, USA) cells were incubated with 2μM ruxolitinib for 20 h.
2.2 Plasmid construction and infection
- 5’-GGAUGCCACCUUCAGUGAU-3’ for si-1 of MAGE-C3;
- 5’-GGAACUUCAGAUCAGCGAA-3’ for si-2 of MAGE-C3;
- 5’ -CCGUGAGUUCAUAGAGAUU-3’ for si-3 of MAG-C3;
- 5‘-CGAUUAUGAUCCCGAAACU-3’ for si-IFNGR1;
- 5‘-GCAAGAAGAUGUUCUCCAA-3’ for si-IFNGR2.
2.3 Immunohistochemical analysis
A tissue microarray constructed using tumor tissues from 93 patients with primary ESCC diagnosed between January 2019 and December 2010 was purchased from Shanghai Outdo Biotech Co. Ltd (Shanghai, China). Of the 93 patients, 87 had matched adjacent normal tissues (77 males and 16 females at the age from 49 to 85, median age 65.8±8.7 years). All patients were not treated with chemotherapy or radiotherapy before surgery. In parallel, we collected demographic data, tumor pathological grades, clinical stages, survival data, and outcomes, including local invasion, LNM, and distant metastasis from the medical records. The follow-up period was 78 months or until death. Informed consent from the patients and ethics approval from the Institutional Research Ethics Committee was obtained.
For immunohistochemistry, tissue samples were deparaffinized in xylene and rehydrated in graded ethanol. Samples were immersed in ethylenediaminetetraacetic acid (EDTA) antigenic retrieval solution (pH8.0) and heated for antigenic retrieval for 15 min. The sections were incubated in normal goat serum blocking buffer at room temperature (25°C) for 1h. The sections were then incubated with a 1:100 dilution of anti-MAGE-C3 primary antibody (1:200; PA5-62546; Invitrogen, Thermo Fisher, Waltham, MA, USA,) or anti-CD8 alpha (1:100; ab217344; Abcam, Cambridge, UK,) at 4°C overnight, and then incubated with peroxidase (HRP)-conjugated secondary antibody (DS-0004, ZSGB-BIO, Beijing, China) for 1 h at room temperature. Cell nuclei were stained with hematoxylin staining solution (ZLI-9610, ZSGB-BIO). Immunostaining intensity of MAGE-C3 was evaluated, -: none, +: light yellow, ++: yellow brown, +++: brown. All patients were divided into two groups as follows: low expression group, -, +; high expression group, ++, +++.
2.4 Transwell migration/invasion assays
For the migration assay, 2 × 10⁵ cells suspended in 100 μL of serum-free medium were added to the upper chamber of the transwell cell culture chambers (3422, Corning, NY, USA). Then, 600 μL of medium with 20% FBS was added to the lower chamber and incubated for 10-20 h. Finally, the migrated cells on the lower surface of the membrane were fixed with methanol before staining with crystal violet (C0121, Beyotime, Beijing, China). In the invasion assay, 100 μL of medium containing 2% Matrigel matrix (354234, Corning) was pre-coated to the membrane of the upper chamber.
For cell migration and invasion detected via the xCELLigence DP system (Roche, Basel, Switzerland), we seeded 1 × 10⁴ cells in 100 μL of serum-free medium in for migration and invasion assays. The E16-plate was placed in an RTCA-DP device (Roche) at 37°C with 5% CO2. Cell indexes were read every 15 min and the recorded curve was shown as a cell index.
2.5 Cell proliferation
Cell proliferation was detected using the xCELLigence MP system (Roche), which is a real-time cell growth analysis system. 50 μL of culture medium was added to each well of E-Plate 96 (Roche) to set the impedance baseline. Next, 1,000 cells in 150 μL of culture medium were seeded in an E-Plate 96 and was placed in an RTCA-MP device (Roche) at 37°C with 5% CO2; and cell indexes were read every 15 min, and the recorded curve was shown as a cell index.
2.6 Animal experiments
All animal care procedures and experiments were conducted according to the animal welfare guidelines and based on the “3R” principle (reduction, replacement, refinement). Mouse experiments were approved by the ethical committee of Peking University Cancer Hospital & Institute (Beijing, China). Three independent experiments were conducted.
For xenograft studies, 5-week-old female BALB/c nude mice or C57/BL6 mice (Vital River Laboratories, Beijing, China) were used. Further, 1 × 10⁶ MAGE-C3 stably overexpressing KYSE30 cells or 5 × 10⁵ MAGE-C3 stably overexpressing B16F10 cells and control cells were injected subcutaneously into the bilateral dorsal flank, respectively. The mice were euthanized after 1 month, tumor weights were measured, and tumor volumes were calculated using the formula: π/6 × larger diameter × smaller diameter square.
For metastasis assay, 2 × 10⁵ cells were injected into 5-week-old female BALB/c nude mice or C57/BL6 mice via the tail the vein. The mice were euthanized after 1 month, and the lungs were enucleated and paraffin-embedded. Tissue sections were collected and stained with hematoxylin and eosin.
2.7 Western blotting and immunoprecipitation assays
Cells were collected and lysed in RIPA buffer with a protease inhibitor cocktail (04693132001, Roche) for 40 min on ice. The supernatant was collected after centrifugation at 12,000 × g for 15 min. Approximately, 30 μg of protein was resolved by SDS-PAGE and transferred to a ployvinylidene difluoride (PVDF) membrane (1620177, Bio-rad, Hercules, USA). The membrane was incubated with primary antibodies at 4°C overnight and then incubated with secondary antibodies for 1h at room temperature. The following antibodies were used: anti-PD-L1 (1:500; ab21093; Abcam), anti-STAT1 (phospho Y701) (1:1000; ab29045; Abcam), anti-STAT1 (phospho S727) (1:1000; ab109461; Abcam,, anti-MAGE-C3 (1:500; PA5-68045; Thermo Fisher), anti-IFNGR2 (1:1000; 10266-1-AP; Proteintech), anti-Vimentin (1:1000; 10366-1-AP; Proteintech), anti-interferon regulatory factor 1 (1:1000; 11335-1-AP; Proteintech), anti-Signal transducer and activator Of transcription 3 (1:1000; 9139; Cell Signaling Technology, Boston, MA, USA), anti-phospho-STAT3 (Tyr705) (1:500; 9145; Cell Signaling Technology), anti-phospho-Jak2 (Tyr1007/1008) (1:500; 3771; Cell Signaling Technology), anti-N-Cadherin (1:500; 13116; Cell Signaling Technology), anti-flag (1:500; F3165; Sigma), anti-rabbit IgG, HRP-linked antibody (1:5000; 7074; Cell Signaling Technology), anti-mouse IgG, HRP-linked Antibody (1:5000; 7076; Cell Signaling Technology).
For immunoprecipitation, cells were lysed RIPA buffer with a protease inhibitor cocktail (04693132001, Roche) for 4 × 10 min on ice. The 2 mg cell lysate was incubated with 2μg primary antibodies and protein A-agarose magnetic beads (HY-K0202, MedChemExpress). Immunoprecipitates were washed 5 times with lysis buffer and collected using magnetic stand. The immunoprecipitates were degenerated and loaded into each well of a 10-15% SDS-PAGE, and then transferred onto a PVDF membrane. Finally, the membrane was incubated with anti-STAT1 (1:1000; 11335-1-AP; Proteintech) or anti-MAGE-C3 (1:1000; 11335-1-AP; Proteintech) overnight at 4°C and then incubated with secondary antibodies anti-rabbit IgG, HRP-linked antibody (1:5000;7074; Cell Signaling Technology), anti-mouse IgG, HRP-linked antibody (1:5000; 7076; Cell Signaling Technology). The target bands would be exposed by Amersham Imager 600 (GE, Boston, MA, USA).
2.8 T-lymphocyte-mediated tumor killing assay
Peripheral blood mononuclear cells (PBMCs) from 10 healthy donors in Peking Cancer Hospital were isolated using lymphocyte separation medium (Tbdscience, Tianjin, China). PBMCs were activated with Dynabeads Human T-Activator CD3/CD8 (Gibco, Thermo Fisher) for 3 days. The tumor cells were pre-stained with 1 μM 5,6- carboxyfluorescein diacetate,succinimidyl ester (CFSE) (C0051, Beyotime) for 10 min at 37°C and then washed three times with PBS. The tumor cells were co-cultured with stimulated lymphocytes at ratio of tumor cells/T cells of 1:20 for 2 days in 24-well plates, then the cells were collected and labeled with 1 mg/mL propidium iodide (PI) (ST511, Beyotime) for 5 min at room temperature, then subjected to flow cytometry (BD Bioscience, East Rutherford, NJ, USA), CFSE+PI+ cells represented dead tumor cells that killed by T cells.
2.9 Flow cytometry analysis
The cells were digested by pancreatin (C125C1, NCM Biotech, Suzhou, Jiangsu, China,) and incubated with PD-L1-Alexa Fluor 647 (1:100; ab209960; Abcam, Cambridge, UK,) and the control were incubated with isotype (1:100; ab199093; Abcam) at 4°C for 30 min. After incubation, the cells were washed twice and suspended in phosphate-buffered saline (PBS). The cells were analyzed by Flow Cytometry (BD Bioscience).
The mouse lung tissues were digested with collagenase I (A004194, Sangon Biotech, Shanghai, China). Cells were stained with fluorescently labeled antibodies. Then cells were analyzed by flow cytometry (BD Bioscience), and the data were analyzed using the FlowJo10 software (BD Bioscienc). The following antibodies were used: anti-CD45 PE/Cy7-conjugated (1;100;103113;BioLegend, San Diego, CA, USA), anti-CD3ε PerCP/Cy5.5-conjugated (1:100;100327; BioLegend), anti-PD-1-APC-conjugated (1:100; 135209; BioLegend).
2.10 Cytokine measurements
Cytokine in supernatants were measured using commercial ELISA kits from NeoBioscience (Shenzhen, Guangdong, China): human interleukin-10 ELISA Kit (EHC009H), human tumor necrosis factor -α ELISA Kit (EHC103a.96), human interleukin-1β ELISA Kit (EHC002b), and human interferon-γ ELISA Kit (EHC102g.96). Briefly, the cell culture supernatant was centrifugated for 15 min at 1,000 × g to remove particulates. Further, 100 μL of sample was added per well and incubated for 2 h at 37°C to remove the liquid. Add Biotin-antibody was added into the well and incubated for 1 h at 37°C. Then aspirate each well was aspirate and washed with wash buffer from the kit for three times. HRP-acidin was added to each well and incubated for 1 h at 37°C. The aspiration was repeated for five times. Furthermore, 3,3',5,5'-Tetramethylbenzidine (TMB) substrate was added to each well and incubated for 30 min at 37°C. Finally, add the stop solution was added and determine the optical density at 450 nm was determined using by infinite M200PRO (TECAN, Thermo Fisher).
2.11 GAS luciferase reporter assay
GAS luciferase reporter plasmids (336841, Qiagen, Dusseldorf, German) and MAGE-C3-flag plasmid were co-transfected into cells using Lipofectamine 2000 (11668019, Thermo Fisher) according to the manufacturer's instruction. Luciferase activity was measured 48 h after transfection using the Dual-Luciferase Reporter Assay System 10-Pack (N1610, Promega, Madison, WI, USA). Briefly, the growth medium of cultured cells was removed and the cells were rinsed in PBS. Passive lysis buffer was then added, and the culture vessel was gently rocked for 15 min at room temperature. The lysate was centrifugated for 30 s at 3,000 × g to remove insoluble substances. The lysate was then transferred to a 96-well plate. Next, 100 μL of LAR II and Stop & Glo reagent from kit was added, and the samples were measured using for measurements by infinite M200PRO (TECAN, Thermo Fishe). Photinus luciferase activity was measured relative to Renilla luciferase activity was measured.
2.12 Nuclear and cytoplasmic extraction assay
Nuclear and cytoplasmic extraction assay was performed using NE-PER® Nuclear and Cytoplasmic Extraction Reagents (78835, Thermo Fisher) according to the manual. For 3 × 10⁶ cells (about 50 μL), 500 μL of ice-cold cytosol extraction reagent I from the kit was added in a tube and vortexed vigorously for 15 s to suspend the cell pellet. The tube was incubated on ice for 10 min. Next, ice-cold cytosol extraction reagent II from the kit was added to the tube and vortexed for 5 s and then incubated on ice for 1 min followed by vortexing for another 5 s and centrifugation for 5 min at 12,000 × g. After centrifugation, the supernatant (cytoplasmic extract) was transferred to a clean tube, and the insoluble fraction was suspended in ice-cold buffer nuclear extraction buffer and vortexed for 15 s. The sample was then placed on ice and vortexed for 15 s every 10 min for four times. Finally, the tube was centrifuged at 13,000 × g for 10 min, and the supernatant fraction (nuclear extract) was immediately transferred to a clean pre-chilled tube.
2.13 Quantitative real-time quantitative polymerase chain reaction (PCR) analysis
- PD-L1: forward, ‘5-ACCTGGCTGCACTAATTGTCT-3’;
- reverse, 5’- CTTGTAGTCGGCACCACCAT-3’.
- Vimentin: forward, 5’-TGCCGTTGAAGCTGCTAACTA-3’;
- reverse, 5’-CCAGAGGGAGTGAATCCAGATTA-3’.
- GAPDH: forward, 5-TCTCTGCTCCTCCTGTTC-3’;
- reverse, 5’-GTTGACTCCGACCTTCAC-3’.
2.14 Immunofluorescence
Cells were seeded on glass bottom dished (150680, Thermo Fisher) for 24 h and fixed in 4% paraformaldehyde for 15 min. The cells were incubated with the primary antibodies anti-flag (1:200; F3165; Sigma) and anti-STAT1 (1:200;14994; cell signaling technology) overnight at 4°C, and then stained with followed by Alexa Fluor 488 and Alexa Fluor 594-secondary antibody (1:100; ZF-0511; ZF-0513; ZSGB-BIO). Nuclei were detected by DAPI (D9542; Sigam). Immunofluorescence was analyzed using a confocal laser scanning confocal microscope (Leica Microsystems Heiderg GmbH).
2.15 RNA-seq analysis
RNA extraction and RNA-seq analysis were performed by CapitalBio Technology (Beijing, China). A total amount of 2-μg RNA per sample was used for the RNA sample preparations. Sequencing libraries were generated using Collibri Stranded RNA Library Prep Kit for Illumina Systems (Thermo Fisher) following the manufacturer's instructions. The library was sequenced on the HiSeq 2500 sequencers (Illumina, San Diego, CA). Raw reads were filtered by NGSQC toolkit (version 2.3.3). Clean reads were mapped to the reference genome by HISAT (version 2.0) with default parameters. Gene expression values of the transcripts were analyzed by Cuffquant and Cuffnorm (version 2.2.0). Cuffdiff (version 2.2.0) was used to determine differentially expressed genes (DEGs) between two samples. Genes were considered as significantly differentially expressed if q value < = 0.05 and |fold change| > 1.0. Gene ontology analysis was performed using DAVID.
2.16 Statistics
All analyses from experiments were performed at least three times using SPSS 11.5 software (IBM Japan, Tokyo, Japan). Pearson chi-square test was used to analyze the relationship between MAGE-C3 expression and pathological grade, clinical stage, and LNM and Student t-test was used to compare the means. Kaplan-Meier method and log-rank test were used to analyze the overall survival (OS). The starting point for OS was the time that patient was diagnosed with ESCC. Significance was set at P < 0.05, and all tests were 2-tailed.
3 RESULTS
3.1 MAGE-C3 expression was associated correlates with prognosis and LNM in ESCC
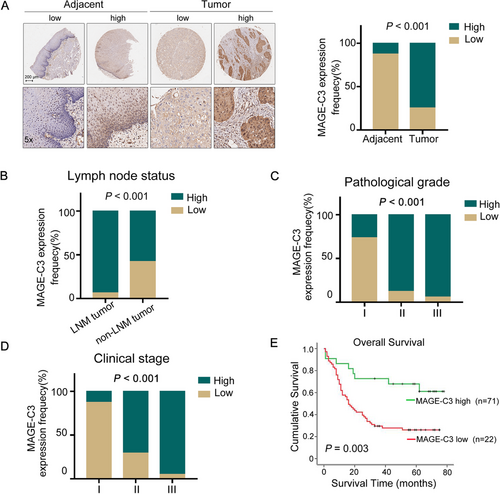
In our previous study, we conducted whole-genome analysis in ESCC patients and found that MAGE-C3 exhibited an 8.0% mutation rate and 8.6% copy number amplification rate in ESCC patients [28], suggesting an important role of MAGE-C3 during tumor progression. To explore the role of MAGE-C3 in ESCC, in this study, a tissue microarray which containing 93 cancer tissue and 87 matched adjacent normal tissue sample was used for immunohistochemistry. We found that MAGE-C3 was highly expressed in 74.7% (65/87) of cancer tissues, whereas it was only expressed in 12.6% (11/87) of adjacent normal tissue tissues (P < 0.001; Figure 1A and Supplementary Table S1). Based on the expression levels of MAGE-C3 in cancer tissues, we divided all ESCC patients into high and low expression groups. Out of 93 cancer samples, 71 (76.3%) displayed high expression, whereas 22 (23.7%) showed low expression. We further analyzed the relationship between MAGE-C3 expression and clinical parameters (Supplementary Table S2). We did not observe a significant difference in MAGE-C3 expression based on sex (P = 0.53) or age (P = 0.311). Interestingly, 93.8% (45/48) of patients with LNM displayed high MAGE-C3 expression, whereas only 57.8% (26/45) of patients without LNM displayed high MAGE-C3 expression, and a positive correlation between MAGE-C3 expression and LNM was identified (P < 0.001; Figure 1B). Additionally, MAGE-C3 expression was significantly associated with pathological grade (P < 0.001; Figure 1C) and clinical stage (P < 0.001; Figure 1D). Therefore, we further examined the role of MAGE-C3 in ESCC prognosis. During the follow-up period (average: 31 months, range: 1-78 months), there were 60 cancer-related deaths, including 8 cases in the low expression group and 52 cases in the high expression group. ESCC patients with low MAGE-C3 expression showed longer OS whereas those with high MAGE-C3 expression revealed shorter OS, as determined by Kaplan-Meier analysis (P = 0.003; Figure 1E).
3.2 MAGE-C3 enhanced tumor cell mobility and promoted metastasis
A high MAGE-C3 expression was associated with LNM in ESCC patients; we investigated whether MAGE-C3 influenced the metastatic capacity of ESCC cells. We measured the endogenous MAGE-C3 in 9 ESCC cell lines (Supplementary Figure S1A). The KYSE410 and KYSE140, which display the lowest and highest MAGE-C3 level, were used to introduce MAGE-C3-flag plasmids and MAGE-C3-targeted siRNAs respectively. And the KYSE30 cells, which displayed medium MAGE-C3 level, were used for both overexpressing and knocking down (Supplementary Figure S1B). We found that MAGE-C3 overexpression in KYSE30 cells increased cellular migration and invasion compared with that of an empty vector via transwell assays (Figure 2A); these results were confirmed in KYSE410 cells using the xCELLigence Real-Time Cell Analyzer (Figure 2B). In contrast, MAGE-C3 knockdown attenuated the migration and invasion of KYSE30 (Figure 2C) and KYSE140 cells (Figure 2D). These data imply that MAGE-C3 promoted cell mobility in vitro.
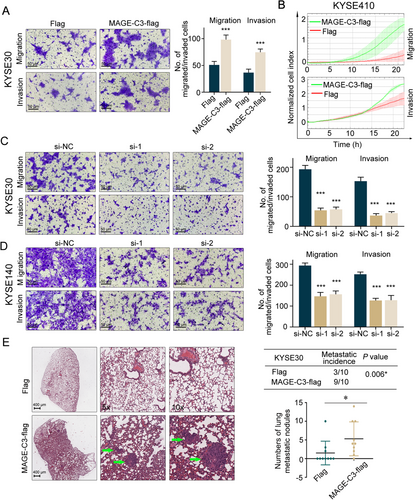
Next, to determine the role of MAGE-C3 in metastasis in vivo, KYSE30 cells stably expressing MAGE-C3 (pLVX-MAGE-C3) or an empty vector (pLVX-nc) were established and injected into BALB/c nude mice intravenously. One month later, almost all the mice injected with MAGE-C3-overexpressing cells developed lung metastases, whereas only 30.0% (3/10) of control mice developed lung metastases (Figure 2E). The average number of metastatic tumor nodules in the MAGE-C3-overexpressing group was significantly higher than that in the control group (Figure 2E).
Because metastasis is closely associated with increased proliferation, we performed immunohistochemical with ki67 in metastatic nodules. The ki67 staining in metastatic nodules of MAGE-C3 overexpression group was nearly same as that in control group (Supplementary Figure S1C). Moreover, we showed that MAGE-C3 did not significantly alter the proliferation of ESCC cells in vitro (Supplementary Figure S1D-E). Similarly, overexpression of MAGE-C3 did not enhance tumor formation and tumor volume in the nude mouse xenograft formation (Supplementary Figure S1F). Collectively, these observations showed that MAGE-C3 promoted tumor metastasis, but was not involved in tumor cell proliferation in vitro and tumor formation in vivo.
3.3 MAGE-C3 enhanced tumor cell invasion and migration via STAT3-mediated EMT
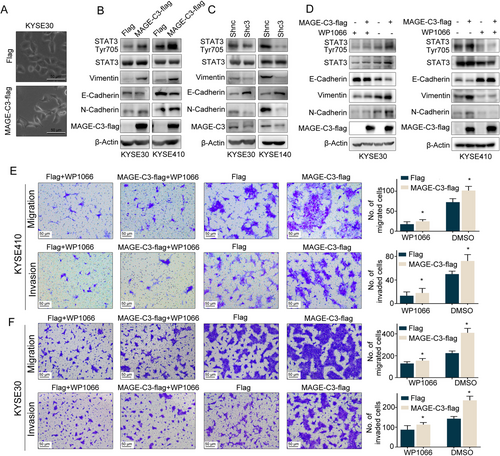
Activation of EMT is important for driving cancer cell metastasis, which is usually accompanied by a spindle-like morphological change [29]. Compared with the control cells, we observed a more spindle-like phenotype in MAGE-C3 overexpressing cells (Figure 3A). Thus, we hypothesized that MAGE-C3 promotes ESCC cell invasion and migration via EMT progression. To test this hypothesis, we detected changes in the EMT-related markers, E-cadherin, N-cadherin, and Vimentin, in relation to MAGE-C3 levels. To reduce endogenous MAGE-C3 as much as possible, we stably knocked down MAGE-C3 in KYSE30 and KYSE140 cells using two combined lentiviral short hairpin RNAs (Shc3) and a negative control (Shnc). As shown in Figure. 3B, a reduction in E-cadherin level and upregulation of Vimentin and N-cadherin were observed in MAGE-C3 overexpression KYSE30 and KYSE410 cells, whereas E-cadherin was upregulated and vimentin and N-cadherin levels were reduced in MAGE-C3-knockdown KYSE30 and KYSE140 cells (Figure 3C). Several cell-intrinsic signaling pathways cooperate to induce the EMT, such as the TGF-β, Wnt, and Notch pathways, as well as mitogenic growth factor receptor-induced pathways [9]. To verify the mechanisms involved in MAGE-C3-regulated EMT, we analyzed some important transcription factors that induce EMT, such as STAT3, Nuclear Factor Kappa Beta (NF-κB), and Smad2/3 [9]. We found that STAT3 was activated in MAGE-C3 overexpressing KYSE30 and KYSE410 cells with increased pSTAT3Tyr705 levels (Figure 3D), whereas NF-κB and Smad2/3 levels remained nearly unchanged (Supplementary Figure S2). Hence, we hypothesized that MAGE-C3-induced EMT occurs via STAT3. WP1066, a STAT3-specific inhibitor, was employed to confirm the role of STAT3 in MAGE-C3-mediated EMT. When MAGE-C3 overexpressing cells were treated with WP1066, the levels of pSTAT3Tyr705, E-cadherin, and Vimentin were almost unchanged, whereas pSTAT3Tyr705 and Vimentin levels were increased and E-cadherin levels were reduced in MAGE-C3 overexpressing cells without WP1066 treatment as we described above (Figure 3E). Meanwhile, the effects of MAGE-C3 on migration and invasion were attenuated after WP1066 treatment (Figure 3F). Taken together, our findings reveal that MAGE-C3-mediated promotion of tumor migration and invasion is partially dependent on STAT3.
3.4 MAGE-C3 repressed antitumor immunity responses and regulated cytokine secretion by T cells
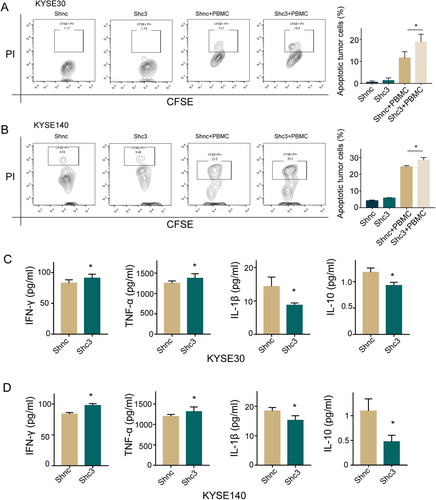
Successful metastatic spread requires cellular mobility and immune escape, which suggests a potential link between tumor metastasis and immune resistance [11]. To examine whether MAGE-C3 assists tumor cell evasion from immune monitoring and destruction, we performed we performed lymphocyte-mediated cytotoxicity assays to visualize the function of MAGE-C3 in tumor immune suppression. After co-cultured with T cells, MAGE-C3 knockdown KYSE30 or KYSE140 cells exhibited a significantly higher percentage of PI+ CFSE-labeled tumor cells (Figures 4A and 4B), reflecting high T-cell-mediated tumor cell killing. We also measured the levels of T cell-related cytokines and found that T cells that were co-cultured with MAGE-C3 knockdown cells had increased TNF-α and IFN-γ secretion in the culture medium, while they exhibited decreased IL-1β and IL-10 release (Figures 4C and 4D). These findings demonstrate that MAGE-C3-mediated suppression of antitumor immune responses might affect tumor-reactive T cell functions in ESCC.
3.5 MAGE-C3 facilitated IFN-γ signaling
To investigate the mechanism of MAGE-C3-mediated resistance to T cell-induced cytotoxicity, we next employed RNA-seq in MAGE-C3 overexpressing KYSE30 cells and empty vector cells (Supplementary Figure S3A). Gene ontology (GO) enrichment analyses showed that the most altered pathways in MAGE-C3 overexpressing cells were IFN response pathways (Figure 5A). We also performed RNA-seq in MAGE-C3 knockdown KYSE30 cells and control cells and found that differentially expressed genes were also enriched in terms of canonical IFN-γ signaling (Supplementary Figure S3B and C).
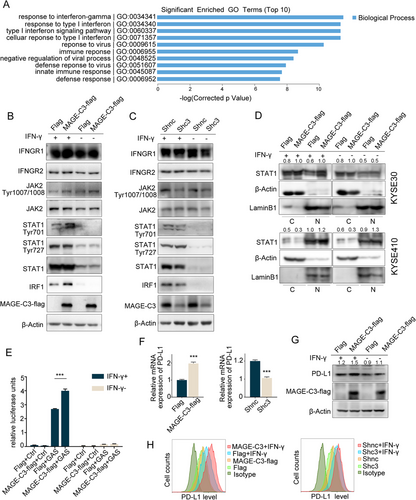
Next, we treated KYSE30, KYSE140 and KYSE410 cells with various concentrations of IFN-γ and measured phosphorylated STAT1 (pSTAT1Tyr701 and pSTAT1Tyr727) levels to evaluate the activation of IFN-γ pathway. As shown in Supplementary Figure S4, KYSE30 and KYSE410 cells, but not KYSE140 cells, were sensitive to IFN-γ treatment. Notably, MAGE-C3 levels were unaltered in response to IFN-γ treatment. Consistently, enhanced IFN-γ signaling was confirmed in MAGE-C3 overexpressing cells, as indicated by increased levels of phosphorylated JAK2, pSTAT1Tyr701 and IRF1 (Figure 5B). In contrast, the levels of phosphorylated JAK2, pSTAT1Tyr701 and IRF1 were reduced in MAGE-C3 knockdown cells (Figure 5C). However, the pSTAT1Tyr727 level remained unchanged. Subsequently, we performed nuclear and cytoplasmic extraction assays to determine the STAT1 subcellular distribution in MAGE-C3 overexpressing cells. Nuclear accumulation of STAT1 was increased in MAGE-C3 overexpressing KYSE30 and KYSE410 cells with or without IFN-γ treatment (Figure 5D). Immunofluorescence assays showed increased nuclear accumulation of STAT1 in MAGE-C3 overexpressing cells treated with IFN-γ (Supplementary Figure S5). Furthermore, we found that MAGE-C3 overexpression promoted IFN-γ-inducible gene transcription, as determined by a GAS luciferase reporter assay (Figure 5E). These results suggest that MAGE-C3 facilitates the activation of IFN-γ signaling.
PD-L1, which plays a crucial role in the immune escape, is a downstream element of IFN-γ signaling [30]. We found that CD274 (encoding PD-L1) was among the differentially expressed genes identified via RNA-seq (data not shown). Interestingly, the mRNA, protein, and membrane levels of PD-L1 were positively associated with MAGE-C3 expression (Figures 5G and 5H). These findings suggest that MAGE-C3 can activate IFN-γ signaling pathway and upregulate PD-L1 expression.
3.6 MAGE-C3 strengthened the interaction between IFNGR1 and STAT1 to activate IFN-γ signaling
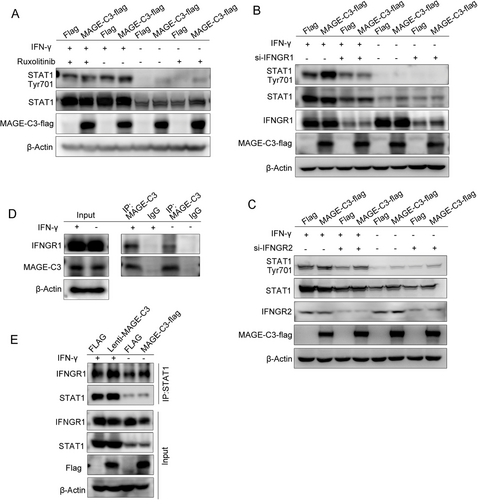
To determine which component of the IFN-γ pathway is directly regulated by MAGE-C3, we treated MAGE-C3 overexpressing KYSE30 and KYS410 cells with the JAK1/2 inhibitor Ruxolitinib before adding IFN-γ. We found that pSTAT1Tyr701 expression levels were unchanged following cell exposure to Ruxolitinib (Figure 6A and Supplementary Figure S6A). These data suggest that MAGE-C3 might act on the upstream elements of JAKs. We then used IFNGR1- and IFNGR2-targeted siRNAs to investigate whether IFN-γ receptors were involved. As shown in Figure 6B and Supplementary Figure S6B, the upregulation of pSTAT1Tyr701 in MAGE-C3 overexpressing cells were attenuated when IFNGR1 levels were depleted in the presence of IFN-γ, whereas the function of MAGE-C3 was not affected after IFNGR2 knockdown (Figure 6C and Supplementary Figure S6C), suggesting that the effect of MAGE-C3 on STAT1 was mediated by IFNGR1. Next, we performed immunoprecipitation assays and found that MAGE-C3 was associated with IFNGR1 either in the presence or absence of IFN-γ stimulation (Figure 6D and Supplementary Figure S6D). Previous study suggested that IFNGR1 together with IFN-γ and STAT1 can translocate to the nucleus as a macromolecular complex, following IFN-γ activation [31]. Therefore, co-immunoprecipitation assays were used to test the interaction between IFNGR1 and STAT1 after overexpressing MAGE-C3. The results showed that MAGE-C3 greatly enhanced the interactions between IFNGR1 and STAT1 either in the presence or absence of IFN-γ (Figure 6E and Supplementary Figure S6E). Taken together, our findings demonstrate that MAGE-C3 binds to IFNGR1 and strengthens the interaction between IFNGR1 and STAT1 to activate IFN-γ signaling.
3.7 MAGE-C3 promoted tumor progression through PD-L1-involved immunosuppression in vivo
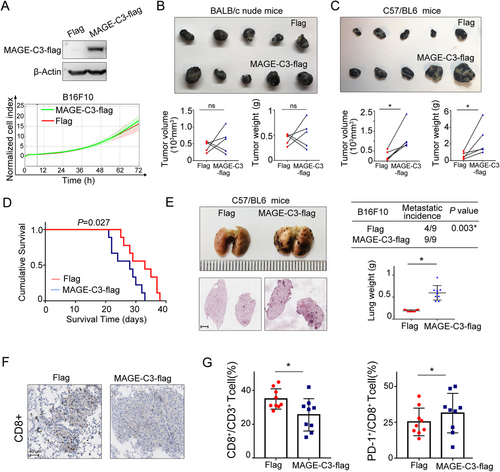
Melanoma is one of the most suitable models for studying immune therapy. Since the murine ESCC cell line was not available at present, we established stable MAGE-C3 overexpressing murine melanoma cells B16F10 to confirm the function of MAGE-C3 in vivo (Figure 7A). Consistent with our above results, MAGE-C3 overexpressing did not significantly alter cellular proliferation (Figure. 7A). Subsequently, the tumorigenicity of MAGE-C3 overexpressing B16F10 cells was examined in immunodeficient BALB/c nude mice and immunocompetent C57/BL6 mice. There was no significant effect of MAGE-C3 on tumor growth in nude mice after subcutaneous injection (Figure 7B). However, in C57/BL6 mice, tumor weight and volume dramatically increased in the MAGE-C3 overexpression group compared with those in the control group in C57/BL6 mice (Figure 7C). Mice bearing MAGE-C3 overexpressing tumors displayed shorter survival (Figure 7D). These results suggest that the integrated immune microenvironment is crucial for MAGE-C3 to promote tumor progression. Additionally, C57/BL6 mice injected with MAGE-C3 overexpressing cells developed severe lung metastasis and had much heavier lung weights than those of the control group (Figure 7E). Furthermore, immunohistochemistry and flow cytometry analysis showed that the infiltrated CD8+ T cell population was decreased in lung metastasis of MAGE-C3 overexpressing mice (Figure 7F). Because MAGE-C3 activated the IFN-γ pathway and upregulated PD-L1 levels, we further detected PD-1+CD8+ T cells among tumor-infiltrating CD8+ T cells in lung metastasis. Interestingly, the percentage of PD-1+CD8+ T cells was increased in MAGE-C3 overexpressing mice (Figure. 7G). Collectively, these findings suggest that MAGE-C3 promotes tumor progression through PD-L1-involved immunosuppression.
4 DISCUSSION
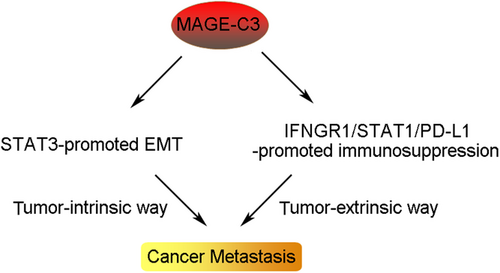
Tumor-intrinsic and -extrinsic mechanisms that dictate metastatic behaviors have been extensively studied with the increased tumor metastasis researches. However, the molecular mechanisms underlying the distinct courses of the metastatic steps require further investigation. In this study, we identified a novel crosstalk mechanism in enhancing tumor metastasis by activating oncogenic transformation and altering the tumor microenvironment. We demonstrated that MAGE-C3 potentiated STAT3-mediated EMT and PD-L1-induced immunosuppression, resulting in the promotion of tumor metastasis (Figure 8). Additionally, we found that MAGE-C3 was positively correlated with poor survival and tumor metastasis in ESCC.
EMT plays an important role in the specific steps of tumor metastasis. Moreover, a strong correlation between the EMT and expression levels of some immunosuppressive target genes has been demonstrated [11]. Previous studies showed that Snail-induced EMT accelerated cancer metastasis by enhancing invasion and inhibiting antitumor immunity [32]. TGF-β is generally considered an EMT inducer, but increased TGF-β levels in colorectal cancer led to T cell exclusion and blocked acquisition of the Th1-effector phenotype [12]. These findings prompted us to explore whether MAGE-C3 modulates the immune response. In the present study work, we found that downregulation of MAGE-C3 induced tumor cells to become more sensitive to T cell-mediated ablation. Additionally, we found that T cell function was impaired, as determined by measuring T cell cytokine levels (IL-1β, IL-10, TNF-α, and IFN-γ) in MAGE-C3 knockdown ESCC cell/T cell co-cultures. Although IL-2 levels increased in MAGE-C3 knockdown KYSE30 cell/T-cell co-cultures and MAGE-C3 knockdown KYSE140 cell/T cell co-cultures, the difference was not statistically significant. These phenotypes suggest that an extrinsic role of MAGE-C3 in immunosuppression on tumor cells is linked to its role in EMT induction. Furthermore, the components of tumor microenvironment should be considered. In particular, some tumor-infiltrating inflammatory cells have also been shown to induce EMT and promote immunosuppression [33]. These findings imply a complex relationship between metastasis and immune regulation in vivo.
Genomic alterations in IFN-γ pathways, such as loss-of-function mutations in JAK1 and JAK2 or deficiency of IFNGR2, induce resistance to PD-1-PD-L1 checkpoint blockade [34-36]. Three CRISPR screens have identified that proteins relevant to immunotherapy resistance mostly participate in IFN-γ signaling. These researches highlight the biological importance of the intact components of IFN-γ signaling [30]. When IFN-γ binds to tumor cells with high MAGE-C3 expression, IFN-γ signaling was stronger than that in tumor cells with low MAGE-C3 expression. Despite knockdown of IFNGR2, which is an IFN-γ receptor, the forced upregulation of MAGE-C3 enhanced the activation of the IFN-γ pathway in our study. Thus, we conclude that MAGE-C3 is likely an important mediator of IFN-γ signaling, which resembles prolonged IFN-γ induction. It is well accepted that prolonged exposure to IFN-γ can induce diverse T cell exhaustion and tumor progression because tumor cells upregulate immune escape checkpoints such as indoleamine 2,3-dioxygenase 1 (IDO1) and PD-L1 [37, 38]. Recent research has identified that MAGE-A uniquely predicts resistance to the blockade of CTLA-4 [39]. Thus, the protein expression level of MAGE-C3 in patients may contribute to the evaluation of the susceptibility of immune checkpoint inhibitors sowing the noteworthy role of IFN-γ in immune checkpoint blockade.
Another interesting finding in this study is that MAGE-C3 was found to interact with IFNGR1 in the absence of IFN-γ, and the interaction became stronger in the absence of IFN-γ. IFNGR1 is directly silenced by EZH2 in MYC-driven prostate cancer cells [40]. The IFNGR1 protein is stabilized by the loss of ELF5-FBXW7 in breast cancer [41]. Here, we observed no significant changes in IFNGR1 expression in MAGE-C3 overexpressing or MAGE-C3 knockdown cells. Therefore, MAGE-C3 strengthened the interaction between IFNGR1 and STAT1. Previous evidence showed that IFNGR1 translocated to the nucleus with IFN-γ and STAT1 [31], but the fate of MAGE-C3 after IFNGR1 translocation was unclear in our work and should therefore be further explored. Nevertheless, our identification of an interaction between MAGE-C3 and IFNGR1 provides an avenue for the modulation of IFN-γ signaling in tumors and IFN-γ-related inflammatory diseases.
5 CONCLUSIONS
In summary, our results identified that MAGE-C3 promotes tumor metastasis not only through EMT but also by protecting tumors from immunosurveillance, which highlights the potential of MAGE-C3 as a prognostic marker and therapeutic target.
DECLARATIONS
ETHICS APPROVAL AND CONSENT TO PARTICIPATE
The study protocol was approved by the ethics committee of Peking University Cancer Hospital & Institute (permit number: 2020KT132). The tissue samples were obtained with written informed consent from each patient. The animal study was carried out in compliance with the guidance suggestion of Animal Care Committee of Peking University Cancer Hospital & Institute (permit number: EAEC2020-16).
Human ESCC samples were provided by Shanghai National Engineering Research Center of Biochip. Written informed consent was obtained from all patients prior to the study. The use of the clinical specimens for research purposes was approved by the Institutional Research Ethics Committee of Peking University Cancer Hospital.
CONSENT FOR PUBLICATION
Not applicable.
AVAILABILITY OF DATA AND MATERIALS
Data of this study are available within the article and its supplementary information files.
COMPETING INTERESTS
The authors declare that they have no competing interests.
AUTHORS’ CONTRIBUTIONS
Conceptualization: Q.Z., Q.W., W.Z.
Experiments design: Q.W., W.Z.
Methodology: Q.W., Y.W.
Formal analysis and investigation: Q.W., W.Z. Q.M.
Writing original draft preparation: Q.W., W.Z.
Review and editing: Q.Z. Q.W.
Material preparation and data collection: Q.W., Y.W., H.Z., D.Z.
Supervision: Q.Z.
All authors read and approved the final manuscript.
ACKNOWLEDGEMENTS
This study was supported by grants from the National Natural Science Foundation of China (81988101, 81830086, 82003007 and 81802780), CAMS Innovation Fund for Medical Sciences(2019-I2M-5-081), Guangdong Basic and Applied Basic Research Foundation (2019B030302012), the Funding by Major Program of Shenzhen Bay Laboratory (S201101004), Project funded by China Postdoctoral Science Foundation (2019M6603068) and Science Foundation of Peking University Cancer Hospital (2020-16).


