Thermo-Mechanical Degradation Kinetics of a High-Density Poly(Ethylene) Using a Closed-Cavity Rheometer
Funding: The authors received no specific funding for this work.
ABSTRACT
Mechanical recycling of polymers is an essential aspect to achieve circular economy. High shear stress, excessive temperature, and long residence time during reprocessing cause thermo-mechanical degradation of the polymer. Therefore, it is important to understand and quantify this degradation kinetics. Common ways to simulate degradation are very time and material consuming and clear insights into the respective influence of temperature and shear stress on degradation are rare. Within this publication a method is developed using a commercially available, close-cavity rheometer to emulate processing conditions in a defined way. This allows monitoring and predicting the behavior of a high-density polyethylene (HDPE) and quantify degradation kinetics and changes in the polymer topology. HDPE is selected as a model polymer due to its large production and wide range of applications. Different treated samples are analyzed by various rheological methods. Additionally, molecular characterization is conducted. A kinetic model to predict the changes in the molecular weight as a function of in-phase shear stress, temperature and duration during treatment is presented. The calculated activation energy for the initiation reaction agrees with the activation energy for HDPE degradation from thermogravimetric analysis. This activation energy is lowered by in-phase shear stress, modified by a factor of 1.7 m3 mol−1.
1 Introduction
In order to promote sustainability and to reduce the consumption of fossil fuels it is important to develop further insights towards a circular economy of polymer materials [1]. Mechanical recycling is one of the most efficient ways to achieve this, but it involves multiple melting and reprocessing of the polymer material. The reprocessing can degrade the polymer both thermally and mechanically and consequently might cause poor solid mechanical properties during multiple usage. The thermo-mechanical degradation of the polymer is caused by the high processing temperatures (T = 170°C–300°C for high-density polyethylene, HDPE) [2-4], high shear stress (approximately 10–100 kPa) [5], and long residence times during processing (up to 5 min) [2, 6] in an extruder.
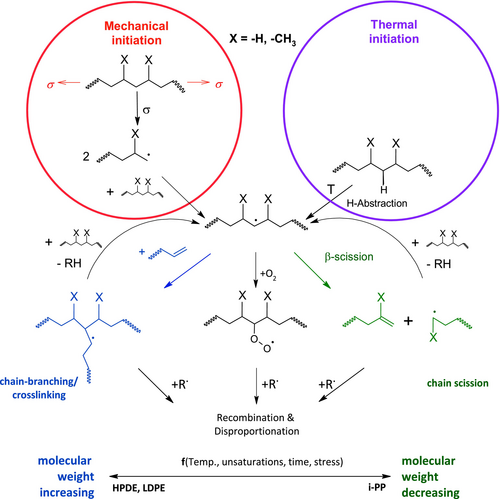
Known mechanisms of polyolefin degradation are shown in Figure 1. First, macroradicals form due to thermo-mechanical treatment, leading to abstraction of protons [7-10]. It is also known that these macroradicals arise from temperature induced H-abstraction [11, 12]. These radicals can cause chain scission or chain branching [13]. Several studies consider that only the type of monomer and therefore the substituent X (H, CH3) on the polymer chain is responsible for the dominant reaction during degradation, for example for poly(ethylene) (PE) branching is predominantly observed, whereas poly(propylene) (PP) predominantly displays chain scission [13]. However, other studies found that the reaction rate of the branching of polyethylene also depends on the concentration of unsaturated groups on the polymer (e.g., vinyl groups), which are still present after polymerization [6, 14]. This unintended functional groups in HDPE depend, for example, on the catalyst used [6, 15, 16].
It is common in the literature to investigate these phenomena via multiple extrusion of the material in a circular process to emulate the multiple processing steps and their influence on melt and solid polymer properties. This was shown by studies of different PE variants, for example, high-density polyethylene, HDPE [2-4, 6, 15, 17-21], low-density polyethylene, LDPE [4, 7, 21-23], and linear low-density polyethylene, LLDPE [14, 24]. Oblak et al. investigated the reprocessing of HDPE over 100 cycles [17] and found a strong reduction (−51%) of the weight-average molecular weight (Table 1) using high-temperature size exclusion chromatography (HT-SEC). This approach requires a lot of time and material to emulate the reprocessing, especially if the processing parameters are varied. One common way to solve this problem is to use an internal mixer [25, 26] or a continuously working extruder [27]. Doing so it is difficult to make clear predictions on the influence of the different parameters, for example, temperature, residence time, shear stress, and so forth, in an extruder. Specifically, the effect of the shear stress and the residence time is difficult to quantify because of a complex flow behavior within the extruder barrel. Therefore, only average values can be given using assumptions and simplifications for the extrusion process.
| Authors | T melt (°C) | Type of extruder | Processing duration (min) | Change in M w (%) | Stabilizer | Lit. reference |
|---|---|---|---|---|---|---|
| Langwieser et al. | 220 | Single screw | 18 a | +/−0 | Processing and AO | [4] |
| Pinheiro et al. | 240 | Twin screw (co-rotating) | 7.5 | +17 | None | [25] |
| Pinheiro et al. | 240 | Internal mixer | 60 | +21 | None | [6] |
| Oblak et al. | 240 | Twin screw (co-rotating) | 300 a | −51 | UV | [17] |
| Schweighuber et al. | 220 | Twin screw | 120 | −92 | None | [27] |
| Moss et al. | 240 | Single screw | 15 a | +17 | None | [16] |
- Note: Column “stabilizer” gives information about the polymer antioxidants (AO), UV-stabilizers (UV), and processing stabilizers (processing) used.
- a Estimated from given parameters within the article.
To avoid the complexity of the flow field within an extruder, a device is needed that applies a defined type of flow and specific, practically relevant shear rates (i.e., = 1–100 s−1) at a fixed and defined temperature (i.e., T = 170°C–300°C). Custom-built devices, which are used to apply high shear stress, can also be found in literature [28, 29]. Additionally, commercially available rheometers have been used to apply thermo-mechanical treatment to different polymers [30-34]. Tikhomirov et al. used a standard Mooney viscometer to study the degradation reactions of styrene-butadiene rubber (SBR, unknown M w and Ð) under a fixed shear stress (up to 114 arbitrary Mooney units) and temperature range (T = 100°C–120°C) [30]. Kaneyasu et al. used an open oscillatory shear (cone-plate) rheometer for degradation of a HDPE (M w = 157 kg mol−1, Ð = 5.7). This has the advantage that changes in elastic and viscous modulus G′ and G″, respectively, during degradation can be studied and quantified online. The authors used shear rates up to = 100 s−1 at a temperature of T = 180°C for t = 10 min. They did not observe any detectable change in the structure of the polymer via the rheological and SEC data [31]. The group of Münstedt [32-34] used a different approach to determine the thermal stability of different polyethylene. They conducted time sweeps in an oscillatory rheometer over extended duration (up to t = 28 h) at different temperatures (T = 130°C–190°C) in nitrogen atmosphere and determined a change in the storage modulus G′ (normalized change < 5% for 106 s for LDPE) for these polyethylene polymers [32-34]. They used only low angular frequencies (up to ω = 0.32 rad s−1) in the linear viscoelastic (LVE) regime, and thus did not study the mechanical influence on degradation, but they tested only thermal degradation.
The focus of this publication is on the method development using a closed-cavity rheometer for studying the thermo-mechanical degradation kinetics of polymer melts. Closed-cavity rheometers (CCR) can apply defined shear rates and high shear strains at defined temperature similar to extrusion for a defined time. Furthermore, this set-up prevents wall slippage and edge fracture for low viscous polymers due to their grooved plates and closed cavity, even at high shear strains, temperature and pressure [35]. The influence of oxygen is limited due to the sealing. Within this study, a CCR (Scarabaeus SIS V50, TA Instruments) was used to apply thermo-mechanical treatment using high shear strains (γ o = 27%–460%) at typical processing temperatures (T = 160°C–220°C) to quantify the time evolution on the HDPE sample. This specific HDPE was selected due to its wide range of usage, large production and presence in potentially recycled polyethylene. This article explores the use of this specific set up to study thermo-mechanical degradation applied via a CCR to quantify degradation kinetics.
2 Materials and Methods
2.1 Materials and Preparation
The investigated material is a commercially available unimodal HDPE with a broad molecular weight distribution (Table 2). It was polymerized using a Philips catalyst and is typically processed by blow molding, for products like packaging and engineering goods. This HDPE was chosen due to its wide range of applications and final solid mechanical properties. As a commercial product it contains 0.1%–0.5% of antioxidants. A polyethylene without antioxidants was not chosen because this would not reflect any practical use like mechanical recycling.
| Material | M w (kg mol−1) | Ð (-) | T m,peak (°C) | Crystallinity a (%) | |η*|0 at 180°C (Pa s) | ρ at 25°C (g cm−3) | MFI (190°C, 2.16 kg) (g [10 min−1]) |
|---|---|---|---|---|---|---|---|
| HDPE | 113.2 | 9.8 | 132.0 | 66.4 | 9.6 × 10⁴ | 0.950 | 0.25 |
- a Using a melting enthalpy for 100% crystalline PE of 293 J g−1.
The test specimens are prepared by pressing the HDPE at T = 200°C and p = 20 MPa for t = 5 min and then punching out a disk (weight of the specimen m = 2.5 g). The temperature T = 200°C was chosen to ensure fast relaxation of the polymer chains during the pressing.
2.2 Thermo-Mechanical Treatment and Rheological Measurements
The measurements were conducted using a closed-cavity rheometer (CCR, Scarabaeus, Model SIS V50), an oscillatory rheometer with biconical, grooved plates, and a sealed cavity, which prevents wall slippage and edge fracturing [35]. Hence, high shear strains up to γ o = 460% at ω/2π = 1 Hz can be reached. This geometry is important to emulate the high shear stress during processing. The rheometer's temperature limit is T = 220°C and shear rates up to = 80 s−1 can be carried out.
The procedure of the thermo-mechanical treatment is shown in Figure 2. The treatment lasts 75 min in the closed geometry and is followed by a rest of 20 min in the still closed geometry at T = 180°C. The resting time provides relaxation of the molecules to reduce any effect of the high shear strains (i.e., memory effects) on the LVE-measurement [36]. It will be shown later, that there is no significant change in molecular weight during this rest. Afterwards, a measurement in the linear viscoelastic regime (LVE) is conducted to determine the rheological properties. This procedure is then repeated three more times to ensure a total treatment time of 4 × 75 min = 300 min. This time duration is chosen as an equivalent of about 60–100 reprocessing events within the extruder each with a typical residence time of about t = 3–5 min (see Figure 2). The temperature conditions are chosen to be within the recommended processing range, according to the material data sheet. The shear strain is varied to cause mechanically induced chemical change of the polymer chain. A frequency of ω/2π = 1 Hz is chosen as a compromise between high shear stress and the online detection of rheological change. According to Debbaut and Burhin, the shear field inside the cavity is homogeneous [37]. All steps were conducted at an internal pressure of p = 1 MPa on the sample [38] within the CCR. This pressure is much less compared with pressures prevail during extrusion (range of tens MPa). Therefore, the influence of pressure on thermo-mechanical treatment (e.g., influence of pressure on degradation) cannot be evaluated within this setup.

This analysis was conducted at different samples at temperatures T treat of 160°C, 180°C, 195°C, 210°C, and 220°C, all at a shear strain γ 0,treat of 28%, 70%, 153%, 370%, and 460%. A new specimen was used for each set of conditions of T treat and σ′treat. Elongation rheology experiments were conducted at 150°C for the virgin and treated HDPE-samples using the extensional viscosity fixture (EVF) at an ARES G2 both from TA instruments. The Hencky rates were varied between = 0.1 and 10 s−1.
2.3 High-Temperature Size Exclusion Chromatography
The molecular weight distribution (MWD) before and after the described thermo-mechanical treatment was investigated by means of a high-temperature size exclusion chromatography (HT-SEC). A sample was cut out of the edge of the degraded sample. It is shown in the results, that there is no significant oxidation even at the edge of the sample. The sample was dissolved in 1,2-dichlorobenzene to reach a concentration of 0.5 g L−1. About 200 μL of this solution was injected and analyzed at a flow rate of 2 mL min−1 and at a temperature of 160°C. The polymer was analyzed with an infra-red (IR) detector, which was calibrated with linear PE standard. The used IR-detector measured absorption of the CH2-groups at 2920 cm−1.
2.4 Fourier-Transform Infrared Spectroscopy
Fourier-transform infrared spectroscopy (FTIR) is used to investigate degradation of the polyethylene by monitoring the change in the vinyl and carbonyl functional groups. The samples were cut out of the edge of the treated samples and films were pressed at 150°C and 110 bar for 5 min and then cooled with 10 K min−1, resulting in a measured thickness of the film of d = 70 μm. The analysis was carried out in transmission at room temperature using a Bruker Vertex 70 with a DTGS detector. The applied spectral resolution in the IR spectra was 2 cm−1. The influence of data scattering is reduced by similar sample preparation and the use of spectral baseline correction [40]. Details of the baseline correction are described in the literature mentioned below.
Although various functional groups can be studied for quantification of the degradation [41], here, the focus was on the vinyl groups (CHCH2), which indicate the dominant reaction behavior of the HDPE (chain scission or crosslinking) [18, 24, 25, 41, 42], and the carbonyl groups (CO), which quantifies the degree of oxidation occurring to the polymer [43, 44]. The method described by Almond et al. [43] and an adapted method from Mendes et al. [42] were chosen to calculate the carbonyl index (COI) and the vinyl index (VI), respectively. Almond et al. compared many different methods of calculating COI and found that calculating the summed up integral of different oxidation related peaks (from 1650 to 1850 cm−1) is the most reliable way of determining COI. The VI is calculated by the integration of the spectrum between 875 and 925 cm−1 (related to the vinyl absorption peak at 910 cm−1). Both integrals were normalized to the area of the peak of the CH2-scissoring between 1420 and 1500 cm−1.
2.5 Isothermal Oxidation Incubation Time
The isothermal oxidation incubation time (OIT) determines the resistance of the HDPE to oxidation and therefore it can indicate the relative amount of active antioxidants. The OIT was determined using a Netzsch Polyma DSC. For this, 10 mg of a sample were heated to 200°C at 10 K min−1 at nitrogen atmosphere (40 mL min−1). After a conditioning of 2 min, an oxygen gas flow (40 mL min−1) was injected to oxidize the HDPE. The OIT was determined according to ISO 11357.
3 Theory and Calculation
A kinetic model is suggested to quantify the influence of temperature T treat, time t treat, and in-phase shear stress σ′treat on the change in molecular weight due to thermo-mechanical treatment.
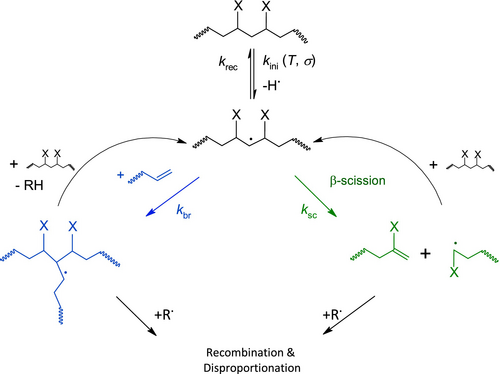
Goldberg and Zaikov [7] assumed that degradation of polyolefins is a competition between crosslinking and chain scission. A simplified version of Figure 1 displays this (see Figure 3). The generation of macroradicals from thermo and mechanical reaction is merged to one initiation reaction k ini for easier calculation. Furthermore, oxidation is neglected since no significant increase in COI (see later) can be seen.
4 Results and Discussion
4.1 Rheological Measurements on Virgin HDPE
In this article, the thermo-mechanical treatment is studied for a specific HDPE sample using a closed-cavity rheometer (CCR). As described earlier, changes in rheological data are measured by the described treatment in LVE regime. There are various values, which can be used to monitor a change in the average molecular weight via the following parameters: zero shear viscosity |η 0*|, the pivot point of the complex viscosity versus angular frequency, and the crossover angular frequency ω c [46, 47]. Linear polyethylene shows a low flow activation energy (E a,flow = 22–30 kJ mol−1), which increases up to 80 kJ mol−1 with the amount of branching [48] (here, E a,flow ≈ 35 kJ mol−1). Additionally, it shows a rather narrow temperature window for the measurement since crystallization and degradation limit the usable temperature regime (T melting < T measurement < T degradation) [49]. Because of these two reasons, a calculated mastercurve using time temperature superposition (TTS) does not broadly expand the range of angular frequency, which can be measured in a fixed time.
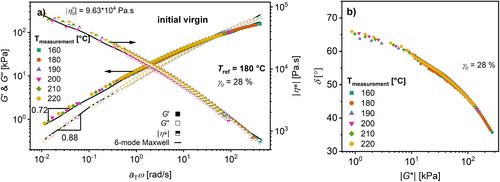
The mastercurve (calculated using TTS) of G′ and G″ of the virgin HDPE is shown in Figure 4a. The Maxwell parameters for this material are shown in Table 3. The so called van Gurp–Palmen-plot (loss angle δ as a function of the absolute value of complex modulus |G*|) [50, 51] in Figure 4b clarifies that TTS is applicable because the curve appears continuous and its derivative is continuous. As Figure 4a shows, the plateau for the absolute value of the complex viscosity|η*| at low ω = 0.01 rad s−1 is not reached. The slopes of d(log(G′)) over d(log(ω)) = 0.88 and d(log(G″)) over d(log(ω)) = 0.72 confirm this. Consequently, the determination of |η 0*| and the pivot point would be inaccurate. Hence, the change in the ω c and the G c will be investigated to analyze potential changes in the molecular weight and the molecular weight distribution, respectively (Table 3).
| Modulus g i (kPa) | Relaxation time λ (s) |
|---|---|
| 336 | 2.1 × 10⁻³ |
| 93 | 2.3 × 10⁻² |
| 24 | 0.21 |
| 8.0 | 1.3 |
| 2.2 | 11 |
| 0.51 | 1.0 × 10² |
4.2 Rheological Investigations During and After the Thermo-Mechanical Treatment
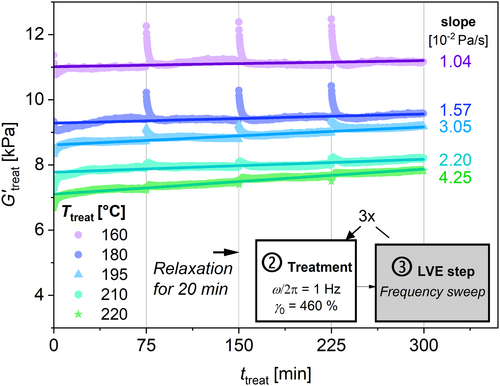
During the thermo-mechanical treatment (see Figure 2), G′treat(ω/2π = 1 Hz) can be measured online as a function of time, t treat for defined temperature T treat = (160°C–220°C) and applied shear strain γ 0,treat = (28%–460%). As can be seen in Figure 5, G′treat increases with time for all temperatures. The slope of G′treat with respect to t treat increases from 1.04 × 10⁻² Pa s−1 for T treat = 160°C to 4.25 × 10⁻² Pa s−1 for T treat = 220°C at the given frequency and amplitude, which is approximately a factor of four. However, these data are not adequate for quantitative analysis, because all measurements shown in Figure 5 are conducted in the nonlinear viscoelastic regime. Additionally, higher T treat results in the applied frequency shifting toward to the terminal regime and the measurements at higher T treat might be more sensitive to changes in the molecular weight.
Additionally, ω c and G c were determined with a frequency sweep in the LVE between and after the treatments, for temperatures from T treat = 160°C–220°C. Figure 6 shows the results of treatments at T treat = 220°C under (a) a low σ′treat = 6.1 kPa and (b) a high σ′treat = 34.9 kPa, which correspond to the highest and lowest amplitudes, respectively. Note that the average σ′treat is used to quantify this parameter.
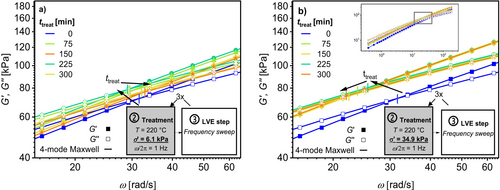
The results for normalized ω c relative to ω c,0 (ω c/ω c,0) as a function of t treat are shown in Figure 7 for (a) T treat = 220°C and (b) T treat = 180°C. Figure 8 shows the normalized G c relative to G c,0 (G c/G c,0) under the same conditions. Selected procedures were repeated three times with new samples to quantify reproducibility. These results are shown with their respective standard deviations. The results for the other studied temperatures can be found in the Supporting Information. The result after the extrusion of the HDPE is provided in the caption of this figure. This is because no uniform σ′treat can be calculated for extrusion.
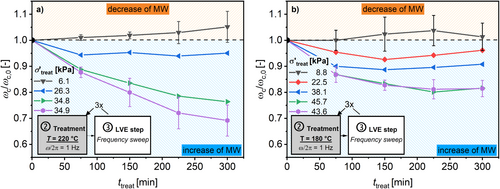
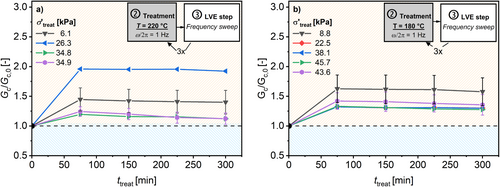
The evolution of ω c/ω c,0 strongly depends on the σ′treat. The higher the σ′treat the greater the decrease in resulting ω c/ω c,0. Additionally, the higher the T treat also the higher the decrease in ω c/ω c,0. This decrease in ω c/ω c,0 indicates a detectable increase in the measured molecular weight. Therefore, the resulting molecular weight should be a function of T treat, t treat, and σ′treat. Figure 9 summarizes the resulting ω c with respect to the applied σ′treat after t treat = 300 min. It can be observed that ω c decreases with higher σ′treat for temperatures from 160°C to 220°C, as expected from Equations (4) and (5).
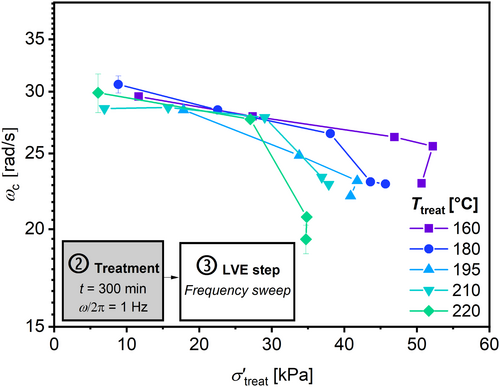
This observation can be explained by an increased rate of the dominant reaction (here chain branching) due to a higher rate of the initiation reaction, which is influenced by σ′treat according to Equation (4). The related reaction kinetics are discussed and quantified below.
Trinkle and Friedrich used the van Gurp–Palmen-plot (δ vs. |G*|) to analyze the polydispersity Ð and long-chain branching (LCB) molecular architecture of polyolefin (HDPE, PP) melts [50, 51]. Figure 10 shows the van Gurp–Palmen-plot for the same samples as those in Figure 6 (results at further T treat be found in Figure S3). The sample that was exposed to σ′treat = 34.9 kPa and T treat = 220°C (b) shows a decrease in the loss angle δ of 3° at low |G*| = 10 kPa. The loss angle of the sample exposed to low σ′treat = 6.1 kPa (a) displays no detectable change.
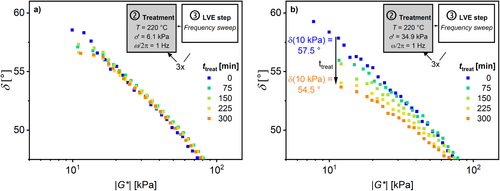
A decrease in the loss angle δ can result from an increase in Ð as well as from an increase in long-chain branching (LCB) of the polymer [50, 51]. The HT-SEC results (see below) do not show an increase in Ð of all samples. Hence, the decrease in the loss angle δ in the van Gurp–Palmen-plot indicates an increase in the LCB content. Measurements using HT-SEC coupled to a multiangle light scattering (MALS-) detector would be necessary to address this hypothesis [52].
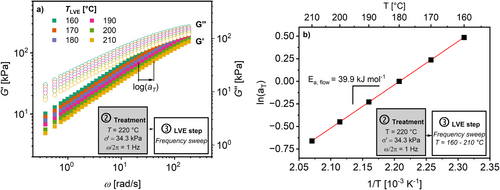
The activation energy of flow, E a,flow, is used to assess the change in molecular structure after each treatment and to confirm this hypothesis. Therefore, the shift factor log(a T ), which results from calculating the mastercurve in the LVE regime, is used [53]. This is shown in Figure 11a. The shift factor log(a T ) is related to the inverse temperature by applying a simple Arrhenius equation [54]. The flow activation energy is defined as the slope of ln(a T ) with respect to T −1 (in K−1) multiplied by the universal gas constant (R = 8.314 J mol−1 K−1) (Figure 11b). Figure 12 shows the flow activation energy E a,flow for the samples after the thermo-mechanical treatment. The result after the extrusion of the HDPE is provided in the caption of this figure.
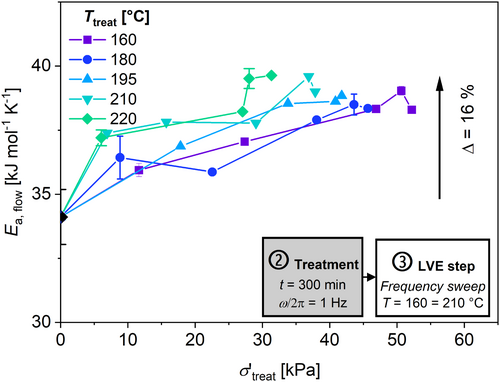
An increase in E a,flow of up to 16% can be observed after a treatment at higher σ′treat for all T treat. According to the literature, an increase in the activation energy indicates a higher degree of branching [54-57]. To compare this results shows Table 4 the E a,flow from the literature, where changes in E a,flow due to LCB are studied for various HDPEs.
| Authors | E a,flow (HDPE, linear) and E a,flow (HDPE, LCB) (kJ mol−1) | Change in E a,flow (LCB) (%) | Change in LCB via 13C-NMR (ΔLCB [1000 C−1]) | Sample | Lit. reference |
|---|---|---|---|---|---|
| Bersted |
23.0 28.6 |
+14.5 | 0.02 | HDPE with 0.02% of peroxide | [55] |
| Wood-Adams et al. |
27.5 30.7 |
+11.6 | 0.011 | Diff. HDPE | [54] |
|
27.5 35.5 |
+29.1 | 0.016 | |||
| Stadler et al. |
27.5 38.0 |
+38.2 | Very low a | Diff. HDPE | [57] |
- Note: Change in flow activation energy of HDPEs with a defined concentration of LCB (determined by 13C-NMR) compared to the respective linear HDPE.
- a No numerical data are given in this article.
The measured increase in E a,flow and the decrease in the concentration of vinyl groups (see below) suggest that the treatment at a high stress leads to an increase in branching. Additionally, the results from the van Gurp–Palmen-plots and from elongation viscosity, which are shown later, suggest that the branching is long-chain branched (LCB).
4.3 Elongation Viscosity After Thermo-Mechanical Treatment
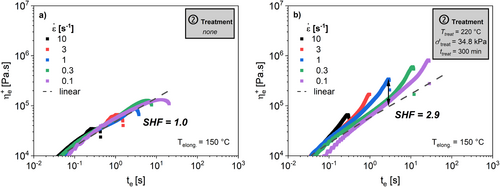
The results indicate that there is no significant strain hardening in the virgin HDPE. However, the samples subjected to the thermo-mechanical treatment in the closed-cavity rheometer show a SHF = 2.9. The extruded sample shows a SHF = 3.3. According to Ahirwal et al., these results confirm that thermo-mechanical treatment leads to an increase of long chain branching of this HDPE [58].
4.4 Molecular Characterization After Thermo-Mechanical Treatment
While a change in the rheological properties can be observed in situ after each treatment step, it is crucial to verify that these changes are based on changes in molecular weight or molecular topology rather than systematic effects arising from the polymer flow in the utilized rheometer or reversible effects after mechanical treatment, as reported in previous studies for branched polyethylene [59, 60]. High-temperature size exclusion chromatography (HT-SEC) and FTIR are established methods [3, 15, 16, 18, 25] for investigating polymer degradation on a molecular level. Another spectroscopic method to quantify branching is 13C-NMR [54, 61], which is not covered in this article.
4.4.1 HT-SEC and Correlation With Rheological Results
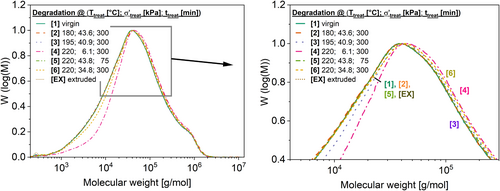
HT-SEC analysis was carried out for the virgin HDPE (ID 1), the extruded sample (ID EX) and for five different treated samples of the investigated HDPEs (ID 2 to 6). The results are shown in Table 6 and Figure 14. Table 6 demonstrates that all samples show a clear increase in M n and M w compared with the virgin HDPE. The samples with ID 4 and ID 6 show the highest increase in molecular weight. This increase of 12.8% for M n and of 11.2% for M w for the sample with ID 6 agrees with the literature data shown (Table 4), where increases of M w of around 17% are reported after multiple extrusion. These results confirm the rheological results that the thermo-mechanical treatment leads to an increase in molecular weight at certain conditions.
| ID | T treat (°C) | σ′treat (kPa) | t treat (min) | M n (kg mol−1) | Reproducibility (kg mol−1) | M w (kg mol−1) | Reproducibility (kg mol−1) | Ð (-) |
|---|---|---|---|---|---|---|---|---|
| 1 | — | — | — | 11.7 | ±0.3 | 108.1 | ±2.6 | 9.2 |
| 2 | 180 | 43.6 | 300 | 12.7 | — a | 117.5 | — a | 9.2 |
| 3 | 195 | 40.9 | 300 | 13.1 | — a | 120.0 | — a | 9.2 |
| 4 | 220 | 6.1 | 300 | 13.8 | ±1.7 | 119.5 | ±5.7 | 8.7 |
| 5 | 220 | 34.8 | 75 | 12.6 | ±0.2 | 116.5 | ±0.2 | 9.1 |
| 6 | 220 | 34.8 | 300 | 13.2 | ±0.2 | 120.6 | ±0.9 | 8.9 |
| EX | 190 b | 94.9 c | 35 | 12.7 | ±0.3 | 117.3 | ±2.6 | 9.2 |
- Note: Resulting number-average molecular weight M n, weight-average molecular weight M w, and dispersity Ð of virgin and treated HDPE. The results are the average from two HT-SEC measurements: The reproducibility is calculated as the difference between average and maximum value.
- a Samples were measured only once.
- b Temperature of melt during extrusion with parameters given in Chapter 2.1.
- c Shear stress calculated using Equation (2), as the total shear stress.
The values M n and M w (determined with HT-SEC) are correlated with the measured ω c in Figure 15a,b, respectively. There is a correlation of R 2 = 0.86 for ω c with respect to M n and R 2 = 0.84 for ω c with respect to M w (excluding sample ID 4) with the simplest scaling law determined for a reptating, linear polymer chain, which is an exponent of −3.4 as reported in the literature [47]. However, the sample ID 4 shows a larger deviation from this simple scaling law. Note, that this scaling law is expected for a linear monodisperse homopolymer [47]. Therefore, it would be useful to investigate the sample ID 4 using a HT-SEC connected to a MALS-detector to determine whether the deviation of the HT-SEC data from rheology is due to different branching structure of the sample [52].
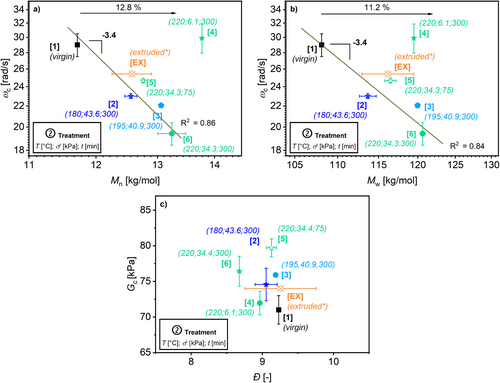
Figure 15b shows the measured crossover modulus G c against Ð determined by HT-SEC. No clear correlation between the data is observed. This might origin in the broad distribution of the investigated HDPE that showed only a minor change.
4.4.2 FTIR Spectroscopy
The use of FTIR gives insights into degradation mechanisms like chain scission, chain branching, and oxidation [18, 24, 25, 41-44]. The IR spectra of the virgin HDPE and after a treatment at T treat = 220°C, σ′treat = 34.8 kPa, and t treat = 300 min are given in Figure 16.
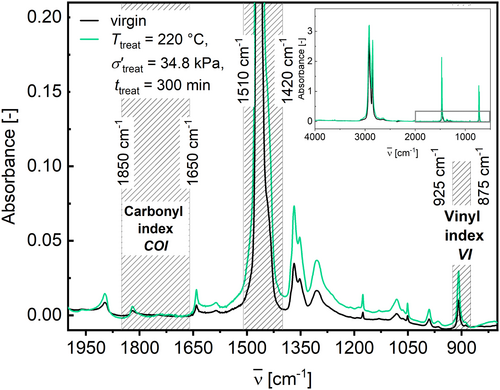
Figure 16 illustrates the spectral boundaries for the calculation of the vinyl index (VI) and the carbonyl index (COI) via spectral integration. The results are plotted against σ′treat in Figure 17 (a) for VI and (b) for COI.
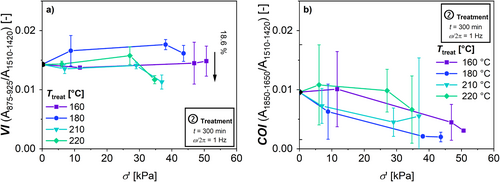
To analyze the dominant reaction VI is used. A decreasing VI indicates an increase in branching of the polymer, because the vinyl group reacts with radicals resulting in a branching point [25].
Figure 17 (a) displays a VI = 0.013 of the virgin HDPE. This indicates that the virgin HDPE already shows a certain concentration of vinyl groups of the polymer of 0.042 mol L−1 (applying the Lambert–Beer law and the related extinction coefficient (ε = 12 m2 mol−1) [40]). These initial vinyl groups are likely to result from the polymerization conditions of the HDPE. The VI decreases at higher σ′treat > 25 kPa at T treat = 210°C and 220°C by up to 18.6%. The VI of the samples treated at T = 160°C show no significant change. Table 7 shows a comparison of the increase in molecular weight and the increase in VI from various HDPEs reported in the literature. The data in this article accord with the reported data from literature.
| Authors | Change in M w (%) | Change in VI a (%) | Change in COI a (%) | Lit. reference |
|---|---|---|---|---|
| Pinheiro et al. | +17 | −26 | +400 | [25] |
| Pinheiro et al. | +21 | −30 | +100 | [6] |
| Moss et al. | +17 | −14 | — | [16] |
|
This article (T treat = 220°C, σ′treat = 34.4 kPa, t treat = 300 min) |
+11.2 | −18.6 | 0 |
- a VI and COI are different determined compared with this article, but the same peaks were investigated.
It is also possible to analyze the dominant reaction using the CH3-absorption with respect to CH2-absorption [62]. These CH3/CH2 ratio show a high standard deviation of the investigated integrals of the; therefore, the analysis of this data is vague. The spectral ratios are shown in Figure S4.
With respect to the COI, the HDPE shows an increase no significant change due to the thermo-mechanical treatment with respect to the high standard deviations (Figure 17b). This suggests that oxidation plays no significant role at all used T treat. Table 7 shows a comparison of the change in the COI within the literature. As it can be seen, the increase in COI in this article is lower than to the shown literature references. This deviation can be explained, because the treatments from the literature references were conducted using a standard extrusion setup. Since this is not a closed system, the HDPE melt is exposed to air at a high temperature that promotes oxidation.
4.4.3 Isothermal OIT
The OIT was determined for samples treated under conditions shown in Figure 18. The OIT was determined as the crossover of the baseline at the start of the measurement and the tangent of the exothermic signal of oxidation according to ISO 11357, see Figure 18a.
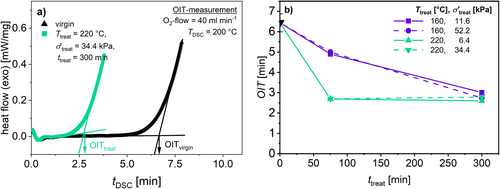
As shown in Figure 18b, there is a clear decrease in OIT under both T treat. The OIT is significantly lower for samples treated at T treat = 220°C. Additionally, there is no difference between the samples treated at different σ′treat, but at the same T treat. The decrease reaches a plateau of OIT = 2.5 min for t treat > 75 min. The OIT does not change even after longer t treat. This can be explained by the argument that no further reactive antioxidants are left in the sample. Since the samples treated at T treat = 160°C also reach this plateau at t treat = 300 min, it can be concluded that, even after the thermo-mechanical treatment at lowest T treat = 160°C, no active antioxidants are left in the sample.
4.5 Reaction Kinetics
To understand the degradation mechanism of the HDPE due to thermo-mechanical treatment, an evaluation of the activation energy for the initiation reaction and the rate of scission and branching is shown in this section. The equations discussed above are applied here.
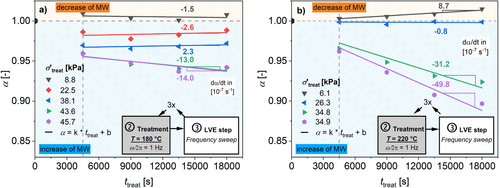
Figure 19 displays the calculated α, indicating the normalized number average molecular weight after treatment. Due to the assumption of a quasi-stationary level of radicals in the used model (see Equation (4)) and the slow kinetic, a linear change of α for t treat > 75 min was assumed. The slopes of this linear change are shown in Figure 19 for T treat = 180°C and 220°C. The resulting slopes are shown with respect to σ′treat in Figure 20.
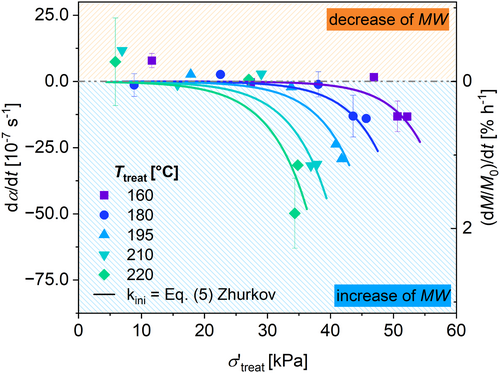
To fit the data shown in Figure 20 with Equation (4), a least-square fit procedure was performed, where only the free parameters β and E a,ini of Equation (5) were used to calculate the rate of initiation. These parameters were fitted for all applied temperatures simultaneously during the same fitting procedure. All other parameters were fixed to the values shown in Table 8. The results are displayed in Figure 20, and the results for β and E a,Ini are shown in Table 9.
| Parameter | Fixed values for fitting | Unit | Lit. reference |
|---|---|---|---|
| k rec | 6 × 10⁹ | L mol−1 s−1 | [7] |
| k 0,ini | 1.5 × 10¹⁰ | mol L−1 s−1 | [8] |
| k 0,sc | 1.5 × 10¹⁰ | s−1 | [7] |
| k 0,br | 4.9 × 10⁸ | L mol−1 s−1 | [7] |
| E a,sc | 66.8 | kJ mol−1 | [7] |
| E a,br | 17.6 | kJ mol−1 | [7] |
| β | Free, shared | m3 mol−1 | See Table 9 |
| E a,Ini | Free, shared | kJ mol−1 |
- Note: This includes Equation (5) to calculate the rate of initiation k ini.
| β (m3 mol−1) | E a,ini (kJ mol−1) | R 2 (-) |
|---|---|---|
| 1.7 | 286 | 0.87 |
The suggested model describes the measured data with R 2 = 0.87. The resulting activation energy is in accordance with activation energy E a,degr of pure thermal degradation using a thermogravimetric analysis (TGA) reported in literature (E a = 190–317 kJ mol−1, see Table 10) [12, 67-69].
| Authors | E a,degr (kJ mol−1) | Lit. reference |
|---|---|---|
| Blaine et al. | 190 | [67] |
| van Krevelen et al. | 264 | [12] |
| Aboulkas et al. | 317 | [68] |
| Klein et al. | 206 | [69] |
| This article | E a,ini = 286 |
- Note: Note that these activation energies describe only the influence of temperature and not of any shear stress.
The resulting β indicates by its unit an inverse concentration, which is 5 × 10⁻⁴ mol L−1. Compared with the concentration of entanglements of the HDPE polymer, which is c entanglements = 3750 × 10−4 mol L−1 (assuming entanglement molecular weight M e = 2 kg mol−1 [70] and density of polymer melt ρ PE = 0.76 g cm−3 at T = 180°C [45]), the concentration calculated from β is smaller by a factor of 1000. Therefore, the origin of the parameter β needs further investigations, but can be a key to gain a better understanding of thermo-mechanical treatment.
An Arrhenius plot can be derived from the results of the fitted curves shown in Figure 20 by interpolating at certain σ′treat. The results are shown in Figure 21.
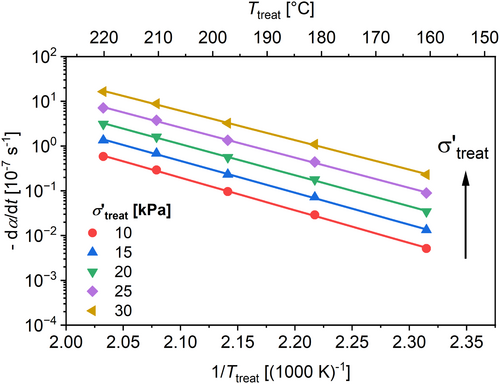
To validate the suggested model, the variation of further parameters during treatment are used and the results are precalculated using the suggested model and derived parameters (Table 11). The suggested model predicts the results from the different treatment parameters with respect to the standard deviation for the samples that are in the parameter framework of the studied parameters above. The samples treated at higher σ′treat than covered in this article show an overestimation of the calculated dα/dt. The validation of the kinetic model is so far restricted to the chosen model HDPE and therefore needs further proofment.
| ID | γ 0,treat (%) | ω treat/2π (Hz) | T treat (°C) | σ′treat (kPa) | t treat [min] | (10−7 s−1) | Standard deviation a (10−7 s−1) | (10−7 s−1) |
|---|---|---|---|---|---|---|---|---|
| v1 | 460 | 2.5 | 160 | 65.0 | 300 | −130.4 | 13.7 | −170.3 |
| v2 | 460 | 0.4 | 195 | 25.7 | 300 | −5.9 | 13.7 | −0.9 |
| v3 | 460 | 2.5 | 195 | 51.0 | 300 | −95.7 | 13.7 | −124.7 |
| v4 | 460 | 0.4 | 220 | 21.2 | 300 | −14.7 | 13.7 | −2.5 |
| v5 | 460 | 2.5 | 220 | 45.2 | 300 | −139.6 | 13.7 | −207.0 |
| v6 | 630 | 1 | 220 | 31.3 | 300 | −27.3 | 13.7 | −21.3 |
- a Standard deviation applied from results with treatment at T treat = 180°C and σ′treat = 45.7 kPa.
5 Conclusion
A closed-cavity rheometer (CCR) was used to investigate thermo-mechanical treatment (ω/2π = 1 Hz, γ 0 = 28%–460%) at temperatures up to T = 220°C for up to t = 300 min and measure the rheological properties in the linear viscoelastic regime in situ. The high oscillation amplitudes were chosen to emulate the effect of the shear stress during extrusion and multiple reprocessing of a HDPE. These rheological properties were correlated to physico-chemical changes using HT-SEC and FTIR characterization. These changes can be quantitatively predicted and described by established kinetic models resulting in HDPE-specific kinetic data.
This thermo-mechanical treatment of the studied model HDPE leads to an increase in the molecular weight and branching of the investigated HDPE. Furthermore, higher in-phase shear stress (> 30 kPa) leads to stronger increase in molecular weight (up to 13%, determined via HT-SEC and rheology) within the same time. This change is additionally accelerated by higher temperatures.
The HT-SEC results clearly show an increase in molecular weight caused by the applied thermo-mechanical treatment process. The change is in the same order of magnitude as reported in the literature. Results from FTIR analysis show a decrease in the concentration of vinyl bonds due to thermo-mechanical treatment. This may indicate a reaction of macroradicals with these groups, resulting in more branched polymer chains. The flow activation energy increases from 35 kJ mol−1 by about 16% due to the applied treatment. Thus, it is concluded that branching of the HDPE occurs.
A descriptive model to calculate the resulting molecular weight has been established. For this, the work of Goldberg and Zaikov [7] is combined with the work of Zhurkov [8]. The parameter σ′treat is used to describe the influence of shear stress. The activation energy for the initiation reaction (=286 kJ mol−1) and a volume factor (=1.7 m3 mol−1) are calculated from this model. This allows thereafter to predict the change in thermo-mechanical treatment. The activation energy is in accordance with data reported from TGA measurements.
As an outlook, it is important to investigate, if the suggested model can be applied to different polyolefins in general, for example, low-density polyethylene (LDPE), linear low-density polyethylene (LLDPE), or isotactic polypropylene (i-PP).
Furthermore, it would be promising to analyze the rheological data during treatment using different rheological methods, for example, FT-rheology or the hyphenated Rheo-IR-setup [71]. This may provide more detailed insights into occurring detailed kinetics. Additionally, it would be interesting to investigate the processing and the crystallization behavior of the thermo-mechanical treated samples to assess the practical relevance of the observed molecular change. It would also be of high interest to elaborate on the suggested model to differentiate between pure chain extension and chain branching.
Author Contributions
Tim Schülein: conceptualization (equal), data curation (lead), formal analysis (lead), investigation (lead), methodology (equal), project administration (lead), resources (lead), software (lead), validation (lead), visualization (lead), writing – original draft (lead), writing – review and editing (equal). Christos K. Georgantopoulos: conceptualization (equal), methodology (equal), validation (equal), visualization (equal), writing – review and editing (equal). Lars Bolk: formal analysis (supporting), investigation (supporting), writing – review and editing (supporting). Volker Herrmann: methodology (equal), project administration (supporting), resources (supporting), supervision (lead), validation (equal), writing – original draft (supporting), writing – review and editing (equal). Manfred Wilhelm: formal analysis (supporting), investigation (supporting), methodology (equal), resources (supporting), supervision (lead), validation (equal), visualization (supporting), writing – review and editing (equal).
Acknowledgments
Lyondell-Basell is acknowledged for the donation of the HDPE sample. Prof. Dr. Stefan Mecking is thanked for support for the HT-SEC measurement. We thank Anika Goecke and Micheal Pollard for proofreading of the manuscript. This research did not receive any specific grant from funding agencies in the public, commercial, or not-for-profit sectors. Open Access funding enabled and organized by Projekt DEAL.
Conflicts of Interest
The authors declare no conflicts of interest.
Open Research
Data Availability Statement
The data that support the findings of this study are available from the corresponding author upon reasonable request.


