Liquid Coordination Polymers with Anhydrous Proton Conductivity
Graphical Abstract
Functional liquid coordination polymers near ambient conditions are prepared by introducing H3PO4 as a network modifier. This process disrupts extended coordination networks, producing a stable liquid. Liquid properties are controlled by tuning the ratio of network modifiers, resulting in anhydrous proton conductivity up to 27 mS cm−1 at 353 K and viscosities ranging from 18.8 to 105.9 Pa·s at 303 K.
Abstract
Liquid states in coordination polymers (CPs) and metal-organic frameworks (MOFs) are typically considered transient intermediates in the crystal-to-glass transformations of organic–inorganic hybrid materials. However, their potential as functional materials has remained largely unexplored. Inspired by the unique properties of ionic liquids, organic liquids, and liquid metals, we explore liquid CPs as a platform for novel functionalities distinct from those of their crystalline and glass counterparts. Here, we present a strategy to achieve functional liquid CPs near ambient conditions by introducing H3PO4 as a network modifier, shifting compositions away from stoichiometric ratios. This process disrupts extended coordination networks during melting, producing a stable liquid state. By tuning the ratio of network modifiers, we achieve control over liquid properties, including anhydrous proton conductivity up to 27 mS cm−1 at 353 K and viscosities ranging from 18.8 to 105.9 Pa·s at 303 K. These findings demonstrate the transformative potential of liquid CPs, introducing them as a new platform for designing liquid conductors.
Introduction
Solid-to-liquid transition is one of the most fundamental processes in material sciences, yet it is among the most complex phenomena to predict.[1] This process opens up opportunities not only for advanced material processing but also allows access to their unique properties.[2-4] For example, the discovery of liquid crystals has transformed display technologies by harnessing their anisotropic optical properties and stimuli responsiveness in fluid phases.[5] Similarly, ionic liquids have emerged as versatile solvents and electrolytes due to their low volatility, high thermal stability, and availability in a wide variation of physicochemical properties.[6]
Proton and ionic conductivities in liquid systems are often described by Walden's rule, which outlines an inverse relationship between conductivity and viscosity.[7, 8] While the concept provides a foundational understanding of ion transport in liquids, it also highlights a critical limitation: conductivity in liquid systems is predominantly governed by viscosity. In discrete molecular liquids, such as protic ionic liquids, the Walden plot generally classifies their conductivity as “ionic” or “subionic,” where ion transport primarily occurs through the migration of low molecular-weight entities (vehicle mechanism).[6, 9, 10] However, this process is inherently less efficient than the structural diffusion (Grotthuss) mechanism observed in “superionic” conductors.[10] Efforts to enhance conductivity efficiency often involve reducing the migration of unwanted counterions via selective polymerization, observed in polymerized ionic liquids.[11, 12] However, this comes at the expense of fluidity. These challenges emphasize the need for new liquid material platforms capable of overcoming the viscosity-conductivity trade-off.
Solid-to-liquid-to-glass transformation in some proton-conductive coordination polymers (CPs) and metal-organic frameworks (MOFs) presents an appealing solution for overcoming the limitation of liquid conductors.[13-17] Preservation of coordination networks even above the melting point helps restrict the migration of molecular entities, enabling selective proton migration and promoting the probability of achieving “superionic” behaviors.[18-20] Furthermore, compositional flexibility in these amorphous CPs/MOFs allows for continuous property control by incorporating diverse functional components. For instance, doping small amounts of stimuli-responsive molecules, such as pyranine or tris(bipyrazine)ruthenium(II), allows dynamic control over anhydrous proton conductivity in zinc–phosphate–azole CP glasses.[21, 22] The physical properties, including melting and glass transition temperatures, can also be controlled by adjusting the composition of the resulting glass away from stoichiometric ratios.[23-30] Although functional liquids are common in many material families, they remain exotic within the context of CPs/MOFs.[31] Since the early observation of melting behavior in CPs/MOFs, liquid states have been viewed primarily as intermediates for accessing glassy states, mainly because the liquid states are exclusively observed at high temperatures.[32] For examples, zeolite imidazolate frameworks typically melt at 643–863 K,[24, 33] while zinc–phosphate–azole CPs, despite having lower melting temperatures, still require at least ca. 370 K to become liquids.[14] To date, no functional liquid CPs have been reported near ambient conditions.[32, 34]
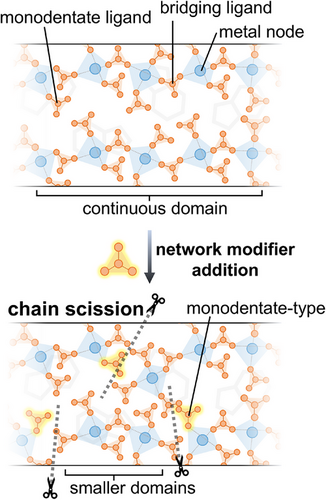
This article presents a strategy for synthesizing liquid CPs by adjusting the equivalent amount of H3PO4 as a network modifier. Inspired by viscosity modulation in oxide glasses with network modifier additions,[35, 36] we propose that substituting bridging phosphate ligands with terminal phosphate ligands in meltable zinc–phosphate–azole CPs similarly reduces the viscosity of CP glasses, allowing them to behave as network-forming liquids near ambient conditions (Figure 1). Here, the “liquid” state is defined based on viscosity-dependent flow properties, beginning at viscosities below the practical melting threshold (η < 10 Pa·s).[37, 38] Properties such as anhydrous proton conductivity and viscosity are finely tuned by adjusting the network domain size and local structure through specific starting compositions. Despite variations in their macroscopic properties, pair distribution function analysis reveals that the short-to-intermediate range structures of all modified samples remain consistent with those of their parent CPs. This work highlights a versatile approach for designing liquid CPs with tunable functional properties.
Results and Discussion
Synthesis and Melting Behavior
A meltable CP, [Zn3(H2PO4)6(H2O)3](1,2,3-benzotriazole) (Figure S1), was chosen as a representative material due to its low melting temperature among glass-forming CPs and MOFs.[18] This compound, referred to as ZnPBTA', was synthesized on a gram scale using a mechanochemical approach with a Teflon milling set, followed by dehydration to remove residual water (see Methods in SI). A series of non-stoichiometric CPs were prepared by reacting 3 mol equivalents of ZnO, 1 mol equivalent of 1,2,3-benzotriazole, and varying amounts of H3PO4. The H3PO4 used were 7.75, 9.5, and 11.25 mol equivalents for ZnPBTA'-m1, ZnPBTA'-m2, and ZnPBTA'-m3, respectively, compared to the stoichiometric ratio of 6 mol equivalents in ZnPBTA (Table S1). Powder X-ray diffraction (PXRD) patterns of the as-synthesized ZnPBTA'-m1, ZnPBTA'-m2, and ZnPBTA'-m3 matched well with the original ZnPBTA' (Figure S2). After dehydration, polycrystalline products were obtained (Figure S3). The dehydrated forms of ZnPBTA', ZnPBTA'-m1, ZnPBTA'-m2, and ZnPBTA'-m3 are denoted as ZnPBTA, ZnPBTA-m1, ZnPBTA-m2, and ZnPBTA-m3, respectively (Figure S4). PXRD analysis of the dehydrated samples suggests a structural change originating from the transformations around Zn2+ due to the release of water molecules from the octahedral coordination sphere.[18, 39] However, the exact crystal structure of dehydrated ZnPBTA could not be determined, as the compound lost single crystallinity upon dehydration.[39] 31P magic-angle spinning nuclear magnetic resonance (31P MAS NMR, Figure S5) spectra of ZnPBTA-m1, ZnPBTA-m2, and ZnPBTA-m3 exhibit peaks exclusively within the orthophosphate range, indicating that no condensation occurs during the dehydration process and that all phosphate remains either anionic or in the form of free orthophosphoric acid.[40, 41] Energy-dispersive spectroscopy (EDS) analysis further confirmed the absence of Teflon contamination in the dehydrated products (Figure S6). Additionally, the actual Zn/P mol fractions, analyzed by inductively coupled plasma optical emission spectroscopy (ICP-OES) technique, are provided in Table S2. FTIR spectra showed no distinct changes among the samples (Figure S7). These results suggest that ZnPBTA-m1, ZnPBTA-m2, and ZnPBTA-m3 comprise crystalline ZnPBTA domains alongside amorphous H3PO4.[22, 27]
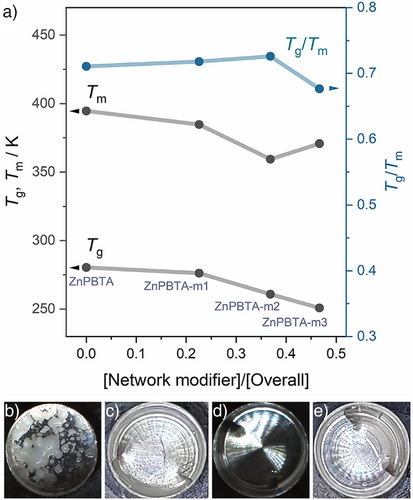
Heating crystalline ZnPBTA above its melting temperature (Tm, peak = 394.6 K) produces a liquid state that remains stable up to 448 K (Figures S8 and S9). Differential scanning calorimetry (DSC, Figure S8) indicates that deviations from the stoichiometric composition result in changes in melting behavior, attributed to flux melting.[42, 43] A similar melting temperature depression is observed in some multicomponent zeolitic imidazolate frameworks.[44, 45] Upon heating, ZnPBTA-m1, ZnPBTA-m2, and ZnPBTA-m3 undergo simultaneous endothermic events corresponding to melting, dissolution, and depolymerization, with the overall enthalpy changes increasing proportionally to the excess H3PO4 content (Table S3). The melting process begins at onset temperatures of approximately 341–344 K, initiated by the partial dissolution of crystalline domains into the H3PO4 flux. This continues until endset temperatures of 390.5, 364.7, and 374.1 K for ZnPBTA-m1, ZnPBTA-m2, and ZnPBTA-m3, respectively. The peak melting temperature (Tm, peak), defined as the temperature at the peak of the DSC curve, decreases to 384.7 K for ZnPBTA-m1 and 359.4 K for ZnPBTA-m2 due to increased H3PO4 flux content, which facilitates solid-to-liquid transition via dissolution (Figure 2a). However, when the modifier content exceeds the saturation point, changes in flux composition lead to a slight increase in Tm, peak to 370.7 K for ZnPBTA-m3.[46] Subsequent DSC heating reveals glass transition temperatures (Tg, DSC) of 282.4 and 280.7 K for ZnPBTA and ZnPBTA-m1, respectively. The Tg values for ZnPBTA-m2 and ZnPBTA-m3 fall below the measurement limit and are discussed in the next section. Thermogravimetric analysis (TGA) results show that all samples exhibit less than 1% weight loss up to at least 423 K, confirming the absence of phosphate condensation during the melt-quenching process (Figures S9–S13). Additionally, changes in the character of the liquid states were observed at 393 K, where they became transparent with increasing amounts of H3PO4 beyond the stoichiometric limit (Figure 2b–e). Upon quenching to room temperature, ZnPBTA-g and ZnPBTA-g-m1 solidified into an amorphous solid, while ZnPBTA-g-m2 and ZnPBTA-g-m3 remained as viscous liquids. Note that -g indicates samples after melting. The PXRD patterns of all melt-quenched samples exhibited no Bragg peaks, confirming the absence of long-range orders, and are homogeneous without any detectable crystalline H3PO4 (Figure S14).
Viscosity and Glass Transition
The liquid-like behavior at lower temperatures with excess H3PO4 motivated us to quantify changes in viscosity. The viscosity of all samples follows a MYEGA-like temperature dependence, with glass transition temperatures (Tg) estimated by extrapolating viscosity to 1012 Pa·s (Figure 3a, Table S4).[47, 48] A clear decreasing trend in Tg was observed with increasing H3PO4 content, resulting in Tg values of 280.4, 276.2, 260.9, and 250.8 K for ZnPBTA-g, ZnPBTA-g-m1, ZnPBTA-g-m2, and ZnPBTA-g-m3, respectively. These results align with the Tg,dsc values obtained from DSC measurements for ZnPBTA-g and ZnPBTA-g-m1.
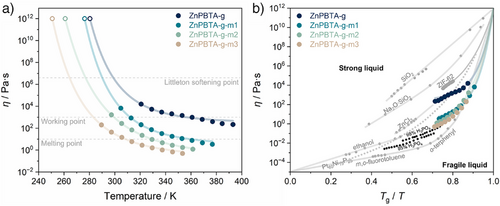
At higher temperatures, the viscosity values drop below the working point (η = 103 Pa·s) at 312, 299, and 283 K for ZnPBTA-g-m1, ZnPBTA-g-m2, and ZnPBTA-g-m3, respectively. At this point, the viscosity is comparable to molten soda-lime glass at above 1373 K.[49] Additionally, practical melting temperatures (η < 10 Pa·s) are achievable at 360, 329, and 308 K for ZnPBTA-g-m1, ZnPBTA-g-m2, and ZnPBTA-g-m3. Below these temperatures, viscosity approaches the range typical of ionic liquids at their operating temperatures.[50] The reduced viscosity values further support the role of H3PO4 as a network modifier, inducing chain scission in the 1D coordination chains.[20] A similar decreasing trend of viscosity was observed in Zn(HPO4)(H2PO4)2](H2Im)2 upon introducing CsHSO4, where oxyanion exchanging between HSO4− and bridging phosphate decreases overall viscosity.[27] Analogous behavior is also observed in conventional inorganic glasses, where increasing network modifier content continuously decreases viscosity.[51, 52]
The liquid characteristics were further evaluated through a fragility diagram (Figure 3b), comparing the melt-quenched samples with references from various material families.[10, 51, 53-56] The fragility indexes (m) of the melt-quenched samples ranged from 118 to 146, positioning them between ZnCl2, which exhibits intermediate fragility, and fragile H3PO4.[48] The high fragility is attributed to the relatively low viscosity near Tm, estimated at 0.5–5.5 Pa·s for the modified samples and 102.7 Pa·s for ZnPBTA. In contrast, the strong ZIF-62 glass exhibits a much lower fragility index (m = 23) and an exceptionally high viscosity of 105.5 Pa·s at Tm.[55] Another key parameter to describe the liquid behavior is the Tg/Tm ratio, which indicates the tendency of a liquid to form glass upon cooling rather than crystallizing.[38, 57] ZnPBTA exhibits a Tg/Tm of 0.71. With increasing H3PO4 fractions, Tg/Tm initially increases, reaching a maximum of 0.73 for ZnPBTA-m2, before decreasing to 0.67 for ZnPBTA-m3 due to its higher Tm.
Short-to-intermediate Range Order
Having observed alterations in viscosity and thermal behaviors, we further focused on examining the role of the network modifier (H3PO4) in inducing changes to the local structure of the modified samples compared to the pristine ZnPBTA. We probed the short-to-intermediate range order in all samples before and after melt-quenching using pair-distribution function (PDF) analyses, which provide the probability of finding atomic pair distances presented as weighted histograms (Figure 4).[58] Despite slight intensity differences below 5 Å, the peak features of the crystalline derivatives remained largely identical to the pristine ZnPBTA, highlighting the retention of short-range order within crystalline domains (Figure 4c). Pair correlations from Zn2+ to its first and second nearest-neighbor Zn2+ appeared at ca. 3.3 Å (Zn⋯Zn1st) and 5.2–5.5 Å (Zn⋯Zn2nd), respectively (Table S5). These measured distances align well with the predicted values of 3.19 and 5.37 Å from the crystal structure of ZnPBTA' at 100 K.[18] The peak splitting observed in the Zn⋯Zn2nd region of ZnPBTA, compared to the simulated PDF pattern of ZnPBTA' (Figure S16), was attributed to the deformation of the Zn2+ octahedral coordination sphere upon dehydration. With increasing H3PO4 content from ZnPBTA to ZnPBTA-m3, a gradual increase in peak intensity corresponding to the intramolecular P–O correlation at 1.5 Å was observed. A peak at ca. 3.9 Å and a recombined peak corresponding to the Zn⋯Zn2nd correlation at 5.2–5.3 Å emerged with excess H3PO4, plausibly due to Zn2+ coordination with phosphate, which completes the octahedral coordination. A similar transformation occurred at ca. 7.5 Å (Zn⋯Zn3nd) when comparing ZnPBTA to ZnPBTA-m1. However, in ZnPBTA-m2 and ZnPBTA-m3, this Zn⋯Zn3nd correlation was hindered, plausibly due to strong contributions from Zn⋯P, Zn⋯O, P⋯O, and O⋯O correlations from excess H3PO4 or increased structural disorder. A slight reduction in amplitude at ca. 2.1, 3.3, and 4.4 Å, corresponding to Zn–O, Zn⋯Zn/P, and O⋯Zn/P correlations, respectively, indicates a higher degree of disorder within the 1D chains. These peak assignments are supported by calculated partial PDFs derived from the crystal structure of ZnPBTA' (Figure 4e).[18, 59]
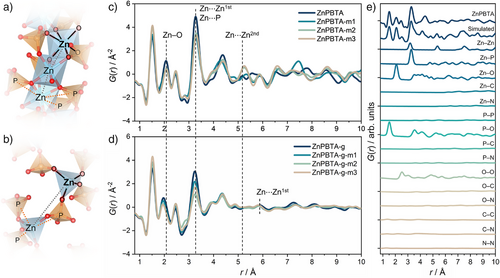
After melt-quenching, the distinct peak features below 5 Å are preserved, although some positions and intensities shift compared to those of the parent crystals (Figures 4d, S17–S24). The shift in Zn–O correlations from 2.1 Å to below 2.0 Å suggests a transformation in the coordination environment of Zn2+, from octahedral to tetrahedral geometry. This transformation is further supported by the diminished contributions from Zn⋯Zn1st and Zn⋯Zn2nd, along with a shift in the Zn–P contribution from ca. 3.3 Å in the crystalline state to ca. 3.2 Å after melt-quenching. Additionally, a new peak emerges at ca. 5.8–5.9 Å (Table S6), representing a Zn⋯Zn1st correlation unique to Zn-phosphate-azole CPs with tetrahedral geometry (Figure 4a–d).[14] To verify these peak assignments, we performed experimental and calculated partial PDF analyses of [Zn(HPO4)(H2PO4)2](ImH2)2 (H2Im = imidazolium) in both crystalline (ZnPIm) and glassy (ZnPIm-g) states, which also feature tetrahedral coordination around Zn2+ (Figures S26 and S27).[13, 14] Note that the calculated Zn⋯Zn1st distance from the crystal structure of ZnPIm at 243 K is ca. 5.7 Å.[13]
Despite a significant change in viscosity, the short-to-intermediate-range features of the modified samples remain largely consistent with those of unmodified ZnPBTA-g (Figure 4d). The correlation at ca. 5.8 Å, corresponding to the Zn⋯Zn1st pair, suggests that some degree of metal-ligand-metal connectivity is retained in all samples, even in ZnPBTA-g-m3 with the highest modifier content. However, the peak is relatively weak, indicating that the 1D coordination chains may undergo substantial scission, potentially fragmenting into much smaller species, including trimers, dimers, or even monomers, depending on the amount of Zn2+ in the coordination network.[20, 60] Furthermore, the observed decrease in viscosity with increasing H3PO4 content supports extensive chain fragmentation, likely driven by anion exchange between bridging and terminal phosphate ligands.[27] At higher r distances, the melt-quenched samples exhibit peak broadening, reflecting a loss of periodicity.
Anhydrous Proton Conductivity
We measured the proton conductivity of melt-quenched samples using alternative current (AC) impedance spectroscopy under a dry Ar atmosphere. Samples in their molten state were loaded into a conductivity cell with fixed dimensions. For each measurement, the samples were heated to specific temperatures for at least 3 h and allowed to equilibrate until the conductivity values stabilized.
ZnPBTA exhibits Arrhenius-type behavior, with proton conductivity values of 3.3 × 10⁻⁴ mS cm−1 at 303 K and 5.7 × 10⁻³ mS cm−1 at 323 K.[18] An abrupt increase in proton conductivity was observed above 50 °C, reaching 9.0 × 10⁻² mS cm−1 at 333 K and 1.2 mS cm−1 at 373 K. Below 60 °C, conductivity is primarily governed by the mobility of phosphate moieties along the 1D zinc-phosphate chains. Above this temperature, the random rotation of BTA molecules provides an additional contribution to proton conductivity, alongside enhanced phosphate dynamics, leading to a change in activation energy.[18] A similar abrupt change in proton conductivity upon heating has also been observed in other zinc-phosphate-azole CPs, such as [Zn3(H2PO4)6(H2O)3](benzimidazole)[39] and Zn(HPO4)(H2PO4)2](H2Im)2.[13] After melt-quenching, ZnPBTA-g exhibits significantly enhanced conductivity, with values of 0.33 mS cm−1 at 303 K and 8.0 mS cm−1 at 393 K.[18]
By tuning the ratio of network modifiers, we achieved control over anhydrous proton conductivity (Figures 5a, S28–S34, and Table S7). The maximum proton conductivities of 13.8 mS cm−1 at 393 K, 17.2 mS cm−1 at 373 K, and 27 mS cm−1 at 353 K were achieved for ZnPBTA-g-m1, ZnPBTA-g-m2, and ZnPBTA-g-m3, respectively, all exceeding the 8.0 mS cm−1 measured for ZnPBTA-g at 393 K. Note that proton conductivity measurements for ZnPBTA-g-m2 and ZnPBTA-g-m3 could not be conducted above 373 and 353 K, respectively, as the samples began leaking in our setup due to their low viscosity. The temperature-dependent proton conductivity of the sample with stoichiometric composition transitions from Arrhenius-type behavior in crystalline ZnPBTA to Vogel–Fulcher–Tammann (VFT)-type behavior after melt-quenching.[61-63] The Arrhenius behavior, linked to activated local ion hopping in crystalline conductors, contrasts with the VFT behavior, which reflects ion migration coupled with structural dynamics and assisted by structural relaxation in amorphous glasses or polymers.[48] The obtained fitting parameters are summarized in Table S8. The VFT behavior is retained in ZnPBTA-g-m1 and ZnPBTA-g-m2, accompanied by an increase in proton conductivity. In these cases, additional network modifiers enhance structural dynamics, as reflected in the decreased Tg values. We observed a decreasing trend in activation factors (B) and a smaller difference between the VFT-fitted ideal transition temperature (T0) and Tg with increasing network modifier content. The former suggests weaker temperature dependence and lower barriers for proton conduction, while the latter indicates a reduced decoupling effect.[48, 64-66] Further increases in network modifiers in ZnPBTA-g-m3 result in a transition back to Arrhenius-type behavior with a relatively high activation energy of 1.20 eV. This shift is likely driven by the dominant contributions of free H3PO4 and highly fragmented CP chains, as evidenced by a decrease in the measured density (Table S9). The observed activation energy aligns closely with those of crystalline ZnPBTA (1.22 eV) and [Zn3(H2PO4)6](1,3-benzimidazole) (1.5 eV), measured at temperatures below the threshold where azole molecules begin to rotate and contribute to proton conduction.[18, 39]
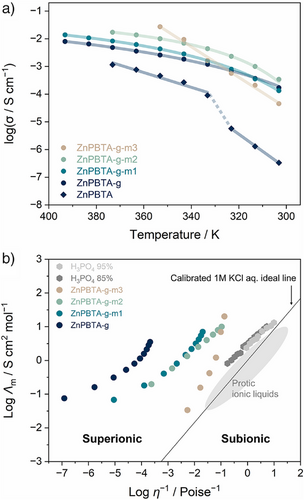
The Walden plot was utilized to examine the relationship between viscosity (η), equivalent conductivity (Λm), and the proton-conductivity mechanisms.[6, 67] In this study (Figure 5b), all samples deviate from Walden's ideal line, occupying the superionic region. Equivalent conductivities exceeding those predicted by Walden's rule indicate a decoupling of charge carriers from the overall structural networks that govern viscosity. This suggests that proton migration predominantly occurs via the Grotthuss mechanism. The weak dependence of conductivity on viscosity allows for the adjustment of viscosity without compromising high proton conductivity. As the content of the network modifier increases, the trend shifts closer to the ideal line of ionic conduction in a fluid-diluted solution.[8] Along this line, molar conductivity is directly proportional to the fluidity of the medium, indicating that ion migration is fully coupled with the structural dynamics.[48] The shift is attributed to reduced viscosity and an increased contribution from the vehicle mechanism, facilitated by free phosphoric acid and the formation of smaller coordination network fragments with higher H3PO4 content. These observations are consistent with the reduced decoupling effect identified in the VFT fitting analysis as the network modifier content increases. However, even with the highest modifier content (ZnPBTA-m3), the sample remains above phosphoric acid on the Walden plot (Figure 5b). This suggests that ZnPBTA-m3 still relies heavily on the Grotthuss mechanism for proton conductivity, similar to phosphoric acid (∼97% Grotthuss contribution).[48, 68, 69]
Conclusion
This study presents a strategy for preparing liquid CPs near ambient conditions by shifting their composition away from stoichiometric ratios. Excess phosphate ligands act as network modifiers, enabling control over thermal behavior, proton conductivity, and viscosity. By varying the amount of network modifiers, we achieved tunable CP properties, including anhydrous proton conductivity ranging from 2.6 to 27 mS cm−1 at 353 K and viscosities from 18.8 to 105.9 Pa·s at 303 K. Synchrotron X-ray total scattering and PDF analysis revealed a structural transformation in the coordination environment around Zn2+, shifting from octahedral to tetrahedral geometry upon melt-quenching, with evidence of substantial chain fragmentation. This work thus establishes a foundation for designing next-generation functional liquid materials with tailored properties, offering an exciting platform for applications that demand flexibility, dynamic mixing capabilities, and intrinsic proton conductivity.
Supporting Information
The authors have cited additional references within the Supporting Information.[13, 14, 18, 20, 22, 27, 59, 70-91]
Acknowledgements
N.M. acknowledges the support from ICYS for a research fellowship, from the Japan Society of the Promotion of Science (JSPS) for a Grant-in-Aid for Research Activity Start-up (JP24K23109) and Grant-in-Aid for Early-Career Scientists (JP25K18055), and from the Sumitomo Foundation basic science grant number 2402150. The authors acknowledge BL04B2 beamlines at SPring-8 for the synchrotron X-ray total scattering experiments with the approval of JASRI (Proposal No. 2024B1167). They thank Dr. Takashi Nakanishi (NIMS) and Dr. Renzhi Ma (NIMS) for access to equipment. They thank Dr. Daiki Umeyama for discussions. They thank Nao Horike for 31P MAS NMR measurements. They thank Yu Fujii for the ICP-OES analysis. They acknowledge support from the NIMS Surface and Bulk Analysis Unit and NIMS Nanofabrication Facilities.
Conflict of Interests
The authors declare no conflict of interest.
Open Research
Data Availability Statement
The data that support the findings of this study are available from the corresponding author upon reasonable request.


