In Situ Observation of Post-CO Intermediates to Decode C─C Coupling Pathways in CO2 Electroreduction
Graphical Abstract
Abstract
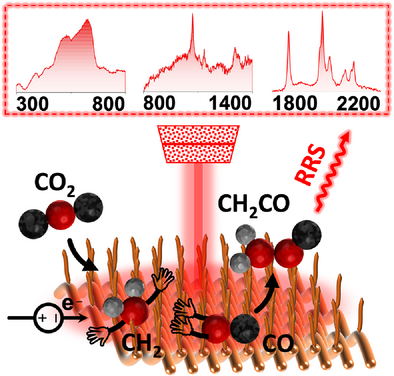
Electrocatalytic carbon dioxide (CO2) reduction reaction (CO2RR) has emerged as a promising strategy for sustainable energy conversion and carbon utilization. Despite intensive research efforts, the understanding of intermediates and pathways leading from CO2RR to multicarbon (C2+) chemicals remains incomplete. The challenge is to gain insight into the activation of adsorbed CO and the subsequent pathways. Here, we design a specially tailored Cu nanowire array facing a hydrophobic interface as an electrode to highly enhance Raman signals in the in situ environment, allowing sensitive observation of the sequential change of various elusive intermediates during CO2RR, such as CO, CH2, CO coexisting with CH2, CH2CO, and CH3. Density functional theory calculations reveal that the C─C coupling during CO2RR originates from an asymmetric coupling between CH2 and CO to form CH2CO, identified as the rate-determining step in the formation of C2+ products. These findings deepen the understanding of the C─C coupling processes, which are crucial for advancing catalyst development in electrochemical CO2 upgrading.
Introduction
The conversion of CO2 into hydrocarbons using renewable electricity is considered a promising approach for sustainable energy storage and carbon recycling.[1] Multicarbon (C2+) products are of particular interest due to their widespread applications as chemicals and fuels. Although significant progress has been achieved in this field, Cu catalysts currently remain the only viable option for electrocatalytic CO2 reduction reaction (CO2RR) to produce C2+ products.[2] On the Cu catalyst, ethylene, ethanol, and acetic acid are mainly produced with remarkable Faradaic efficiency (FE) and current density (j).[3, 4] However, the selectivity toward other C2+ products on Cu catalysts remains challenging to improve, which implies that the particular kinetics of intermediates on the Cu surface are involved and determine the selectivity and efficiency in producing target chemicals. Therefore, elucidating the intermediates and reaction pathways on the Cu surface is of paramount importance for gaining deeper mechanistic insights and for developing efficient catalysts.
The study of C2+ formation pathways has led to extensive debate, particularly regarding the key step in the construction of carbon skeletons.[3] The C─C coupling step is critical for carbon chain elongation and the expansion of electrosynthesis toward longer chain hydrocarbons.[5] The lack of consensus stems from limited experimental results available for modeling,[6, 7] and because adsorbed CO, serving as the initial intermediate for CO2RR, remains one of the few undisputed intermediates that can be provided by spectroscopy.[8-10] In light of this, the CO─CO coupling pathway has been the most widely accepted and discussed,[3] whereas some unusual experimental phenomena have predicted several potential asymmetric C─C coupling frameworks as research on CO2RR continues to expand.[2, 5, 11-14] Recently, a series of strategies, such as molecular tuning,[15] vacancy engineering,[16] and alloying strategies,[17-19] have been employed to regulate asymmetric C─C coupling to achieve high selectivity for C2+ products. Nevertheless, without a clear understanding of how these intermediates form and evolve during the CO2RR, optimizing the reaction pathway remains challenging. Therefore, the identification of post-CO intermediates is of great importance for the elucidation of the C─C coupling pathway. Yet, due to the limited coverage of intermediates on Cu surfaces, even CO intermediates are only transiently observed at certain low overpotentials where key events for CO2RR are expected to evolve,[9, 13, 14, 20, 21] let alone post-CO intermediates. In view of this, some researchers have attempted to observe the post-CO intermediate reaction process in Raman spectroscopy by supplying high concentrations of CO and CH3I as intermediates, and surprisingly found that asymmetric CH3─CO coupling is extremely prone to occur.[17, 22] Furthermore, theoretical studies indicate that asymmetric CHx─CO is energetically and kinetically feasible on specific Cu sites.[23, 24] However, this asymmetric pathway is not widely accepted due to the lack of direct observation of the elusive CHx intermediates during CO2RR.
Surface-enhanced Raman spectroscopy (SERS) offers significant advantages for detecting reaction intermediates.[25] Accordingly, previous studies have employed gold and silver nanoparticles to sensitively detect intermediates during CO2RR.[8, 26, 27] However, a limitation of SERS is its reliance on surface plasmon resonance effects, which restrict the signal enhancement to molecules near the surface of the metal nanoparticles. As a result, SERS can mainly detect intermediates such as Cu–CO that form direct bonds with the Cu catalyst surface. For some elusive post-CO intermediates, which may be located further from the catalyst surface or have shorter surface residence times, SERS does not effectively capture their signals. In contrast, resonance Raman spectroscopy (RRS) provides distinct advantages. When the incident light frequency resonates with the electronic transition frequency of the intermediates, the signal from specific molecular vibrational modes can be significantly enhanced. Unlike SERS, RRS does not rely on surface enhancement effects, allowing for sensitive detection of intermediates in a wider reaction environment, particularly those that are present only briefly during the reaction or do not bind directly to the catalyst surface. Given this advantage, RRS holds promises for significant breakthroughs in detecting elusive post-CO intermediates, offering deeper insights into the CO2RR mechanism. In recent years, nanowire materials[28, 29] and 2D layered materials[30, 31] have emerged as promising substrates for RRS, providing signal enhancement arising from structural resonance[28, 29] or charge-transfer resonance.[30, 31] These substrates have demonstrated significant enhancement factors of up to five orders of magnitude.[28-31] The two types of resonances can occur simultaneously and interact in complex systems, resulting in composite surface resonances that further enhance Raman signals. Thus, the design of Cu catalysts capable of incorporating these surface resonances represents a promising strategy for observing elusive intermediates during CO2RR.
In this study, we significantly enhanced the Raman signals of intermediates involved in CO2RR by applying the tailored nanostructure composed of a 2D Cu nanowire array (Cu-NWA) and adjusting the thickness of the gas diffusion layer (GDL) on the Cu-NWA surface. This nanostructure satisfies the conditions for composite surface resonance, while the GDL on the Cu-NWA surface ensures an abundant supply of CO2RR intermediates. Consequently, we observed the dynamic changes of adsorbed CO intermediates and the successive appearance of various elusive post-CO intermediates, such as CH2, CO coexisting with CH2, CH2CO, and CH3 in CO2RR. Using density functional theory (DFT) method-based calculations, we carefully analyzed the C─C coupling process and confirmed that it originates from the asymmetric coupling between CO and CH2, with the formation of CH2CO identified as the rate-determining step for the C2+ formation. In addition, we proposed experimentally supported insights into the formation mechanisms of ethylene and acetic acid.
Results and Discussion
Design Strategy for Cu Structure for In Situ Raman Spectroscopy
Raman spectroscopy is a powerful technique that provides high resolution and detailed structural information and has therefore been widely applied to the in situ observation of CO2RR.[8, 26, 27, 32-35] However, satisfactory observations of intermediates involved in the sequential pathways of CO2RR are still lacking. This limitation can be attributed to the weak nature of Raman scattering signals in the in situ environment. The enhancement of Raman signals resulting from structural and charge transfer resonances is typically considered to result from electromagnetic and chemical effects, respectively. In addition, these resonances could intertwine under specific conditions, especially in complex systems involving molecular vibrations and charge transfer,[36] analogous to the catalyst surfaces for CO2RR. Considering that the nanowire structure is capable of inducing structural resonance and the 2D structure is conducive to charge transfer resonance, we selected a Cu-NWA as the electrode for in situ Raman measurements (Figure 1a).
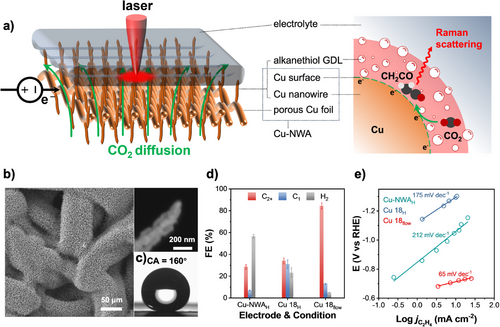
Cu-NWA was prepared in two steps: first, an in-situ electrooxidation growth on porous Cu foil to ensure the uniformity of the nanowire array; and second, a mild, programmed H2 reduction to maintain the Cu-NWA structure (see Methods for details).[2] In addition, to achieve the effective diffusion of CO2 gas to the Cu-NWA surface, which enables the provision of intermediates for a continuous and stable detection, we modify the surface of the Cu-NWA with a hydrophobic GDL.[37-40] Considering that alkanethiols with specific chain lengths have been used as a component of thickness-controllable GDLs,[40] we selected 1-hexanethiol, 1-dodecanethiol, and 1-octadecanethiol to prepare the alkanethiol-based GDL on Cu-NWA. The gas diffusion electrodes (GDEs) were then constructed using Cu-NWA and the alkanethiol with different chain lengths, and were named Cu 6, Cu 12, and Cu 18, of which the number corresponds to the chain length of the alkyl. Transmission electron microscopy (TEM) and X-ray photoelectron spectroscopy (XPS) revealed that the Cu-NWA was coated with a monolayer of alkanethiol bonded by Cu─S bond (Figures S1 and S2), which corresponds to the chain length of 1-hexanethiol, 1-dodecanethiol, and 1-octadecanethiol between the surface-bonded S and the terminal C.[41] Contact angle (CA) measurements further demonstrated that Cu 6, Cu 12, and Cu 18 all exhibited superhydrophobic properties, with CAs exceeding 150° (Figure S3). Scanning electron microscopy (SEM) images of Cu 18 confirmed that the Cu-NWAs are highly densely grown (Figure 1b and Figure S4). Additionally, TEM measurements provided detailed information on the nanowire diameter and surface crystallinity of Cu 18 (Figure S4). CA measurements of Cu 18 showed a CA as high as 160° (Figure 1c), which can be attributed to its surface adopting vertical and needle-like structures. This structure effectively alleviates the mass transport limitations under high j, as discussed in a recent report.[42] Furthermore, under high-pressure water jetting demonstrated that the water column on the Cu 18 electrode surface rapidly contracts, minimizing the liquid surface area even under high-pressure conditions (Movie S1). This phenomenon is intuitively advantageous because it reduces the surface area of the liquid and slows down the attenuation of Raman scattering signals.
To optimize the observation conditions for the in situ Raman spectroscopy, we preliminarily evaluated the CO2RR performance on Cu-NWA and Cu 18 with an electrode–electrolyte two-phase contact in an H-type reactor, named Cu-NWAH and Cu 18H, respectively (Figure S5a), and on Cu 18 with a CO2 gas-electrode–electrolyte three-phase contact in a flow reactor, named Cu 18flow (Figure S5b). We then found that the product selectivity for H2, C1, and C2+ on Cu-NWA was significantly dependent on the operating conditions (Figure 1d and Figure S6). Furthermore, we observed significant differences in the Tafel slope for the C2H4 production (Figure 1e), which suggests the possibility that different pathways for C2+ formation could be influenced by the varying operating environments.[43] Therefore, for the study of CO2RR pathways, it is necessary to ensure environmental consistency between product distributions observed using a reactor in Raman spectroscopy and in CO2RR to study the reaction pathways. We then applied a flow reactor, which was equipped with components similar to those used for CO2RR (Figure S7), and standardized the flow rate of electrolyte and CO2 gas. The experimental setup for the in situ Raman spectroscopy consisted of the 785 nm laser passing through the optical window of the reactor and focusing on the interface of the Cu-NWA surface, the alkanethiol GDL, and the thin electrolyte layer, as illustrated in Figure 1a. This interface ensured an abundant supply of CO2RR intermediates to support RRS.
Selection of Gas Diffusion Layer Based on CO2RR Performance
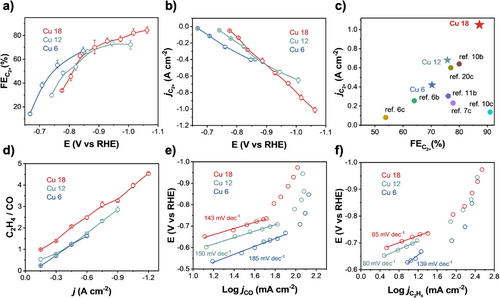
To determine the appropriate alkanethiol GDL thickness, we systematically evaluated the CO2RR performance of Cu 6, Cu 12, and Cu 18 in a flow reactor with 1 M KOH electrolyte (Figures S8 and S9). The corresponding alkanethiol GDL thicknesses were approximately 0.8, 1.5, and 2.5 nm, respectively (Figure S1). Cu 6 showed the lowest C2+ Faradic efficiency () of 70% with C2+ current density () of −0.42 A cm−2, whereas Cu 18 exhibited the highest of 87% with of −1.05 A cm−2 (Figure 2a,b and Figure S8b,d). Our and values were benchmarked against previously reported performances for C2+ production, as shown in Figure 2c,[9, 10, 13, 18, 19, 21, 39] confirming the excellent performance on Cu 18. The product ratio of C2H4 and CO (C2H4-to-CO) indicates that the CO2RR on Cu 18 is more biased toward C2H4 formation (Figure 2d). Electrokinetic analysis using Tafel plots revealed that Cu 18 exhibited the lowest Tafel slopes for both CO (143 mV dec−1) and C2H4 formation (65 mV dec−1) (Figure 2e,f). These results can be attributed to high mass transport in 1-octadecanethiol GDL on the Cu 18 surface.[43] In view of the optimal selectivity and activity for C2+ production, Cu 18 was selected for the in situ Raman observation.
Analysis of Raman Spectra and Calculations for CO2RR Intermediates
First, we performed in situ Raman measurements on a porous Cu foil modified with 1-octadecanethiol (Cu foil-18) in the presence or absence of CO2 to obtain a standard result (Figure S10). Additionally, SEM images of the Cu foil-18 without the NWA structure were captured to provide further insight into its surface morphology (Figure S11). At open circuit potential (OCP), a band indicative of slight oxidation of the porous Cu foil was observed near 500 cm−1, along with weaker bands at 1030 and 1295 cm−1 associated with 1-octadecanethiol. In addition, a band corresponding to carbonate was identified at 1065 cm−1 in the presence of CO2. It should be noted that no new bands appeared on Cu foil-18 upon applying potential, suggesting the inertness of 1-octadecanethiol as an alkanethiol GDL in participating in CO2RR. Furthermore, the Cu foil-18 exhibited a relatively flat Raman profile near 300 cm−1 and in the range of 1800−2200 cm−1 (Figure S9), which provides a robust reference platform for the subsequent discussion of the adsorption of carbon intermediates on the Cu 18 surface.
We further investigated the CO adsorption on Cu 18 as a preliminary step in the pathways for the C2+ formation. Previous in situ Raman studies had observed only transient broad CO adsorption bands of low intensity in the range of 1800–2200 cm−1. In contrast, our experiments with Cu 18 allowed the observation of a distinct multiband in the same region (Figure 3a). These multibands can be attributed to the vibrational modes of adsorbed CO, since this phenomenon was not observed for Cu 18 either at OCP or during electrolysis without CO2 (Figure 3a and Figure S12). In contrast, the Cu foil-18 without the NWA structure did not show any enhancement of the Raman signals (Figure S10), highlighting the contribution of the designed Cu-NWA in Cu 18 to RRS. Notably, these multiband spectra exhibited dynamic changes in Raman shifts and intensities over a wide range of j (−10 to −200 mA cm−2). The complexity observed in these bands, even in the relatively simple scenario of CO adsorption, suggests that it may contain crucial information regarding the formation of post-CO intermediates. To gain a deeper understanding of the multiband phenomenon, we performed vibrational frequency calculations using the DFT method for all possible configurations of CO interacting with Cu(100). These configurations included physisorbed CO (CO-physisor), top-adsorbed CO (CO-top), bridge-adsorbed CO (CO-bridge), and 4-fold-adsorbed CO (CO-4F), the calculated vibrational frequencies for CO-physisor, CO-top, CO-bridge, and CO-4F were calculated to be 2120, 2012, 1880, and 1673 cm−1, respectively (Figure S13). We further analyzed the effects of solvent and electric field on the vibrational frequencies of CO, and the corresponding adsorption energies are summarized in Supplementary Table S1. The CO-physisor exhibited a slight blue shift, while the CO-top, CO-bridge, and CO-4F showed varying degrees of red shift (Figure S14). Although physisorbed CO is rarely discussed in conventional CO2RR studies, its presence has been reported or hypothesized in systems where high CO coverage, surface modification, or electrolyte composition reduce the availability of strong chemisorption sites.[44-46] In particular, low-coordination Cu sites or partially oxidized Cu+ centers have been associated with weak CO binding and vibrational frequencies near 2120–2130 cm−1,[47, 48] which is consistent with our observations. These results, along with the sensitivity of chemisorbed CO modes to solvation and electric field effects, highlight the complex influence of the interfacial environment on the adsorption behavior of CO. To link the experimental observations with the theoretical calculations with different effects, we conducted an analysis of representative adsorbed CO Raman peaks and their corresponding intensities (Figures S15 and S16). However, due to the varying Raman shifts and intensities, the analysis posed significant challenges. Subsequently, we categorized the experimentally observed CO bands into three groups based on the calculated frequencies of adsorbed CO as a reference: CO-physisor (2060–2200 cm−1), CO-top (1940–2060 cm−1), and CO-bridge (1800–1940 cm−1), as shown in Figure S15. By integrating the intensities within each category, we observed an interesting phenomenon that the integrated intensity showed a non-linear and non-uniform trend with respect to CO2RR rates (Figure 3b–d). This suggests a complex relationship between CO adsorption and CO2RR, which deserves further investigation.
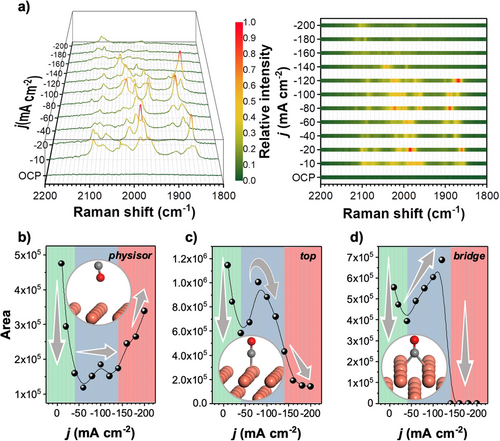
At low CO2RR rates (< −40 mA cm−2), increasing the j or the reaction rate led to a gradual decrease in the intensity of all bands for adsorbed CO (Figure 3b–d). This phenomenon is probably relevant to the conversion of adsorbed CO to post-CO intermediates. As j increases (−40 to −140 mA cm−2), the CO supply to post-CO intermediates becomes sufficient, resulting in the increase of CO intensities. The order of wavenumbers determined by DFT calculations indicates that the stability of adsorbed CO species follows the order of CO-physisor < CO-top < CO-bridge (Figure S17), which agrees well with the observed signal intensity changes; the CO-physisor tends to be constant, CO-top initially increases and then decreases due to the conversion to CO-bridge, and then CO-bridge steadily increases along with the increase of the CO2RR rate (Figure 3b–d). When j became more than −140 mA cm−2, the intensity for CO-physisor increased continuously, implying that the CO supply exceeded its consumption (Figure 3b). In contrast, the intensity for CO-top and for CO-bridge decreased and disappeared, respectively (Figure 3c,d). This behavior possibly indicates the rapid formation of post-CO intermediates from the stably adsorbed CO intermediates, such as CO-top and CO-bridge, at high CO2RR rates. This explanation may also be related to our observation of a larger Tafel slope for C2H4 above −150 mA cm−2 (Figure 2f), suggesting an acceleration of the C─C coupling in the high j range. Thus, the above integration analysis of the Raman signals clearly showed a sequential change of intermediates depending on the reaction rate on the Cu surface in CO2RR. In addition, the observed multiband features associated with the dynamic adsorption of CO include variations in Raman shift and intensity, which are possibly due to interactions between different intermediates. To explore this, we focused on the impact of CO intermediates, in particular CH2, which we selected as a representative post-CO intermediate because signals from CH2 seem to have a particular relevance to signals from C─C coupling intermediates (see Figure 4a for details). We examined the interaction between CO and CH2 by DFT calculations and found that it causes complex shifts in the Raman spectrum of CO, including both red and blue shifts, reflecting the dynamic nature of these interactions (Figure S18). Other post-CO intermediates may also contribute to this complex phenomenon, which therefore warrants further investigation to gain deeper insights in future studies.
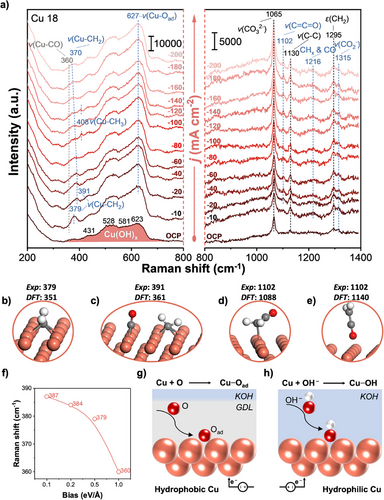
We then consider the adsorption of CO2RR intermediates in the low Raman shift region. When a j of −10 mA cm−2 was applied, a prominent Raman peak appeared at 379 cm−1, whereas no distinct band was observed near 280 and 360 cm−1,[8, 33] which are usually assigned to CO vibrations (Figure 4a). The absence of typical Raman bands at 280 and 360 cm−1 led us to consider alternative interaction dynamics on the electrode surface. Initially, this might seem unexpected, but given the complexity of CO2RR intermediates, it is reasonable to explore the possibility of asymmetric coupling between CO and CHx. This line of thought is supported by both theoretical and experimental evidence. DFT calculations showed that co-adsorption of CO and CHx could suppress CO vibrational signals (Figures S19–S22), aligning with observations from CO co-electrolysis studies involving CH3I and CH2CH3I, where similar peaks were absent.[22] These findings suggest that the peak at 379 cm−1 is related to Cu─CH2 vibrations (Figure 4a), providing a consistent and credible explanation for the observed phenomenon. When j was increased to −20 mA cm−2, the peak at 379 cm−1 was blue-shifted to 391 cm−1. At the same time, the peak at 1102 cm−1 became apparent (Figure 4a), which is located in the C─C═O region (1120–1090 cm−1) (Table S2). These observations may indicate that the blue shift of the Cu─CH2 peak is associated with the C─C coupling process, where CH2 species undergo nucleophilic attack on CO species to form an intermediate containing a carbonyl group.[22] Vibrational frequency calculations for all possible configurations of CH2 species interacting with Cu(100) revealed that the most stable is CH2 adsorbed at a 4F site (CH2-4F), which exhibits a vibrational peak at 351 cm−1 (Figure S19). To better reflect realistic reaction conditions, we further examined the influence of solvent and electric field on the vibrational peak of the CH2 species, and the corresponding adsorption energies are summarized in Table S3. Under solvent effect, the peak shifted slightly to 347 cm⁻¹, while applying an electric field strength of 1 eV Å−1 resulted in a slight shift to 348 cm⁻¹ (Figure S20). These findings indicate that the effects of solvent and electric field on the vibrational frequency of the CH2 species are relatively minor. Interestingly, this calculated frequency closely matched the observation of CH2 adsorption at 379 cm−1 (Figure 4b). Furthermore, we calculated the co-adsorption of CO and CH2-4F on Cu(100), suggesting that the vibrating CH2 readily interacts with the neighboring CO (Movie S2) and that all co-adsorbed configurations of CO and CH2 lead to a blue shift of the calculated 351 cm−1 peak to those with higher wavenumbers (Figure 4c and Figure S20). Interestingly, the co-adsorption of CO with CH2 in all states destabilizes CH2 (Figures S21 and S22), clearly explaining the observed decrease in intensity accompanying the blue shift of the Cu─CH2 peak from 379 to 391 cm−1 (Figure 4a).
To further confirm the assignment of the 1102 cm−1 peak (Figure 4a), we recorded the Raman spectrum of acetaldehyde, the simplest multicarbon carbonyl compound. Acetaldehyde exhibited a Raman peak at 1115 cm−1 corresponding to the C─C═O stretching mode (Figure S23). Furthermore, we calculated vibrational frequencies for all possible configurations of CH2CO interacting with Cu(100) (Figure S24), and found that the calculated frequency at 1088 cm−1 is in close agreement with the spectral results, albeit with a slight red shift compared to the observed peak at 1102 cm−1 (Figure 4a,d). Bond order analysis revealed an elongated C═C bond between CH2 and CO with a bond order of 1.683 in the CH2CO intermediate (Figure S25). This result is consistent with the hypothesis that ketene (CH2═C═O) serves as a critical intermediate in C2+ formation, as recently reported.[49-51] Based on this, we performed additional calculations for the physisorbed state of CH2CO on Cu, resulting in a DFT calculated frequency of 1140 cm−1 (Figure 4e). We therefore propose that CH2CO relevant to the 1102 cm−1 peak should be located at the Cu-NWA interface facing the alkanethiol GDL. In addition, we observed a broad band at approximately 1216 cm−1, which is very close to 1223 cm−1 of the unassigned peak observed for acetone, which contains both CH3 and CO (Figure S26). Therefore, we propose that the 1216 cm⁻¹ peak may be attributed to the coexistence of CHx and CO, serving as a precursor for the C─C coupling process. However, this interpretation requires further in-depth investigation. Future studies employing more rigorous experimental and analytical techniques will be essential to validate this assignment and to gain a comprehensive understanding of the formation mechanism of this intermediate and its specific role in the coupling process.
We also detected a weak peak for a Cu─CH3 stretching vibrational mode at 408 cm−1 in the spectra at j of −100 and −140 mA cm−2 (Figure 4a). This finding was confirmed in previous studies of the electrolysis of CH3I on Cu.[22] Furthermore, the Cu─CH2 peak at 391 cm−1 became less prominent when j exceeded −60 mA cm−2, suggesting that the applied voltage may influence CH2 adsorption on Cu (Figure 4a). DFT calculations indicated that a low bias (0.1 eV Å−1) results in a significant blue shift of the Cu─CH2 signal (CH2-4F) from 351 to 387 cm−1 (Figure 4f). As the bias voltage is further increased (0.1–0.5 eV Å−1), the extent of the blue shift becomes smaller (387–379 cm−1), and at the highest bias voltage (1.0 eV Å−1), it finally shows a red shift (360 cm−1). These theoretical trends are consistent with the experimentally observed red shift of the CH2 peak from 391 to 370 cm−1 with an increasing j from −60 to −200 mA cm−2 (Figure 4a). We then proceeded to further analyze the Raman peaks associated with non-CO2RR intermediates to aid in the exploration of CO2RR pathways.
Influence of Oxygenated Species on Selectivity and Reaction Rate
At OCP, the broad bands with peaks at 431, 528, 581, and 623 cm−1 are attributable to the formation of hydroxide (OH) species on Cu 18, denoted Cu(OH)x (Figure 4a), since these spectral features agree well with those of Cu(OH)2 (Figure S27).[36] The X-ray diffraction (XRD) pattern of Cu 18 corresponded to that of metallic Cu (Figure S28), suggesting that the surface of Cu-NWA in Cu 18 is covered by OH species, whereas the bulk of Cu-NWA is composed of metallic Cu. When a j was applied, the intensity of the 627 cm−1 peak, which was assigned to the stretching mode of Cu─Oad was increased on Cu 18 (Figure 4a).[26, 27] The formation of these oxygenated species can be explained by considering that oxygen-containing species are trapped in the interlayer formed between the Cu-NWA surface and the alkanethiol GDL, and Cu prefers to adsorb oxygen species, resulting in the formation of Cu─Oad on Cu 18 under the applied j (Figure 4g).[52] In contrast, the corresponding peaks on Cu 6 became weaker when j was applied (Figure S29). This result is consistent with the relatively low selectivity for C2+ products on Cu 6 as the C2+ selectivity has been found to be strongly dependent on the adsorption of O species on the Cu surface.[2, 53] Furthermore, the broad bands attributed to the Cu(OH)x on Cu 6 became weaker with the increase of j, indicating partial reduction of Cu(OH)x. Simultaneously, the band at 700 cm−1 resulting from the Cu─OH stretching mode was enhanced on Cu 6 (Figure S29),[54, 55] which is related to the reaction between the Cu surface and OH− from the KOH electrolyte (Figure 4h) since a similar phenomenon was also observed during electrolysis without CO2 on Cu 6 (Figure S30). At the same time, several Raman signals appeared at 892, 1015, and 1112 cm−1 on Cu 6, which gradually increased with the increase of j (Figure S29). To clarify the origin of these peaks, we measured the Raman spectra for Cu 6 during electrolysis in the absence of CO2 and observed the similar peaks located at 892 and 1112 cm−1 (Figure S30), which can be assigned to the surface species formed by the interactions of Cu 6 and the KOH electrolyte, rather than CO2-related species. Considering that the alkyl group in 1-hexanethiol can be hydroxylated by OH− in the KOH electrolyte to form C─OH, we further analyzed the Raman spectrum of ethanol, which contains C─OH. Interestingly, ethanol exhibited Raman peaks at 883 and 1097 cm−1, close to those at 892 and 1112 cm−1 on Cu 6, indicating the presence of intermediates exhibiting C─C─O stretching on Cu 6 (Figure S31 and Table S2). These results suggest that the GDL of 1-hexanethiol on the Cu 6 surface probably interacts with strongly basic KOH, leading to the formation of a hydrophilic C─O─H group, which causes the disruption of the hydrophobic environment on Cu 6 (Figure S32). Consequently, the hydrophilic nature of the Cu 6 surface limits the CO2 diffusion, leading to the gradual accumulation of bicarbonate, as evidenced by the band at 1015 cm−1 on Cu 6 (Figure S29),[33] thereby deteriorating the CO2RR rate.[38, 39] The assignments of additional peaks observed on Cu 18 and Cu 6 are summarized in Table S4. Next, we discuss the CO2RR pathways based on the discovered important CO2RR intermediates.
CO2RR Pathways for C2+ Formation
On Cu 18, the Tafel slope for C2H4 formation at low j (below −120 mA cm−2) was measured to be 65 mV dec−1 (close to the theoretical 59 mV dec−1).[43, 56] This result indicates a one-electron pre-equilibrium step preceding the rate-determining step (Figure 2f). Therefore, we propose that the formation of CH2 involves the 1-electron pre-equilibration process of CH2OH dehydration prior to the rate-determining step of CH2 coupling with CO. Importantly, this rate-determining step does not have to involve electron transfer (Figure 5a). Based on these considerations, we evaluated the formation energy of CH2 from CO. Although we considered several possible pathways for the CH2OH formation (Figure S33), we did not observe any obvious signals attributable to HCO in the 1740–1725 cm−1 region (Figure S34). Furthermore, the adsorption energies of HCO on Cu(100) (−0.941 to −2.749 eV) are consistently less negative than that of COH (−3.385 eV), suggesting that the HCO intermediate is inherently less stable than COH in this system (Figures S35 and S36). Therefore, we propose that the pathways for CH2OH formation are CO→COH→CHOH→CH2OH (Figure 5b). DFT calculations indicated that CH2-4F is more favorable to form than that of CH2-bridge on Cu(100). This preference results from the exothermic fast hydrogenation of CO-4F to COH-4F compared to the endothermic hydrogenation of CO-bridge to COH-bridge (Figure 5b). Furthermore, the dehydration process of CH2OH to form CH2-4F is more exothermic than the dehydration of CH2-bridge (Figure 5b). In addition, we further calculated the activation energy barrier for the coupling of CH2 and CO to determine which adsorbed CO is more likely to couple with CH2-4F and found that the activation energy for the coupling of CH2-4F and CO to form CH2CO does not depend on the adsorption site of CO; 0.76 eV for CO-top and 0.81 eV for CO-bridge (Figure 5c). This conclusion is consistent with the observation that the intensity of adsorbed CO-top and CO-bridge shows similar trends in the spectra (Figure 3c,d). This result suggests that both CO-top and CO-bridge may act as active intermediates. Although there is some debate in the literature as to whether CO-bridge is an active species or a spectator,[57, 58] our study supports that CO-bridge also plays an active role in CO2RR. To further support the feasibility of this coupling step, we investigated the geometric and electronic nature of the CH2─CO co-adsorbed states. DFT calculations revealed that in both the CH2-4F + CO-top and CH2-4F + CO-bridge configurations, the adsorbates are positioned at a C─C distance of 3.767 and 3.769 Å, respectively (Figure S18), indicating a pre-coupling state without direct bond formation. Although the adsorbates are not yet covalently bonded, their proximity allows for electronic interaction, as confirmed by slight redshifts in the C─O vibrational frequencies (from 2012 to 1997 cm−1 for CO-top, and 1880 to 1867 cm−1 for CO-bridge) and marginally more negative adsorption energies. These perturbations arise from weak dipole–dipole interactions and local charge redistribution, as further supported by our electron density difference analysis (Figure S37). These findings provide a structural and electronic rationale for the moderate activation energies observed and support the mechanistic relevance of both CO-top and CO-bridge in the rate-determining CH2─CO coupling step. Additionally, in this study, we investigated the possibility of symmetric CO─CO coupling. As shown in Figure S38, the adsorption of a CO molecule at the top site near a preadsorbed CO-4F on Cu(100) has a relative energy of −1.04 eV, and the formation of the adsorbed CO─CO intermediate results in a relative energy of +0.01 eV. Thus, in comparison to the asymmetric formation of CH2CO (Figure 5c), the CO─CO species is thermodynamically less stable. Furthermore, the activation energy for the symmetric CO─CO coupling is 1.22 eV, which is larger than the activation energies for CH2 and CO coupling of 0.76 and 0.81 eV (Figure 5c). Therefore, CO─CO formation is not only thermodynamically disfavored but also kinetically hindered, reinforcing the dominance of the asymmetric CH2─CO coupling pathway in our system.
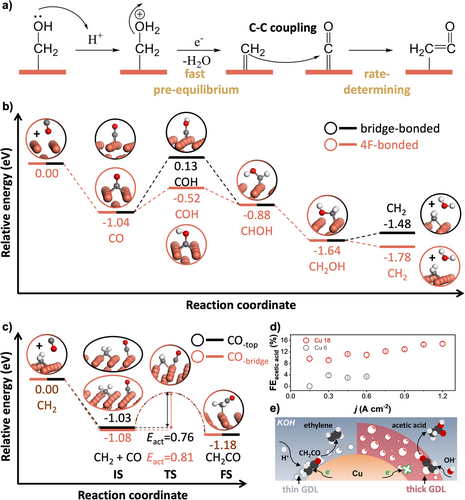
It is essential to investigate how CH2CO is further converted into target C2+ products. We observed a significant difference in selectivity among C2+ chemicals (Figure 2c and Figure S39), especially in the case of acetic acid, for which the FE on Cu 18 was more than four times that on Cu 6 (Figure 5d). Previous reports indicate that higher local pH favors selectivity towards acetic acid.[51, 59] Both CH2CO and acetic acid formation involve the 8-electron reduction of CO2. Therefore, we propose that the formation of acetic acid is derived from the direct hydroxylation of CH2CO. This selective hydroxylation of CH2CO is strongly influenced by the thickness of the alkanethiol GDL because the most noticeable difference between Cu 18 and Cu 6 is the thickness of their thiol layer on Cu-NWA. Here, we clarify that the preference of CH2CO for further electron transfer or hydroxylation depends on its proximity to the Cu surface. CH2CO close to the Cu surface is more likely to receive electrons and participate in hydrogenation to form hydrocarbons such as ethylene, whereas CH2CO further from the surface is more likely to undergo hydroxylation by OH⁻,[4] leading to acetic acid formation (Figure 5e). Based on these results, we conclude that the selectivity of specific C2+ products is closely linked to the local environment surrounding the CH2CO intermediate. This insight into the relationship between interface tailoring and product formation pathways represents a significant contribution to the field, and further exploration in this direction could lead to the development of new strategies for optimizing CO2RR products. In the future, the modulation of the CH2CO skeleton and surrounding intermediates will lead to a more diverse set of products centered around the CO2RR.
Conclusion
In this study, we designed a Cu-NWA electrode and optimized the structure of the Cu-GDL-electrolyte interface to enhance the Raman signals of intermediates involved in CO2RR by leveraging composite surface resonance. Our in-situ Raman spectra employing Cu 18 exhibited exceptionally high-intensity Raman signals of CO2RR intermediates, allowing the detection of dynamic changes in adsorbed CO, as well as the successive appearance of elusive post-CO intermediates, including CH2, CO coexisting with CH2, CH2CO, and CH3. DFT calculations were performed to describe the C─C coupling process resulting from the asymmetric coupling of CO and CH2 to form CH2CO. Furthermore, we have carefully investigated the fast pre-equilibrium and rate-determining steps for the C─C coupling and proposed the plausible sequential pathways for the formation of C2+ chemicals, in particular ethylene and acetic acid. These findings provide valuable insights that contribute to a deeper understanding of CO2RR mechanisms and open up exciting opportunities for the development of a diverse product network in CO2RR.
Supporting Information
The authors have cited additional references within the Supporting Information.[60-73]
Acknowledgements
The authors thank Prof. N. Tanaka, Department of Applied Chemistry, Kyushu University. The authors thank Dr. A. Anzai and Dr. M. Liu for their help with TEM measurements. The authors thank Japan Science and Technology Agency grant JPMJFS2132 (M.S.). Japan Society for the Promotion of Science Grants-in-Aid for Scientific Research 18H05517, 22K19088, 23H00313, and 24H02205 (M.Y.). Moonshot Research and Development Program JPNP18016 (M.Y.) Natural Science Foundation of Jiangsu Province BK20241422 (M.S.).
Conflict of Interests
The authors declare no conflict of interest.
Open Research
Data Availability Statement
The data that support the findings of this study are available from the corresponding author upon reasonable request.


