Deciphering Reversible Homogeneous Catalysis of the Electrochemical H2 Evolution and Oxidation: Role of Proton Relays and Local Concentration Effects**
A previous version of this manuscript has been deposited on a preprint server (https://doi.org/10.26434/chemrxiv-2023-p8tcp).
Graphical Abstract
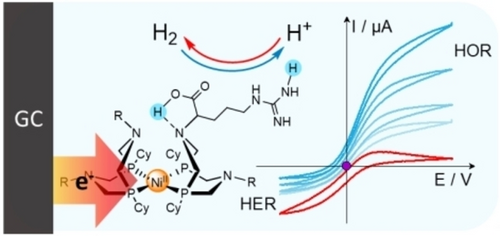
Analytical treatment allows determining all thermodynamic and kinetic parameters of reversible electrocatalytic oxidation and production of dihydrogen mediated by DuBois/Shaw nickel bisdiphosphine complexes bearing pendant bases. This analysis shed light on the key activity descriptors responsible for reversible vs. bidirectional catalysis and paves the way towards rational optimization of such molecular catalysts
Abstract
Nickel bisdiphosphine complexes bearing pendant amines form a unique series of catalysts (so-called DuBois’ catalysts) capable of bidirectional/reversible electrocatalytic oxidation and production of dihydrogen. This unique behaviour is directly linked to the presence of proton relays installed close to the metal center. We report here for the arginine derivative [Ni(P2CyN2Arg)2]6+ on a mechanistic model and its kinetic treatment that may apply to all DuBois’ catalysts and show that it allows for a good fit of experimental data measured at different pH values, catalyst concentrations and partial hydrogen pressures. The bidirectionality of catalysis results from balanced equilibria related to hydrogen uptake/evolution on one side and (metal)-hydride installation/capture on the other side, both controlled by concentration effects resulting from the presence of proton relays and connected by two square schemes corresponding to proton-coupled electron transfer processes. We show that the catalytic bias is controlled by the kinetic of the H2 uptake/evolution step. Reversibility does not require that the energy landscape be flat, with redox transitions occurring at potentials up to 250 mV away for the equilibrium potential, although such large deviations from a flat energy landscape can negatively impacts the rate of catalysis when coupled with slow interfacial electron transfer kinetics.
Introduction
Hydrogenases are remarkably efficient reversible natural catalysts.1 They have inspired a number of molecular catalysts of the electrochemical production and oxidation of dihydrogen (H2) also called HER (hydrogen evolution reaction) and HOR (hydrogen oxidation reaction).1b, 2 Among those, only one series of nickel bisdiphosphine complexes, called DuBois’ catalysts, exhibits bidirectionality,3 and to a small extent, reversibility.4 A remarkable breakthrough in terms of reversibility was achieved by further work from Shaw and DuBois with a series of similar complexes integrating amino-acid substituents.5 Recent work demonstrated that appropriate integration of these molecular catalysts into carbon nanotube-based electrodes could allow to maintain reversible HER/HOR catalysis in aqueous acidic conditions compatible with the proton-exchange membrane H2 fuel-cell and electrolysis technologies with mass activities for the Ni center only one order of magnitude away from benchmark Pt electrodes.6

A convenient way to investigate these systems is to observe their behavior as catalysts of the HER and HOR by means of cyclic voltammetry (CV).9 These effects have been analyzed in details with the simple example of a one-electron/one-proton irreversible catalytic system10 under canonical conditions, in which diffusion and chemical steps combine within a thin reaction-diffusion layer through which the substrate concentration remains constant.9c The treatment of the molecular catalysis of two-electron reversible reactions has been recently provided considering general reaction schemes without specific description of the nature of the steps involving the proton relays as above stated.11 Building on such work, the purpose of the present work is to provide the first thorough kinetic analysis of a two-electron reversible system supported by formal kinetics of reversible two electron catalytic systems. This analysis emphasizes the critical role of proton relays taking the example of the arginine derivative, [Ni(P2CyN2Arg)2]6+ (Figure 1),5c, 5d which was selected for its remarkable reversibility properties and because of its solubility in water. The latter property indeed simplifies the pH-dependency investigation, an essential basis of the mechanism and kinetics discussion.
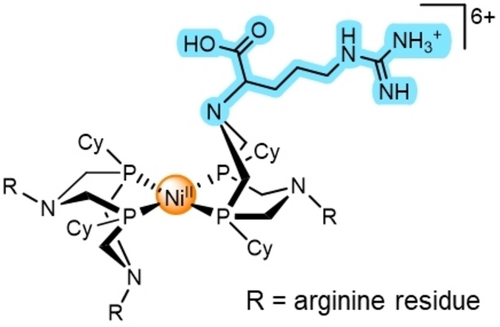
Structure of [Ni(P2CyN2Arg)2]6+, each R−N moieties stands for a protonated arginine residue similar to that highlighted in blue.
We will first summarize the catalytic properties measured with this complex under different experimental conditions. Then we will show how Pourbaix diagrams can be constructed and identify the above-mentioned fast deprotonation and reprotonation processes required for closing the catalytic loop. We will then propose a comprehensive reaction scheme relevant to this remarkable molecular system and develop a thorough analysis for extracting all the kinetic constants and reveal the key features allowing bidirectionality and reversibility.
Results and Discussion
Raw catalytic CV data
All experiments were carried out in buffered aqueous solutions. Based on previously reported data,5c, 5d a temperature of 40 °C was selected to measure catalytic currents that are both sizeable at low scan rates (down to 0.05 V s−1) and low enough to be overcome at fast scan rate (5 V s−1 and upwards). CV catalytic currents are indeed decreasing functions of the dimensionless parameter  where
where  is the scan rate, k the first order or pseudo-first order rate constant of the catalytic reaction, T the temperature, R the gas constant and F the Faraday constant.9b
The CVs are recorded at a glassy carbon electrode (surface area S =0.02 cm2) in 0.05 M 2-(N-morpholino)ethanosulfonate (MES) buffer added with 0.05 M Na2SO4 (unless stated otherwise) or in 0.1 M sulfuric acid solutions, at a series of pHs varying from 1 to 9 in the absence of H2 or in the presence of 1 atm. H2. The moderately low water solubility of the catalyst, and hence the small concentration used (50 or 100 μM), results in CV responses showing a substantial double layer capacitive charging current on top of which appears the faradaic responses of interest. Raw data had thus to be corrected from the double layer charging current before going to the kinetic analysis via subtraction of a blank CV recorded in the absence of catalyst (examples are given in Figure S1). Another consequence of the poor water solubility of the catalyst is its facile adsorption onto the electrode surface, which had to be carefully polished before each run.12 Typical background corrected CV responses obtained at low scan rate are shown in Figure 2, showing archetypal steady-state S-shaped responses characteristic of canonical kinetic conditions.9c
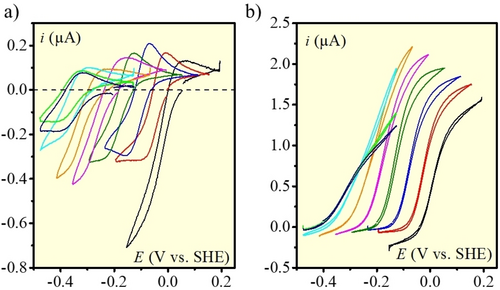
Background corrected catalytic responses measured at a glassy carbon electrode at 40 °C and 0.1 V s−1 in a) the absence of H2 and b) under 1 atm. H2 at various pH values: 1 (black), 2 (red), 3 (blue), 4 (green), 5 (magenta), 6 (orange), 7 (cyan), 8 (light green), 9 (navy). Catalyst concentration: 100 μM in 0.05 M MES buffer (+0.05 M Na2SO4) or 0.1 M sulfuric acid solutions.
Catalysis being revealed by the S-shape of the CV response and the height of the plateau current, the experiments under H2 indicate in the first place that catalysis is bidirectional: the same catalyst is indeed able to catalyze the oxidation of H2 and the reduction of proton from the solution. Within this framework, it is observed that, in the presence of saturated H2 atmosphere (Figure 2b), H2 oxidation catalysis is much more pronounced than H2 evolution catalysis. In the latter case, significant catalysis only appears at the lowest pH values, both in the absence and presence of H2. Conversely, the catalytic plateau currents for H2 oxidation are significant at all pH values and increase between low and intermediate pH values.
It is also remarkable that the potentials at which the CV responses stand are practically the same for H2 oxidation and evolution, which reflects reversible catalytic behavior. The equilibrium potentials experimentally measured from CVs (Figure 2b) at i=0 at various pH values data (theoretically corresponding to 0 V vs. RHE) are plotted in Figure S2 and overlaid with the theoretical curve. It is seen that the agreement is fair but a substantial deviation is observed at pH above 7 indicating that the equilibrium is maybe more difficult to reach. This resonates with the fact that both reductive and oxidative catalytic currents decrease at pH values above 7 concomitantly with a flattening of the catalytic response. We nonetheless observe at pH<6 a slight anodic shift (of ca. 10–35 mV depending on the pH value) of the experimental value compared to the theoretical value (Figure S2). We do not have a definite explanation for this shift that might be due to some junction potential. This shift was added in simulations described below to get a match with the experimental data.
Finally, the HER currents observed in the absence of H2 (Figure 2a) are significantly higher (with a two-fold factor at pH=1) than when H2 is present (Figure 2b), a typical behavior for product-hindered catalytic kinetics that has been already reported for such reversible catalysts5, 6c and hydrogenase enzymes.1d
Thermodynamics characteristic of the NiII/NiI system
Pourbaix diagrams can be very useful to understand the catalytic properties of such bidirectional systems, as exemplified by Muckerman and coworkers a decade ago.13 To establish such a diagram, we first recorded a set of CV responses over the whole pH range at 40 °C and at a scan rate high enough to overcome catalysis.9b, 9c Reversible signals could be measured at all pH values and are shown in Figure 3a.
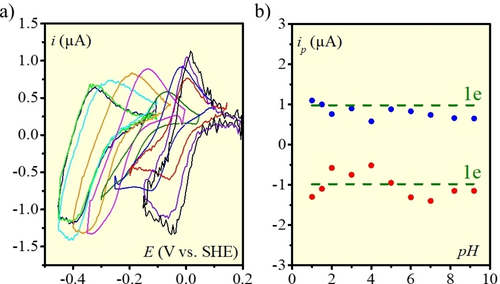
a) Background corrected CV responses at 40 °C and 50 μM catalyst concentration in the absence of H2 at a scan rate of 5 V s−1 at various pH values: from right to left:, 1 (black), 1.5 (violet), 2 (red), 3 (blue), 4 (green), 5 (magenta), 6 (orange), 7 (cyan), 8.2 (light green), 9.2 (navy). b) Electron stoichiometry of the CV responses (see text). Electrolyte: 0.1 M MES, pH adjusted with H2SO4 or NaOH.
 (1)
(1)relating, in the case of a fast, diffusion controlled electron transfer, the peak current, ip, to the surface area S (0.02 cm2), the catalyst concentration C0 (50 μM), the scan rate v, the temperature T (313.16 K) and the diffusion coefficient D (in cm2 s−1). For the latter we used 2.8×10⁻⁶ cm2 s−1, a value previously determined by Shaw and co-workers using NMR pulsed field gradient methods.5d, 15 From these data, we can conclude that the electron stoichiometry is 1.
The Pourbaix diagram (Figure 4a) positioning the NiII and NiI species of the system in their different protonation states can then be obtained by relating the pH value and the apparent standard potential16 derived from the midpoint between the anodic and cathodic one-electron peaks (Figure 3a). It is worth noting that the slope of the central descending straight-line (62 mV per pH unit) in Figure 4a corresponds to the value expected for a one-electron/one-proton process at the operating temperature (40 °C). The ensuing zones of thermodynamic stability of the various reactants are as shown in Figure 4b. In the following, we will represent by the subscript letter “r” a properly positioned amine acting as proton relay, “+Hr” representing a protonated form of the relay.
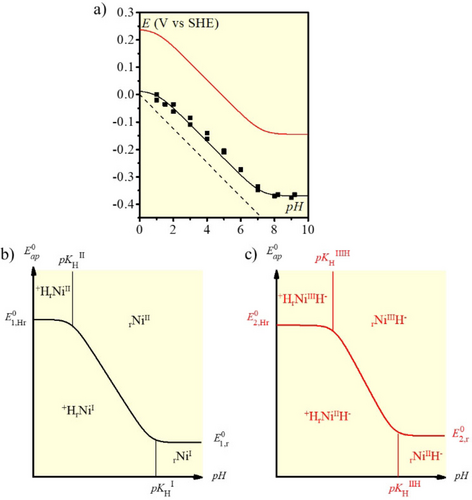
a) Black dots: Apparent standard potential vs. pH (Pourbaix diagram) in the same conditions as in Figure 3. The dashed straight line shows the apparent standard potential of the H+/H2 couple at this temperature.15 The black full line corresponds to the fitted apparent standard potential vs. pH according to equation (2) (see text). The red full line corresponds to the Pourbaix diagram of square scheme 2 in Figure 5, according to equation 14 (see text). b) Domains of thermodynamic stability of the Pourbaix diagram of the square scheme 1 in Figure 5. c) Domains of thermodynamic stability of the Pourbaix diagram of the square scheme 2 in Figure 5.
 (2)
(2)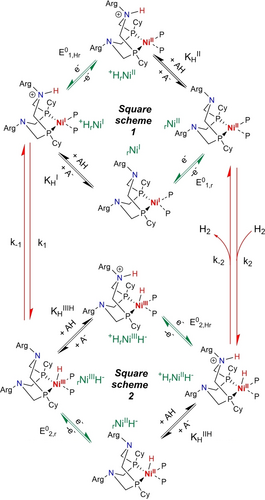
Catalytic reaction scheme. The Ni catalyst structure has been simplified to only show one diphosphine ligand with one properly positioned amine as proton relay. In the notation indicated in green, proton relays are represented by the subscript letter r under their deprotonated forms and +Hr under their protonated forms.


The Pourbaix diagram (Figure 4) confirms that rNiII gets protonated at low pH values, as previously demonstrated by NMR measurements,5a, 5d and in line with previous determination of pKa values for pendant amines of the same complex (pKa=0.64 in water for the rNiII/ +HrNiII).17 The pKa value at which the NiI species is protonated is significantly higher, around 7, in line with the increased basicity of a complex with a reduced overall charge following reduction of the Ni center.
Insights into the nickel-hydride species and overall mechanistic scheme
As highlighted by Muckerman and coworkers,13 getting a comprehensive understanding of the catalytic system requires gaining data for the redox couples involving metal-hydride intermediates. To that aim, we recognize that, under 1 atm. H2, rNiII is fully converted into the doubly protonated/doubly reduced species +HrNiIIH− as previously demonstrated by UV-visible spectroscopy18 and 31P NMR measurements.5a, 5d, 19
In an attempt to get the thermodynamic values characterizing a second square scheme involving such metal-hydride species, CVs were recorded at 5 V s−1 under 1 atm. H2 (Figure S3). At such high scan rate, we were expecting to characterize solely the one-electron oxidation of NiII-H into NiIII-H species. Unfortunately, we observe that, at all pH values, the oxidation wave is bielectronic and that the return reduction wave is smaller, likely monoelectronic. This indicates that, starting from +HrNiIIH− (or rNiIIH− at pH values > 7), it is not possible to isolate the lower square scheme 2, shown in Figure 5, only involving NiII-H and NiIII-H species. In other words, the NiIII-H species reacts fast in a way allowing their further oxidation. This resonates with the key property of this family of catalysts20 and with the expected role of a proton relay,3c, 7, 21 allowing for fast intramolecular proton transfer generating +HrNiI from rNiIIIH− via the concentration effect discussed in the introduction.7 Hence, the bielectronic oxidation wave observed at 5 V s−1 starting from +HrNiIIH− (or rNiIIH− at pH values > 7)17 captures its proton-coupled oxidation to rNiIIH−, intramolecular deprotonation of the hydride species by the pendant base generating the +HrNiI species (characterized by the k-1 constant in Figure 5) and oxidation of the former into a NiII species. Consistently with the measurements shown in Figure 3, the return reduction wave is monoelectronic and corresponds to the formation of a NiI species. Here the protonation of the NiI to form the NiIII-H species actually involved in catalysis (characterized by the k1 rate constant in Figure 5 and thus observed at lower scan rate) is too slow to be observed at 5 V s−1.
Figure 5 gathers all the mechanistic elements assembled so far with the two square schemes (only the upper one, i.e. square scheme 1 is fully characterized at the moment) connected on the right by the previously reported hydrogenation equilibrium (hereafter named C2 with the K2=k2/k−2 thermodynamic constant)5a, 19 and on the left by the intramolecular proton transfer step (hereafter named C1 with a K1=k1/k-1 thermodynamic constant) discussed just above.
In the H2 evolution process, fast proton-coupled reduction of the rNiII species generates +HrNiI (square scheme 1). Then intramolecular proton transfer converts +HrNiI into rNiIIIH−; this step is characterized by the equilibrium constant K1, and, although it is fast in the H2 oxidation direction (see above), it may be rate determining for H2 evolution. rNiIIIH− is in equilibrium via proton coupled electron transfer (PCET) with +HrNiIIH− (square scheme 2). From this species, dihydrogen can evolve through a second potentially rate-determining chemical step, characterized by the equilibrium constant K2, closing the loop between both one electron/one proton square schemes and enabling catalysis. H2 oxidation can proceed through the reverse pathway thanks to activation of H2 by the frustrated Lewis pair formed between the pendant proton relay and the NiII ion, to generate +HrNiIIH−. Here again fast PCET generates rNiIIIH− (square scheme 2), which undergoes rapid intramolecular hydride deprotonation by the pendant base to reach the upper square scheme 1.
Although introducing a new doubly-branched structure, the mechanistic scheme shown in Figure 5 actually captures most of the catalytic sequences proposed so far,3c, 5a, 5c, 5d, 17 with the exclusion of those initially proposed and involving a non-protonated Ni0 intermediate, that we know from the Pourbaix diagram that it is not accessible under the experimental conditions used here. The introduction of the two square schemes in the model allows including pathways avoiding high energy intermediates over the whole range of pH values. Importantly, this scheme allows to differentiate between the intermolecular proton transfer steps (within the two square schemes) that are diffusion-controlled and vital to regenerate the catalytic species and maintain catalysis7 and the intramolecular proton transfer steps, involving the formation or the cleavage of metal-hydride and H−H bonds positioned vertically on the left and right sides. These chemical steps, C1 and C2, involving changes in the formal oxidation state and coordination sphere of the central nickel ion, are likely to be rate determining in one or the other direction.
Thermodynamics of the chemical steps
The intramolecular proton transfer between rNiIIIH− and +HrNiI likely remains at equilibrium under catalytic conditions where CV responses have S-shaped canonical forms as represented in Figure 2b. Obviously, this equilibrium is strongly displaced with k-1≫k1 and thus  but no direct evaluation of
  is possible at this stage. Still, as shown later on, it will be possible to extract kinetic information from the data gathered at 5 V s−1 under H2 atmosphere once the thermodynamics of the intramolecular proton transfer has been indirectly evaluated from the analysis of the catalytic response at pH>7.
The hydrogenation equilibrium involving +HrNiIIH− and rNiII can be characterized by UV/Visible spectroscopy, similarly to other DuBois/Shaw catalysts.18 Measurements carried out under various partial pressures of H2 allowed the evaluation of  20 (see Supporting Information for details, Figure S4) when
  =1 atm. In other words,
  with
with  = 20 and
  =1 atm. Stable spectra are obtained within seconds after mixing and the observation of an isosbestic point is a strong indication that the equilibrium conditions were met, although this value certainly captures reversible isomerization of +HrNiIIH− into other doubly protonated Ni0 species.5c


with  .
.
Because the pendant amine is not electronically linked to the nickel active site, we can make the assumption that its pKa is only sensitive to electrostatic effects from the active site. Hence we make the assumption that complexes with the same overall charge, i.e.  and
and  on the one side and
  and
and  on the other side have similar pKa’s, which leads to
  and
and  . This hypothesis is further supported by previous estimation of the
  value between 6.8 and 7.9.17
 (3)
(3) (4)
(4)As already mentioned, the determination of  is not possible at this stage. Nonetheless, with the thermodynamic parameters obtained so far, we can first attempt to interpret the catalytic CV responses shown in Figure 3b considering, as a first approach, that the two squares schemes in Figure 5 are at equilibrium, i.e., assuming fast protonation/deprotonation of the pendant amine over a large range of pH from acid/base couples in the solution, either MES or sulfate-based buffer or water acid/base couples.
Simplified reformulation of the reaction mechanism and analytical treatment

 (and
(and  ) is a pseudo first-order rate constant (in s−1) including the concentration of H2; hence we can write:
  where
where  is the partial pressure of H2 and
  is 1 atm (similarly, we will define
  ). At equilibrium (i.e. at current nil), we have:
 (5)
(5)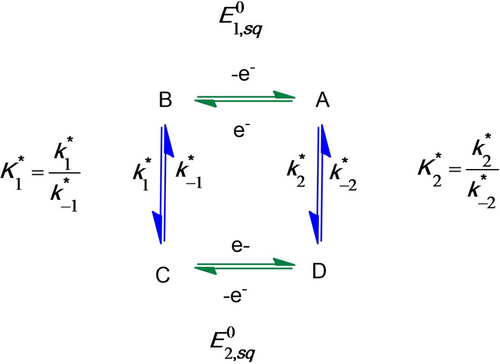
Simplifying reformulation of the reaction mechanism of Figure 5.
 (6)
(6) (7)
(7) and the nickel hydride
  is simply obtained by considering
  and
and  in the general expression thus leading to:
 and
and  can be easily obtained from a combination of the plateau currents:
 (9)
(9) (10)
(10) knowing that
  , application of equation (9) and (10) gives
  and
and  . Then, by application of equation (7), we obtain the averaged values:

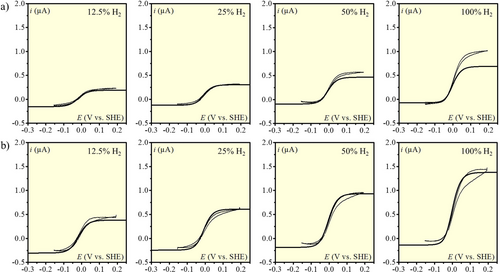
HER and HOR at pH=1, v=50 mV s−1, [Ni(P2CyN2Arg)2]6+ at a) 50 μM and b) 100 μM. Partial H2 pressure in the gas phase: 12.5; 25; 50 and 100 % (from left to right). Thin line: experimental data. Thick line: simulation with analytical expression (equation 8).
Analysis of the catalytic data for pH=1
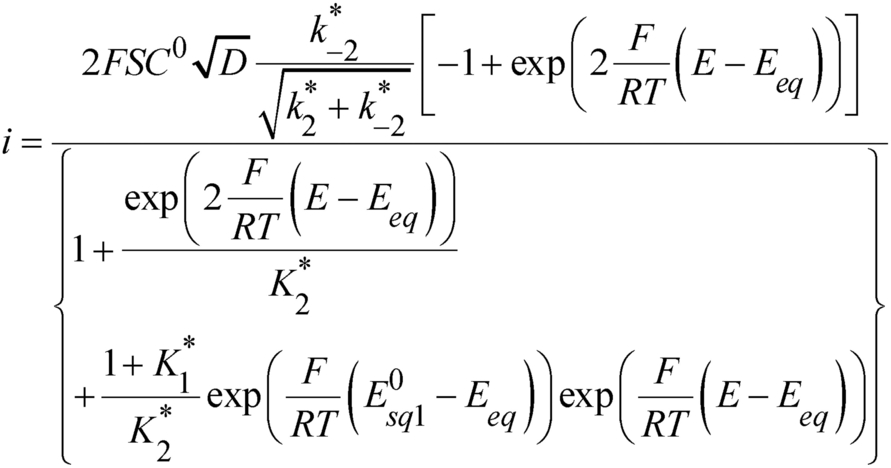
In principle, simulations of the CVs according to the analytical expression (equation 8) could provide an evaluation of  and hence of
  because it is the only unknown parameter. However, simulations show that any value corresponding to
  < 0.1 leads to satisfactory fitting (see Figure S5). Using equation 5, only an upper value of
  can thus be obtained from this set of data:
  < 0.2. Simulations considering
  and taking into account the experimental deviation of
  (Figure S2) are shown in Figure 7 together with the experimental data. Excepted for one experimental condition (upper right panel) where the anodic current is clearly off,22 a fair agreement is obtained between experiments and simulations showing the consistency of the analysis as the shape of CVs in between the two plateaus is correctly reproduced. Remarkably, a single set of determined parameters allows reproducing the decrease of the anodic plateau current and the increase of the cathodic plateau current as H2 partial pressure is decreased. This is a strong validation of the proposed model and its analytical expressions when taking into account the explicit linear dependence of
  with
with  .
.
Analysis of the catalytic data for 1<pH<6
With all required parameters in hand, we can now calculate the plateau currents at different pH values (taking into account the pH dependence of  ,
,  and
and  ). As shown in Figure 8, the model predicts that the anodic plateau current increases as pH is increased and it is indeed observed experimentally. The reason for this increase is that the relay on +HrNiII gets fully deprotonated at pH>2 therefore increasing the amount of rNiII available in solution for H2 uptake. Consequently, the observed increase of the anodic plateau current from pH=1 to pH=4 is a confirmation that the pKa of +HrNiII (
 ) is indeed close to 1 as previously determined17 and guessed from the Pourbaix diagram where the inflexion of the apparent standard potential is barely seen (Figure 4a).
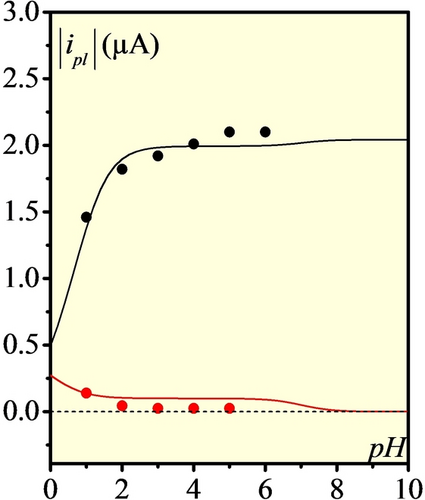
Absolute values of plateau currents (anodic in black and cathodic in red) as function of pH for 100 μM [Ni(P2CyN2Arg)2]6+ under 1 atm H2 at 50 mV s−1 and 40 °C. Dots correspond to experimental values taken from data presented in Figure 2, lines to simulations.
Analysis of catalytic data measured at pH >7 and determination of remaining thermodynamic data
 +HrNiIIH−
 rNiIIH−
 rNiIIIH−
 +HrNiI
 rNiI
rNiI rNiII (and vice versa for H2 evolution). Here deprotonations (PT) of +HrNiIIH− and +HrNiI have the same moderate driving force because the pKa of +HrNiIIH− and +HrNiI are close to 7 while the pKa of the buffer base (MES) is 6.15. Plateau currents being related to the characteristics of the chemical steps (PT, C1 and C2) and C1 and C2 being pH independent, the observed deviation of the plateau current from predictions given by equation (8) necessarily implies that at least one proton transfer step should not be considered at equilibrium, the effect being larger for the PT step not following or preceding the slow C2 chemical step. In other words, the simple equivalent ECrECr mechanism shown in Figure 6 has now to be replaced by another simple four elements scheme corresponding to an EPrECr sequence with the thermodynamic and kinetic parameters defined in Figure 9 together with:
 (11)
(11)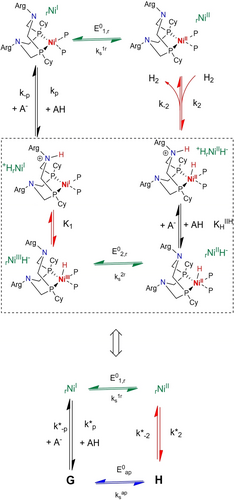
Catalytic reaction scheme at pH >7; A− and AH correspond to base and acids in solution, i.e. OH−, H3O+ and constituents of the MES buffer.
taking into account that  and with
  (see Supporting Information for details).
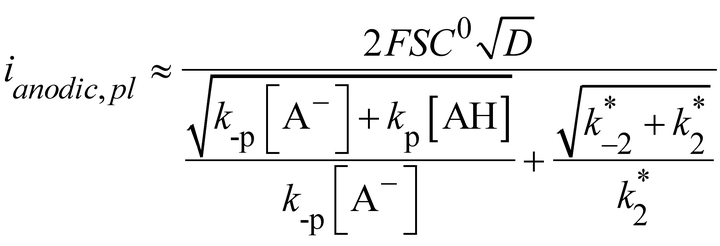
Application of equation (12) to the experimental anodic plateau currents at pH=8 we obtain  10 s−1 and
  63 s−1 for rate-determining protonation and deprotonation steps. These pseudo-first order protonation/deprotonation rate constants can be rationalized as follows. Protonation can arise from AH=H3O+ with a rate constant equal to 109 M−1s−1, i.e. close to diffusion limit in line with a reaction with a large driving force. Alternatively the buffer (MES) acid form can be the source of proton with a second order rate constant being only 1.4 104 M−1s−1 as a consequence of the small driving force unable to compensate the fact that the pendant amine is buried into the ligand sphere. Regarding deprotonation, if hydroxide ion is considered as proton acceptor, the deprotonation rate constant is 6 107 M−1s−1 whereas it would be only 1.25 103 M−1 s−1 with the buffer base. Again these values are in agreement with the corresponding driving forces and accessibility of the solution base to the proton relay.
 0.05 cm s−1 corresponding to the redox couple rNiII/ rNiI.9 Fitting the CV at pH=8 considering the simplified reaction scheme depicted in Figure 9 and the already evaluated thermodynamic and kinetic parameters
  ,
,  ,
,  ,
,  ,
,  ,
,  and
and  ) gives the adjusted parameter
  2×10⁻⁴ cm s−1 (see Figure S6 and details for simulations in the Supporting Information). As shown in the Supporting Information, assuming a Butler–Volmer type kinetic law for the rNiIIIH−/ rNiIIH− couple with a transfer coefficient equal to 0.5, the apparent standard rate constant is:
If we assume that both redox couples rNiII/ rNiI and rNiIIIH−/ rNiIIH− have similar reorganization energy associated to electron transfer, then  and therefore
  allows evaluating
  2 10−5 via equation (13). As a consequence, from the relationships previously derived linking
  ,
,  and
and  (equations (3) and (4)) we obtain
  and
and  thus providing a complete thermodynamic characterization of the reaction scheme shown in Figure 5.
Such a positive positioning of the standard potential of the NiIIIH/NiIIH couples (in both protonation states of the relay) compared to the NiII/NiI couple is in full agreement with previous calculation on cobalt-based H2 evolution catalysts: the standard potentials of the CoIIIH/CoIIH couples of cobaloximes24 and cobalt diimine-dioxime complexes25 were also found positive by 100 and 130 mV to the respective CoII/CoI couples.
 (14)
(14)We can now come back to the data gathered at 5 V s−1. under 1 atm. H2 (Figure S3) to evaluate the kinetics of the fast, energetically unbalanced, intramolecular proton transfer step C1. The scheme to be considered is an ECE process corresponding to the D/C/B/A sequence in Figure 6 as if there were no chemical connection between A and D because hydrogen uptake/evolution is too slow to be efficient at 5 V s−1. Simulations of the CV taking into account values of  ,
,  and
and  show that the position of the anodic peak requires that
  is in the order of 5×10⁹ s−1 (Figure S7) and thus
  105 s−1. This is in line with a very fast intramolecular proton transfer in both direction and remaining at equilibrium in catalytic conditions. Still, according to the theoretical investigation of the ECE process,26 the contribution of the second electron transfer remains small in the cathodic peak provided
  is small, typically smaller than 0.1. At 5 V s−1 and considering the evaluated values of
  and
and  , this condition is achieved for pH>1, in line with the observation of the monoelectronic waves described earlier in the absence of H2 (Figure 3a).
All parameters corresponding to the reaction scheme in Figure 5, and their compacted version in Figure 6 (valid at pH<7) and in Figure 9 (valid at pH>7) have now been evaluated. Simulation of the whole CVs with the analytical expression (equation (8)) are shown in Figure 10b for pH=1 to 6. For pH=7 to 9, numerical simulations were performed (see Supporting Information for details) according to the reaction scheme in Figure 10. As shown in Figures 10 and S6, this single set of parameters allow to obtain a good agreement of the proposed model with the experiments performed over the whole range of pH values. This is also true when catalysts concentrations and partial pressures of H2 are varied as previously shown in Figure 7. Importantly the data at pH>7 illustrate the critical role of equilibrated proton transfers to exogenous acid/base couples to maintain efficient catalysis. The HOR turnover frequency is indeed partially limited by proton transfer in basic conditions.27
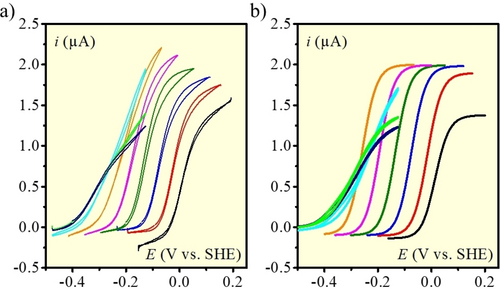
HER and HOR at 1 (black), 2 (red), 3 (blue), 4 (green), 5 (magenta), 6 (orange), 7 (cyan), 8 (light green), 9 (navy). v=0.1 V s−1, [Ni(P2CyN2Arg)2]6+ 100 μM, under 1 atm H2. Comparison a) experiments and b) simulations. See text for details on simulations.
Turnover frequencies, catalytic bias and reversibility
We have shown that, at pH<7, the critical chemical step for both HER and HOR is H2 uptake and evolution. Chemical step C2 is thus the one to be optimized to get a better catalyst. Indeed, the proton relay is responsible for the high local concentration allowing fast intramolecular proton transfers in both directions for chemical step C1.
It also appears that the catalyst is catalytically biased,28 being much more efficient for HOR than HER at all pH values. The bidirectionality of the catalyst is made possible because the slowest process in both directions, H2 uptake and evolution, is fast enough (respectively 10 s−1 at 1 atm H2 and 0.5 s−1) for a substantial current to flow at moderate scan rate. This study confirms that the presence of the proton relay installed inside the catalyst molecule close to its metallic active site, thus forming a frustrated Lewis pair to capture and activate H2 during HOR and allowing for optimal hydride proton coupling during HER, is key for bidirectionality.
 and
and  (equation 7). Hence the pH variation of the apparent rate constants (Figure 11) shows the effect of relays protonation/deprotonation on the kinetic of both HER and HOR catalysis. Because the intramolecular proton transfer is fast, the maximal turnover frequencies correspond to
  and
and  , as shown in reference:29
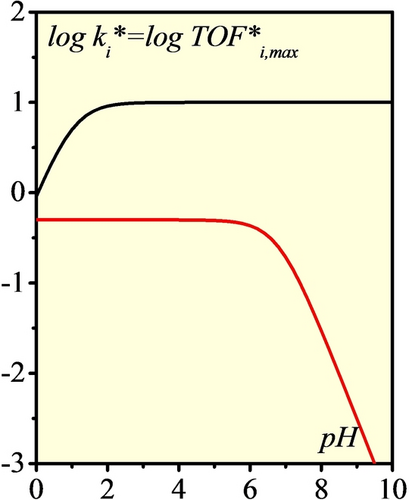
Apparent chemical rate constants and maximum turnover frequencies (log scale) as function of pH under 1 atm. H2:  (HOR, black),
  (HER, red).
At low pH, H2 uptake competes with the protonation of the relay in rNiII leading to a small decrease of the catalytic HOR current. The same applies at high pH, but at the expense of catalytic HER current which is almost shut-down due to an unfavorable protonation of the relay preceding H2 evolution. We note here that the pH variation of maximal turnover frequencies (Figure 11) and of plateau currents (Figure 8) are not identical because the plateau currents are also related to the size of the diffusion reaction layer that are pH dependent.29 Nonetheless, from equations 15 and 16 (or 9 and 10), the catalytic bias seems to be controlled by, and only by, the K2 value convoluted with protonation equilibria, which favors, in the present case, H2 uptake over evolution. This is at variance with previous models, that were relating the catalytic bias to the positioning of the H+/H2 equilibrium with the Pourbaix diagram of the catalytic system.30
Besides bidirectionality, one remarkable feature of the present system is its reversibility. As discussed by Fourmond et al.,11 there is no need for every chemical step to be thermoneutral (equilibrium constant close to unity) to achieve reversibility. It is indeed illustrated experimentally by the present example (Figure 12). Despite the mismatch between the pKa of the proton relay functionality ( ) and the pKa of the active site hydride (
 ) estimated from the value of pK1=4.7, the system is reversible over a large range of pH. Actually, this unbalanced equilibrium (
 ≪1) is compensated by the Pourbaix diagram corresponding to the second square scheme in Figure 5 being ca. 250 mV more positive than that of the first square scheme (Figure 4), so that Eq. 5 is fulfilled with Eeq=0 V vs RHE. Such a positioning of the two Pourbaix diagrams correspond to the inverted configuration making the second PCET step always easier than the first one whatever the direction (HER or HOR) of catalysis. This configuration is the only one that allows for reversibility, with the limit being a superposition of the two Pourbaix diagrams. Noteworthy, this condition applies to the apparent E0sq potentials values, taking into account the various protonation equilibra. Note that it is even not required for the two Pourbaix diagrams of the catalyst to overlap the Pourbaix diagram of the catalyzed reaction.
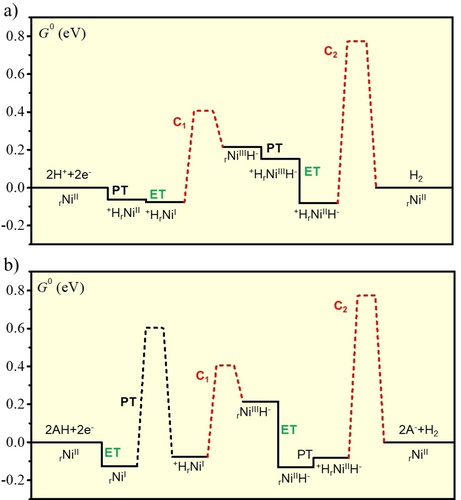
Energy landscape (in eV) at the equilibrium potential at a) pH = 0, b) and pH = 8. The free enthalpy barriers (dotted lines) were evaluated from the rate constants using as pre-exponential factor kBT/h=6 1012 s−1).
An important finding is that large deviations from a flat energy landscape may still be detrimental to the rate of catalysis as observed here for pH>6. The unbalanced energetics of chemical step C1 compensates the large deviation of the second Pourbaix diagram from the equilibrium potential of the H+/H2 reaction (and vice-versa) (Figure 12b) but this has consequences on the reversibility of the system. Indeed, for catalysis to take place at small overpotential (i.e. with substantial current at potentials close to the equilibrium potential), an electron transfer must occur far away from its standard potential. This is illustrated in Figure 12b where the driving force for the electron transfer rNiIIH−  rNiIIIH− has a driving force as large as 0.33 eV at pH=8 (Note that the driving force is only 0.24 eV at pH=0). This results in an apparent slowness of the electron transfer when this electron transfer is directly coupled to the energetically unbalanced intramolecular proton transfer as it is the case in the dominant pathway at pH>7. This effect does not modify the bidirectionality nor the catalytic bias, i.e. the turnover frequencies, but it slows down the apparent reversibility corresponding to a sluggish increase of the current around the equilibrium potential.
Conclusion
We show here that a model based on elements from the first and second coordination spheres suffice to explain the reactivity of the system, with the outer sphere obviously playing a role to tune the properties of these elements so as to fulfill the conditions required to reach reversibility and maybe also preventing the system to follow other routes towards inactivation. The kinetic treatment developed here allows a satisfactory fit of the experimental data for reversible catalysis of the oxidation and production of dihydrogen to and from acids over a large range of pH values, partial H2 pressure and catalyst concentration.
The reversibility of catalysis appears from (i) unbalanced chemical steps thermodynamically compensating the deviation of the redox potentials of the catalyst from the equilibrium potential of the catalyzed reaction, (ii) fast intramolecular proton transfers due to concentration effects inherent to the presence of the installed amine group, acting here as proton relay and (iii) the relative efficiency of the reversible H2 insertion step enabled by the frustrated Lewis pair formed by the pendant amine and the Ni center. Importantly, we confirm here that reversibility does not required a flat energy landscape11 as previously advocated following the Sabatier principle.31 Nevertheless, our study shows that large deviations from a flat energy landscape requires interfacial electron transfers to occur far from their standard potential, which impacts their kinetics and the overall rate of catalysis. At that point, the rate of catalysis may be limited by the efficiency of deprotonation/reprotonation of the relays, a concern that also holds for the design of improved monodirectional electrocatalysts.
The catalytic bias measuring the bidirectionality is directly impacted by local concentration effects allowed by the presence of proton relays integrated within the catalyst molecule close to its metal center and allowing for the capture and heterolytic splitting of H22c and the effective and reversible formation and deprotonation of a nickel-hydride species.
The success of the described treatment in predicting correctly the experimental data is an encouraging benchmarking test of the general methodology consisting in identification of the key kinetically limiting processes. Indeed, the possibility of mastering such a profuse reaction mechanism rests on the distinction between the (generally) diffusion-controlled chemistry of the proton-coupled electron transfers that are involved the reaction and the “slower” chemistry involving the central metal and its coordination sphere, here hydrogen insertion and evolution. We hope that the methodology developed here can inspire the study of other reversible molecular catalysts, for example in the context of water oxidation32 or CO2 valorization.33
Experimental Section
Experimental section is detailed in the Supporting Information together with additional cyclic voltammetry, UV/Visible absorption data and numerical simulations.
Acknowledgments
A significant part of the present work should be credited to the late Prof. Jean-Michel Savéant who contributed to the definition, via the patient and exigent analysis of initial measurements, of the operating conditions range used to record the set of data that finally allowed fully characterizing this complex reversible system using the concepts he developed10 with reasonable confidence. Prof. Jean-Michel Savéant was also at the origin of the comprehensive mechanism displayed in Figure 5 illustrating the role of fast proton relays and high local concentration effect. He intuited and demonstrated that this complex double square scheme mechanism involving up to 10 steps can be converted into the much simpler 4-step reaction scheme shown in Figure 6, performed the patient analytical derivation and contributed to a significant amount to a previously submitted version of this manuscript. This work was supported by the Agence Nationale de la Recherche (Labex ARCANE, CBH-EUR-GS, ANR-17-EURE-0003) and the Fuel Cells and Hydrogen 2 Joint Undertaking (FCH-JU, GAN 779366). FCH-JU receives support from the European Union's Horizon 2020 research and innovation program, Hydrogen Europe and Hydrogen Europe research.
Conflict of interest
The authors declare no conflict of interest.
Open Research
Data Availability Statement
The data that support the findings of this study are available from the corresponding author upon reasonable request.


