High-Performance Lithium Metal Batteries Enabled by a Fluorinated Cyclic Ether with a Low Reduction Potential
Graphical Abstract
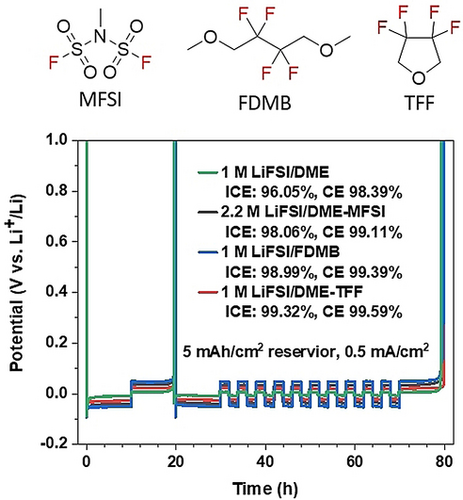
Two cosolvents, MFSI and TFF, were synthesized and investigated for lithium metal batteries. Among the four different electrolytes, the TFF-containing electrolyte exhibited the highest coulombic efficiency of 99.59 %, which is due to the low redox potential of TFF promoting the anion reduction, leading to an inorganic SEI formation.
Abstract
Electrolyte engineering is crucial for developing high-performance lithium metal batteries (LMB). Here, we synthesized two cosolvents methyl bis(fluorosulfonyl)imide (MFSI) and 3,3,4,4-tetrafluorotetrahydrofuran (TFF) with significantly different reduction potentials and add them into LiFSI-DME electrolytes. The LiFSI/TFF-DME electrolyte gave an average Li Coulombic efficiency (CE) of 99.41 % over 200 cycles, while the average Li CEs for MFSI-based electrolyte is only 98.62 %. Additionally, the TFF-based electrolytes exhibited a more reversible performance than the state-of-the-art fluorinated 1,4-dimethoxylbutane electrolyte in both Li||Cu half-cell and anode-free Cu||LiNi0.8Mn0.1Co0.1O2 full cell. More importantly, the decomposition product from bis(fluorosulfonyl)imide anion could react with ether solvent, which destroyed the SEI, thus decreasing cell performance. These key discoveries provide new insights into the rational design of electrolyte solvents and cosolvents for LMB.
Introduction
With the highest specific capacity (3860 mAh g−1) and the lowest redox potential (−3.04 V versus the standard hydrogen potential), lithium (Li) metal anode is considered as the ultimate choice for high-energy batteries.1-4 However, its application is hindered by the Li dendrite growth during cycling, which stems from unavoidable Li/electrolyte side reactions and the formed organic-rich solid electrolyte interphase (SEI), which cannot suppress Li dendrite growth.5 The Li dendrite growth accelerated Li consumption and eventually cause battery failure and safety concerns.5-8 An ideal SEI for Li dendrite suppression should be inorganic SEI that is mechanically strong and has a weak binding (high interface energy) to Li, which promotes Li planar growth along the interface of Li/SEI but suppresses Li vertical growth into SEI. However, the organic-rich SEI formed in commercial carbonate electrolytes cannot satisfy these requirements.
Electrolyte engineering can tune SEI composition thus improving Li-metal reversibility.5 The solvent molecules and salt anions are unstable reducing into SEI at a low voltage. The final SEI composition is mainly controlled by the solvent or salt that has a high reduction potential since the formed SEI at a high potential suppresses the following reduction reaction at a low potential. In addition, the solubility of formed SEI in the electrolyte also alerts the final composition of SEI. Compared to organic-rich SEI, inorganic-rich SEI is mechanically more stable, less soluble in the electrolytes, and has a weaker binding to Li, therefore, thus it inhibits Li dendrite growth yielding a high coulombic efficiency (CE). Since solvent reduction forms organic-rich SEI, while salt anions (PF6−, FSI−, etc.) reduction forms inorganic SEI, the most successful strategy to form inorganic-rich SEI is to promote the anion reduction but suppress solvent reduction through high-concentration electrolytes,9-13 localized high concentration electrolytes (LHCEs),14-18 or weakly solvating electrolytes.19-26 Among them, LHCE is unique due to the decreased number of Li+ coordination solvents and low viscosity, leading to a low desolvation energy and the formation of anion-derived SEI (inorganic SEI). In LHCEs electrolytes, the function of “inert” diluent is mainly to reduce the viscosity without changing aggregates and contact ion pairs structure of high-concentration electrolytes. Recent results demonstrated that the diluents also get reduced at a low potential, which can also be used to tune the SEI component. Diluents can be functioned as a cosolvent to tune the SEI. However, the design principle for the important component diluent is lacking.
Here, we designed and synthesized two cosolvents that have a significantly different reduction potential and investigated their roles in LiFSI-DME based electrolytes for lithium metal batteries. The cyclic fluorinated ether 3,3,4,4-tetrafluorotetrahydrofuran (TFF) has a low reduction potential of 0.57 V vs. Li+/Li, which is significantly lower than that of salt anions FSI−. Inspired from the “magic” anion FSI−,27, 28 we also designed and synthesized its analogue methyl bis(fluorosulfonyl)imide (MFSI). MFSI has a high reduction potential of 2.5 V, which is higher than that of FSI−. Both TFF and MFSI have a low Li+-solvation capability but highly miscible with 1,2-dimethoxyethane (DME), thus they were added into LiFSI/DME electrolyte to form localized high concentration electrolytes (LHCEs). Both 2.2 M LiFSI/DME-MFSI and 1.0 M LiFSI/DME-TFF electrolytes render LHCEs. Their solvation structures were similar and confirmed by 7Li NMR and molecular dynamic (MD) simulations. The key difference of the two electrolytes is MFSI and TFF diluent, which have a significant reduction potential. MFSI has a higher reduction potential than FSI− anions, while TFF molecule has a much lower reduction potential than FSI− anions. Therefore, the SEI in 2.2 M LiFSI/DME-MFSI is mainly produced by the reduction of MFSI molecule and FSI− anion, while the SEI in TFF electrolyte is mainly derived from decomposition of FSI− anions. The 1 M LiFSI/DME-TFF electrolyte gives an average Li CE of 99.41 % at 0.5 mA cm−2 and 1 mAh cm−2 in Li||Cu half-cell over 200 cycles, while the average Li CEs for the high reduction potential 2.2 M LiFSI/DME-MFSI electrolyte is only 98.62 %. The high Li CEs for 1 M LiFSI/DME-TFF electrolyte is attributed to the formation of the inorganic-rich SEI from the reduction of FSI− anions as demonstrated by X-ray photoelectron spectroscopy (XPS). The mass spectra of cycled electrolytes indicate that the inorganic SEI is also less soluble in 1 M LiFSI/DME-TFF electrolyte than that in the 1 M LiFSI/DME electrolyte. Additionally, the initial decomposed product Li(FSO2NSO2Li) from FSI− anion is partially soluble in 1 M LiFSI/DME electrolyte and reacted with DME solvent to form more soluble Li(FSO2NSO3CH3) and Li(FSO2NSO3CH2CH2OCH3). Therefore, the SEI formed in 1 M LiFSI/DME electrolyte is less effective to suppress the side reactions between Li anode and electrolytes, leading to a low coulombic efficiency. While in 1 M LiFSI/DME-TFF, Li(FSO2NSO2Li) is almost insoluble, thus it's more effective to passivate Li anode and achieve a high CE. The robust SEI formed in 1 M LiFSI/DME-TFF electrolytes exhibited a more reversible performance than the state-of-the-art electrolyte 1 M LiFSI/FDMB in both Li||Cu half-cell and anode-free Cu||NMC811 (LiNi0.8Mn0.1Co0.1O2) full cell. The anode-free Cu||NMC 811 with 1 M LiFSI/DME-TFF shows a capacity retention of more than 60 % after 100 cycles at room temperature. Design solvent/cosolvent to achieve a low reduction potential and low solubility to the SEI provide new direction for future electrolyte engineering.
Results and Discussion
To achieve inorganic-rich SEI for Li metal anode, we designed and synthesized two cosolvent molecules MFSI and TFF for LiFSI/DME electrolytes (Figure 1a). The adaptation of MFSI is inspired by its structural similarity with FSI− anion, aiming to form inorganic-rich SEI after reduction at a high potential. Meanwhile, a cyclic fluorinated ether TFF with a low reduction potential is designed and synthesized as a cosolvent for LMB electrolytes. Comparing with the well-studied linear fluorinated ether 1,1,2,2-tetrafluoroethyl-2,2,3,3-tetrafluoropropyl ether (TTE), TFF only has four fluorine atoms per molecule, thus, it has a slightly lower density (1.37 g mL−1 for TFF vs. 1.53 g mL−1 for TTE) and higher LiFSI solubility (the solubility of LiFSI is 1.5 times higher in TFF than that in TTE solvent in Figure S1a). The slightly higher LiFSI solvation ability of TFF enables to use more TFF (or slightly lower LiFSI overall concentration, Figure S1b) in the LHCEs. Since both MFSI and TFF have a very low LiFSI solvation capability, DME is selected as the strong solvent because it is compatible with Li anode and high voltage cathode in LHCEs.8, 9, 17 Because MFSI and TFF have a significant reduction potential but a low and similar solvation ability to LiFSI, they are used as model compounds to study how solvent reduction potential influence Li anode reversibility.
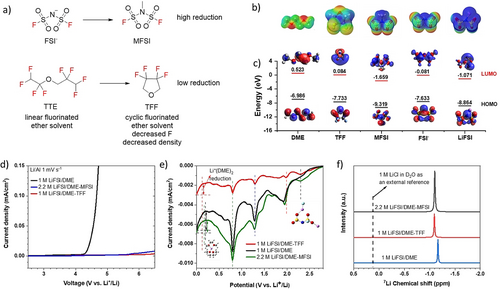
a) Design scheme and the molecular structures of MFSI and TFF; b) ESP surfaces, the ESP surfaces were depicted in the range of −0.1 to 0.1. The red and blue regions represent a negative charge and positive charge, respectively; c) HOMO and LUMO of DME, TFF, MFSI, FSI−, and LiFSI; d) LSV of three electrolytes in Li||Al half cells at 1 mV s−1; e) LSV reduction of Li||Cu cells at a scan rate of 0.2 mV s−1 from 2.8 V to 0 V; f) 7Li NMR of three different electrolytes.
Table S1 lists the key physical properties of the DME, MFSI, and TFF solvents and corresponding electrolytes. Both MFSI and TFF have a negligible solubility for LiFSI but high solubility with LiFSI/DME solution (LiFSI in DME at a molar ratio of 1 : 1.2). To enable a good ionic conductivity, their molar ratio with LiFSI and DME was selected as LiFSI: DME: MFSI=1: 1.2: 2 and LiFSI: DME: TFF=1: 1.2: 7. The overall salt concentration for MFSI and TFF based electrolytes are 2.2 and 1 M, respectively. At room temperature, the ionic conductivities of these electrolytes are 2.34 and 3.31 mS cm−1 as shown in Figure S2. The electrolyte densities are 1.35 g mL−1 for TFF-electrolytes and 1.58 g mL−1 for MFSI-electrolyte.
To gain insight into the structure–property relationship of the electrolytes at the molecular level, density-functional theory (DFT) was used to calculate the electrostatic potential (ESP) surfaces, highest occupied molecular orbital (HOMO) and lowest unoccupied molecular orbital (LUMO) energy levels of DME, TFF, MFSI, FSI− and LiFSI (Figure 1b). The ESP calculation suggests that the negative charges of those molecules were concentrated on O atoms. Moreover, the positive charges were widely distributed in MFSI and TFF molecules, suggesting a decreased Li+ solvation capabilities to that of DME. The HOMO and LUMO energy levels are related to the oxidation and reduction stabilities of these isolated molecules. The LUMO energy levels increase in the order of MFSI (−1.659 eV)<LiFSI (−1.071 eV)<FSI− (−0.081 eV)<TFF (0.084 eV)<DME (0.0523 eV) in Figure 1c, indicating the cosolvent MFSI will be preferentially reduced on the Li anode surface than the anions, followed by the FSI−, TFF and DME. The assumption was further evidenced by quantum chemistry calculations (Figure S3). It was found that the reduction potential of non-coordinated DME is −1.7 V, which verified its excellent stability towards Li metal. The reduction potential of MFSI and TFF are 2.5 V and 0.57 V, respectively, indicating MFSI preferentially participate in SEI formation comparing with TFF.
To experimentally verify the oxidation stability of the electrolytes, linear sweep voltammetry (LSV) measurements on Al current collector at a scan rate of 1 mV s−1 at room-temperature are conducted to determine the oxidation voltage (Figure 1d). Unlike the low oxidation voltage of 1 M LiFSI/DME (≈4.2 V), 2.2 M LiFSI/DME-MFSI and 1 M LiFSI/DME-TFF show substantial high-voltage tolerance by giving oxidation voltages at ≈5.5 V and ≈6 V, respectively. This result is coincident with the amount of DME (the one with lowest oxidation resistivity) in the three electrolytes.
The reduction process of the three different electrolytes was measured using LSV on Li||Cu cells from open circuit voltage 2.8 V to 0 V (vs. Li+/Li) at a scan rate of 0.2 mV s−1. As shown in Figure 1e, all three electrolytes show several reduction peaks at above 0.7 V vs. Li+/Li. The reduction peak at 2.3 V in TFF and MFSI based electrolytes are due to the formation of ion aggregates, while no obvious reduction peak was observed at around 2.3 V in 1 M LiFSI/DME electrolyte, indicating a negligible amount of ion aggregates, which is consistent with the 7Li NMR and MD simulations results below. The other cathodic reduction peaks at around 0.8 V, 1.3 V, and 1.9–2 V are similar in three electrolytes, which belong to the different reduction sites of FSI− containing anions complex (Figure S4). The onset potential for the reduction reaction of Li+-coordinated DME in 1 M LiFSI/DME-TFF is around 0.12 V vs Li+/Li, which is lower than that in 1 M LiFSI/DME (0.2 V) and 2.2 M LiFSI/DME-MFSI (0.15 V), indicating the SEI layer in 1 M LiFSI/DME-TFF is the most effective to suppress solvent reduction. The cathodic current from coordinated DME reduction is also smaller in 1 M LiFSI/DME-TFF than that in 1 M LiFSI/DME, indicating that there's less solvent reduction in 1 M LiFSI/DME-TFF electrolyte. Besides, the overall cathodic current in 1 M LiFSI/DME-TFF is much smaller than that in the 1 M LiFSI/DME and 2.2 M LiFSI/DME-MFSI, suggesting the formation of dense SEI in 1 M LiFSI/DME-TFF. Though MFSI has a high reduction potential at 2.5 V by DFT calculation, considering MFSI does not coordinate with Li+, a high overpotential was expected for the reduction of MFSI on Li anode. Therefore, reduction peak of MFSI may overlap with that of Li+-anion aggregates. Besides, the cathodic current between 1.4–1.52 V in 2.2 M LiFSI/DME-MFSI may come from MFSI solvent.
To elucidate the difference between the two electrolytes, 7Li NMR in Figure 1f was conducted to evaluate their Li solvation effect. Compared to the 7Li peak at −1.164 in 1 M LiFSI/DME, the 7Li peak in 2.2 M LiFSI/DME-MFSI and 1 M LiFSI/DME-TFF have downfield shift to −1.100 and −1.093, indicating there are less DME coordinated with Li+ and more FSI− coordinated with Li+ in the first solvation sheath.29 Meanwhile, the negligible difference of 7Li peaks in 2.2 M LiFSI/DME-MFSI and 1 M LiFSI/DME-TFF electrolytes indicates the primary solvation sheath in the two electrolytes are almost identical, which is not surprising given both MFSI and TFF cosolvents have a negligible solvation ability for LiFSI.
MD simulations were performed to further investigate the solvation structure of electrolytes. Figure 2a–c shows the snap-shots of simulated 1 M LiFSI/DME, 2.2 M LiFSI/DME-MFSI and 1 M LiFSI/DME-TFF electrolytes. The Li+ and their primary solvation shells (within 2.8 Å of Li+ ions) are depicted by ball-and-stick model, while the wireframes represent the free solvents. The solvation structures of the three electrolytes were compared by the calculated radial distribution functions (solid lines) and coordination numbers (dash lines) (Figure 2d–f). Sharp peaks of the Li−O(DME) and Li−O(FSI) pair were identified at ≈2.0 Å for all three systems studied, indicating that Li+ was surrounded by both DME molecular and FSI− ion in the first solvation shell. However, the presence of FSI− ion in the first solvation shell of 1 M LiFSI/DME is minor as evidenced by low Li−O(FSI) coordination numbers of 0.4 and high Li−O(DME) of 5.6 within r<2.8 Å. In contrast, coordination numbers of FSI− were significantly increased to 2.1 and 2.6 with the addition of MFSI and TFF, respectively. The results are consistent with the 7Li NMR measurements that the chemical shift of Li+ in 2.2 M LiFSI/DME-MFSI and 1 M LiFSI/DME-TFF are almost identical but different from that in 1 M LiFSI/DME. Moreover, MFSI and TFF molecules are barely found to be coordinated with Li+ in the ternary mixture system (Figure 2e, f). This is also consistent with the negligible Li+ solvation capability of MFSI and TFF. Based on the above, the solvation structure of 1 M LiFSI/DME, 2.2 M LiFSI/DME-MFSI and 1 M LiFSI/DME-TFF electrolytes were schematically shown in Figure 2g, h.
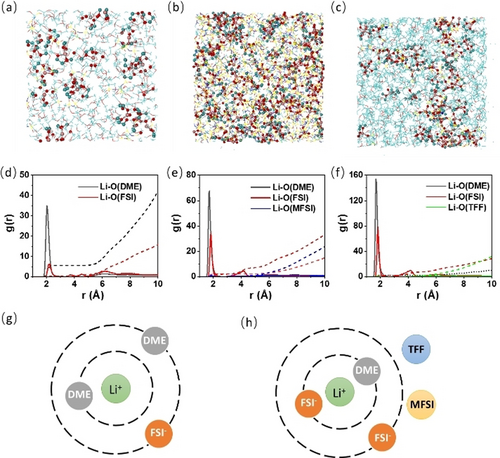
(a–c) Snapshots and (d–f) radial distribution functions (solid lines) and coordination numbers (dash lines) of investigated electrolytes obtained from molecule dynamics (MD) simulation at 25 °C: (a, d) 1 M LiFSI/DME, (b, e) 2.2 M LiFSI/DME-MFSI, (c, f) 1 M LiFSI/DME-TFF. Schematic of Li+ solvation structure in (g) 1 M LiFSI/DME and (h) 2.2 M LiFSI/DME-MFSI or 1 M LiFSI/DME-TFF electrolytes.
The coulombic efficiency (CE) of Li metal in three different electrolytes including 1 M LiFSI/DME, 2.2 M LiFSI/DME-MFSI, and 1 M LiFSI/DME-TFF at room-temperature was measured using Li||Cu half-cell at a current of 0.5 mA cm−2 and capacity of 1.0 mAh cm−2 (Figure 3a). The Li plating/stripping with 1 M LiFSI/DME electrolyte show an initial Coulombic efficiency (ICE) of 88.85 % and become unstable after 30 cycles, while 2.2 M LiFSI/DME-MFSI, and 1 M LiFSI/DME-TFF electrolytes show an ultrahigh ICE of 93.73 % and 97.98 %, respectively. The average CE for the two electrolytes over 200 cycles are 98.62 % and 99.41 %. Their essential cycle number (ECN) to reach a CE >99 % are very different. For 1 M LiFSI/DME-TFF, it only takes 8 cycles to reach a coulombic efficiency of 99 %, while for 2.2 M LiFSI/DME-MFSI, the ECN to reach CE >99 % is up to 130 cycles. The stabilized CE for MFSI electrolyte is 99.1 %, while for TFF electrolyte is 99.6 %, which is one of the highest values ever reported for Li metal batteries.5 To elucidate the difference of TFF- and MFSI-based electrolyte mainly come from the diluents rather than their molar ratio differences in the electrolytes, Li||Cu half-cell performance with LiFSI: DME: TFF (1 : 1.2 : 2) electrolytes were included in Figure S5 in the Supporting Information. The much higher Li reversibility with TFF diluent than that with the MFSI diluent indicates that it's the chemical rather than the molar ratio distinguishes the two electrolytes.
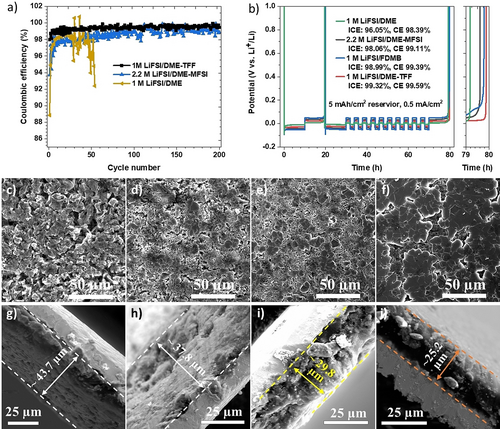
Cycling performance of Li||Cu half-cells at room temperature and the corresponding Li morphology. a) Li coulombic efficiency (CE) measured in Li||Cu half cells with different electrolytes at 0.5 mA cm−2 and 1.0 mAh cm−2. b) Aurbach measurement of CE in Li||Cu half-cells using different electrolytes; c–f) Deposited Li morphology after 30 cycles at 0.75 mA cm−2 and 1.5 mAh cm−2 using different electrolytes: c) 1 M LiFSI/DME, d) 2.2 M LiFSI/DME-MFSI; e) 1 M LiFSI/FDMB, and f) 1 M LiFSI/DME-TFF; g–j) cross-section of the deposited Li with different electrolytes: g) 1 M LiFSI/DME, d) 2.2 M LiFSI/DME-MFSI, e) 1 M LiFSI/FDMB, and f) 1 M LiFSI/DME-TFF.
The state-of-the-art electrolyte 1 M LiFSI/FDMB is included for comparison because FDMB is synthesized from the same precursor as TFF molecule. We further measured the Li CEs in four different electrolytes at room-temperature with Aurbach's method. As shown in Figure 3b, the overpotential of the four electrolytes at 0.5 mA cm−2 is 1 M LiFSI/DME<1 M LiFSI/DME-TFF<2.2 M LiFSI/DME-MFSI<1 M LiFSI/FDMB electrolyte. Clearly, 1 M LiFSI/DME-TFF shows the highest Li CE (99.59 %) compared to the other three electrolytes 1 M LiFSI/DME (98.4 %), 2.2 M LiFSI/DME-MFSI (99.11 %), and 1 M LiFSI/FDMB (99.39 %). Their ICE also follows the same trend, with 1 M LiFSI/DME-TFF showing the highest reversibility.
After Aurbach's Li CE test, the cells were continued to cycle at 0.75 mA cm−2 and 1.5 mAh cm−2 for 30 cycles. The Li||Cu half-cell performances were shown in Figure S6. 1 M LiFSI/DME-TFF electrolyte showed the highest average CE (99.11 %) over 30 cycles, and the average CEs for 1 M LiFSI/FDMB, 2.2 M LiFSI/DME-MFSI, 1 M LiFSI/DME are 98.84 %, 98.01 % and 96.35 %, respectively, which are consistent with Aurbach's test and Li CE measurement at 0.5 mA cm−2 and 1.0 mAh cm−2 (Figure 3a). The morphology of deposited Li after the continued 30 cycles was examined using scanning electron microscopy (SEM) and shown in Figure 3c–f. The deposited Li in 1 M LiFSI/DME electrolyte was highly porous with some Li dendrite formation, while deposited Li in 2.2 M LiFSI/DME-MFSI show much less porous structure. In contrast, the deposited Li with 1 M LiFSI/DME-TFF exhibited much more uniform densely packed, flat, large grains even better than that with reported 1 M LiFSI/FDMB electrolyte, resulting in the better cell performance in Figure 3b.
The cross-section of deposited Li was shown in Figure 3g–j. Obviously, the cross-section of deposited Li in 1 M LiFSI/DME is highly porous with a thickness of 43.7 μm, while it is highly dense in 1 M LiFSI/DME-TFF electrolyte with a thickness of only 25.2 μm. The observed thickness of the deposited Li in 2.2 M LiFSI/DME-MFSI, 1 M LiFSI/FDMB elec-trolytes are 37.8, 29.8 μm, respectively. The thickness of deposited Li is in inverse correlation with their CE performance, because the denser the deposited Li, the smaller surface area of Li, and the less side reactions could happen between Li anode and electrolytes.
The SEI composition on the cycled Li metal in four different electrolytes was analyzed using X-ray photoelectron spectroscopy (XPS). The Li||Cu cells were cycled at 0.5 mA cm−2, 3 mAh cm−2 for 42 cycles, the corresponding CEs were shown in Figure S7. The C 1s spectra in Figure 4a represents the organic species in SEI that derived from the electrolyte solvents. The Li anode cycled in 1 M LiFSI/DME, 2.2 M LiFSI/DME-MFSI and 1 M LiFSI/FDMB showed the signals of C=O, C−O−C, C−C/C−H bond, while the Li anode in 1 M LiFSI/FDMB and 1 M LiFSI/DME-TFF showed an additional carbide peak (LixCHy) at around 282.7 eV, indicating the fluorinated ether FDMB and TFF have participated in the SEI formation. Besides, the overall carbon intensity is much smaller in 1 M LiFSI/DME-TFF and 1 M LiFSI/FDMB, indicating that there was less solvent decomposition in the two electrolytes, leading to their superior performance.
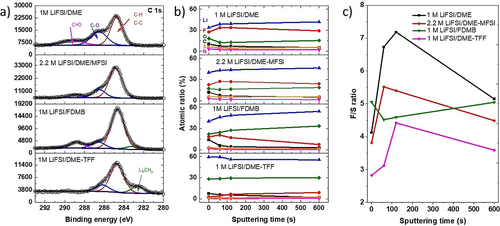
a) The C 1s spectra of the cycled lithium metal anode; b) The XPS atomic ratios of different elements on cycled Li anodes at different depths using different electrolytes; c) The F/S ratio of the SEI in four electrolytes at different depths.
The F 1s spectra in Figure S8a indicates the major form of F species in the SEI in the four electrolytes are LiF. However, a large proportion of FSO2− species (22.3 %) was also observed in 1 M LiFSI/DME electrolyte, the proportion of FSO2− decrease in the order of 2.2 M LiFSI/DME-MFSI (7.6 %) >1 M LiFSI/FDMB (5.5 %) >1 M LiFSI/DME-TFF (2.5 %). The total fluorine intensity also follows the same trend, with 1 M LiFSI/DME showing the strongest F signal and 1 M LiFSI/DME-TFF exhibited the lowest F signal, indicating there are much less side reaction in 1 M LiFSI/DME-TFF electrolyte.
The S 2p spectra in Figure S8b strongly supports this conclusion because it can only form through FSI− or MFSI reduction during SEI formation. In 1 M DME/LiFSI electrolyte, the major sulfur form is SO2F form, with only a small portion of SOx form. While in 2.2 M LiFSI/DME-MFSI and 1 M LiFSI/FDMB electrolytes, the ratio of SO2F and SOx increased, and small amount of S2− and Sn2− were observed. In contrast, the dominated sulfur forms in 1 M LiFSI/DME-TFF are SOx and Li2S, which is consistent with the minimal amount FSO2 in the F spectrum. The dense morphology of cycled Li metal could be attributed to the more thorough reduction of LiFSI salt in 1 M LiFSI/DME-TFF. Besides, the overall sulfur intensity is significantly lower in 1 M LiFSI/DME-TFF compared to the other three electrolytes, indicating there are fewer side reactions from LiFSI in 1 M LiFSI/DME-TFF. O 1s spectra were shown in Figure S8c, however, they should be treated with caution as oxygen-containing compounds could come from the decomposition of FSI anions, solvents, as well as the intrinsic Li2O, LiOH or formed Li2O on the Li anode during XPS sample transfer.
Figure 4b shows the atomic ratios of Li, C, N, O, F, S distribution in the SEI layer of the cycled Li anode at different depths. The predominant elements in 1 M LiFSI/DME and 2.2 M LiFSI/DME-MFSI are Li and F, while the predominant elements in 1 M LiFSI/DME-TFF and 1 M LiFSI/FDMB electrolytes are Li and O. The Li and O contents in the SEI are more than 85 % in all depths in 1 M LiFSI/DME-TFF, which is higher than that in the 1 M LiFSI/FDMB electrolyte. Besides, it also shows much more uniform composition in 1 M LiFSI/DME-TFF than 1 M LiFSI/FDMB electrolytes in all depths, which is consistent with the surface morphology in Figure 3d. The SEI in 1 M LiFSI/DME-TFF has a significantly higher number of inorganic species than that in the other three electrolytes, which could lead to the dense morphology of Lithium deposition in Figure 3f, j and the high Li anode reversibility.
The F/S ratio in four electrolytes at different depths was shown in Figure 4c. If there is no solubility difference for F (e.g., LiF, FSO2) and S (e.g., FSO2, SOx, Sn2−) species in the SEI in the four electrolytes, the theoretical F/S ratio in cycled Li anode for 1 M LiFSI/DME, 2.2 M LiFSI/DME-MFSI, 1 M LiFSI/FDMB, and 1 M LiFSI/DME-TFF electrolyte should be 1, 1, >1, >1. However, the F/S ratios in Figure 4c are all significantly larger than 1. The higher F/S ratio in 2.2 M LiFSI/DME-MFSI than that in 1 M LiFSI/DME-TFF electrolyte was mainly due to the high reduction potential of MFSI. Upon reduction, MFSI formed LiF and FSO2N(CH3)SO2Li. The latter has a higher solubility in the electrolyte than its counterpart derived from FSI−, making it less effective to passivate Li metal and lower Li coulombic efficiency. The F/S is highest in 1 M DME/LiFSI and lowest in 1 M LiFSI/DME-TFF, indicating that the reduction products of FSI− has much higher solubility in 1 M DME/LiFSI than 1 M LiFSI/DME-TFF. The high solubility of decomposed DME species and FSI− in 1 M LiFSI/DME could result in the highly porous structure of deposited Li in Figure 3c, which increases the surface area and accelerates the side reactions between Li metal and electrolytes.
To further confirm this assumption, direct-injection mass spectrometry was used to analyze the cycled 1 M LiFSI/DME and 1 M LiFSI/DME-TFF electrolyte. After disassembling the cells, the Li anodes were first washed with 2 mL DME solvent. The solution was filtered with a 0.45 μm PTFE syringe filter to collect the clear filtrate. 2 mM LiFSI/DME was used as a reference. A negative electrospray ionization (ESI) mode was used to analyze the filtrate, and acetonitrile was used as the mobile phase. The mass spectra in Figure 5 show a large m/z peak at 179.91 in all 3 samples, which belongs to FSI−anion. Two additional m/z peaks at 191.94 and 235.97 were observed in the cycled 1 M LiFSI/DME electrolyte, while only tiny peaks at 191.94 and 235.97 were shown in the cycled 1 M LiFSI/DME-TFF. The zoomed in spectrum in Figure S9a–c show the isotope peaks for 191.94 are 192.94 and 193.94, and the isotope peaks for 235.97 are 236.97 and 237.95. The two peaks belong to (FSO2NSO3CH3)− and (FSO2NSO3CH2CH2OCH3)−, whose isotope peaks are shown in Figure S9e, f and consistent with the spectra in Figure S9b, c. The mechanism for their formation was proposed in Figure 5b. First, FSI− gains two electrons and two Li+ to form LiF and Li(FSO2NSO2Li). LiF is entirely precipitated as a SEI component, while only part of the Li(FSO2NSO2Li) precipitated and form SEI. The dissolved Li(FSO2NSO2Li) react with DME solvent and forms more soluble Li(FSO2NSO3CH3) and Li(FSO2NSO3CH2CH2OCH3). Since 1 M LiFSI/DME has a much stronger Li+ solvating capability than the 1 M LiFSI/DME-TFF, the dissolved Li(FSO2NSO2Li) is much more in 1 M LiFSI/DME than that of 1 M LiFSI/DME-TFF, leading to the significantly larger amount of Li(FSO2NSO3CH3) and Li(FSO2NSO3CH2CH2OCH3) in the cycled 1 M LiFSI/DME and the higher F/S ratio in the SEI in Figure 4c. The reduction processes for the undissolved Li(FSO2NSO2Li) are complicated, which involves the formation of LiF, Li2SOx, Li2S and Li3N, the detail reduction mechanism needs a more careful study.
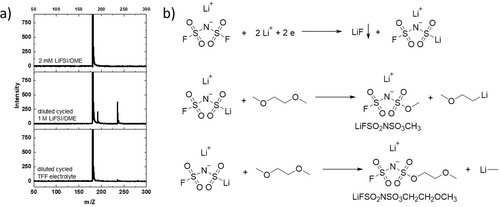
Mass spectra of different samples: 2 mM LiFSI/DME, cycled 1 M LiFSI/DME electrolyte dilute with DME solvent, and cycled 1 M LiFSI/DME-TFF electrolyte dilute with DME solvent; b) proposed mechanism for the formation of LiFSO2NSO3CH3 and LiFSO2NSO3CH2CH2OCH3.
Given the superior performance of 1 M LiFSI/DME-TFF for Li metal anode, we further evaluate its full cell performance with a high-voltage Ni-rich NMC811 cathode. A 20 μm Li||NMC811 coin cell with a negative/positive (N/P) capacity ratio of 1.2 was assembled and tested at a charge current of C/5 and discharge current of C/3 between 2.8 and 4.3 V. The electrolyte/capacity ratio was kept at 6.5 μL mAh−1. The cell was first activated at C/10 for three cycles to fully utilize the capacity. The commercial carbonate electrolyte 1 M LiPF6 EC/DEC (v : v=1 : 1) was used as the standard electrolyte (SE) and operated under the same protocol. As shown in Figure 6a, both cells exhibited a similar high discharge capacity of 210 mAh g−1 for the first three cycles at C/10, the specific capacity become 200 mAh g−1 when charged at C/5 and discharged at C/3. Their voltage profiles are shown in Figure 6b and Figure S10, the plateau at 4.2 V indicates excellent kinetics. The ICE is 92.5 % for the 1 M LiFSI/DME-TFF, which is slightly higher than the ICE (91.4 %) in the SE, indicating the outstanding oxidation ability of 1 M LiFSI/DME-TFF. After 225 cycles, the capacity retention for 1 M LiFSI/DME-TFF is 80 %, which is 7 times higher than that for the SE (≈28 cycles for 80 % capacity retention). Even after 300 cycles, the capacity retention for 1 M LiFSI/DME-TFF is around 75 %, which is one of the highest capacity retentions with a high area capacity of NMC811 (>3 mAh cm−2) and a low N/P ratio (<1.5).5 The average CE of Li||NMC 811 for TFF electrolyte is 99.93 % for the first 200 cycles after the activation process. At 1 C rate (3 mA cm−2), Li||NMC 811 cell with 1 M LiFSI/DME-TFF showed an inferior performance (Figure S11) due to its low ionic conductivity. Improving the ionic conductivity is demanded for the real application of LHCE.

Electrochemical performances of different electrolytes. a) Li||NMC811 cells consist of a thin Li foil (20 μm, 4.2 mAh cm−2) and a NMC811 cathode (3.45 mAh cm−2) with 1 M LiFSI/DME-TFF and commercial carbonate electrolyte 1 M LiPF6/EC/DEC (v : v=50 : 50). The cells were cycled between 2.8 and 4.3 V at a C/10 for 3 cycles, where 1 C=3.45 mA cm−2. Then charged at C/5 rate with a potential hold at 4.3 V until the charge current drop to C/20 rate and discharged at C/3 rate to 2.8 V. b) The corresponding charge/discharge profiles of Li||NMC 811 with 1 M LiFSI/DME-TFF electrolyte. c) Long-term cycling performance of anode-free Cu||NMC 811 cells with 1 M LiFSI/DME-TFF and 1 M LiFSI/FDMB at room temperature. The cells were first activated at C/10 between 2.8 and 4.3 V, 1 C=3.45 mA cm−2. Then charged at C/5 rate with a potential hold at 4.3 V until the charge current drop to C/20 rate, then discharged at C/3 rate to 2.8 V. d) The corresponding charge/discharge profiles of Cu||NMC 811 with 1 M LiFSI/DME-TFF electrolyte.
Furthermore, anode-free Cu||NMC 811 cells were used to assess the cell performance of 1 M LiFSI/DME-TFF electrolyte, and state-of-the-art electrolyte 1 M LiFSI/FDMB was utilized as a reference. The same NMC 811 cathodes (3.4 mAh cm−2) and the same electrolyte/capacity ratio (6.5 μL mAh−1) were used. The cell was activated at C/10 for 1 cycle, then charged at C/5 and discharged at C/3 between 2.8 and 4.3 V. The initial discharge capacity was 212 mAh g−1 with an ICE around 94 %. As shown in Figure 6c, after 100 cycles, the capacity retention for cell 1 and cell 2 are 63.8 % and 61.3 %, respectively. The two cells with 1 M LiFSI/FDMB electrolyte show a lower initial capacity of 203 and 199 mAh g−1 due to their lower ionic conductivity. The first CEs of two NMC811||Cu cells in 1 M LiFSI/FDMB electrolytes are only 88.2 % and 87.8 %, which are much smaller than that of 1 M LiFSI/DME-TFF. The two cells with 1 M LiFSI/FDMB electrolytes could stable cycle for 16 cycles, which is longer than that with 1 M LiFSI/DME-TFF electrolytes. This is because the realized capacity is lower with 1 M LiFSI/FDMB electrolyte, making the excess Li/capacity ratio become larger, thus it stays stable in cell capacity for a slightly longer time. However, as the cycle continues, the capacity fade rate (slope) becomes faster than that with 1 M LiFSI/DME-TFF. Between the 20th and 60th cycle, the capacity fade rate with 1 M LiFSI/FDMB electrolyte is slightly higher than that with 1 M LiFSI/DME-TFF due to its slightly lower Li anode reversibility. After 60 cycles, the capacity fade rate increased dramatically in 1 M LiFSI/FDMB electrolyte because of the increased polarization as shown in Figure S12a, b, while for 1 M LiFSI/DME-TFF electrolytes, no noticeable overpotential increased for the discharge curve in Figure 6d. It should be noted that the upshift of charge curves in Figure 6b, d was mainly due to the continued consumption of Li on the anode side, resulting in an increase of state of charge (SOC) at the fully discharged state and a large voltage increase for the charge curve. In contrast, the SOC at the fully charged state is always close to 100 %, leading to a very small variation for the discharge curve. The average CEs for 1 M LiFSI/DME-TFF electrolytes cells are 99.33 % and 99.34 % after the first 2 cycles, which are much higher than that of 1 M LiFSI/FDMB (99.00 % and 98.92 %). Overall, 1 M LiFSI/DME-TFF electrolyte exhibited an outstanding performance for both Li anode and NMC cathode.
Conclusion
In conclusion, an FSI− inspired molecule MFSI and a cyclic fluorinated ether TFF were designed as a cosolvent in LiFSI/DME electrolytes for LMBs. MFSI and TFF have a similar Li+ solvation effect but exhibited a very different reduction potential (MFSI≫TFF). The 1 M LiFSI/DME-TFF shows a much more stable performance than 2.2 M LiFSI/DME-MFSI because the low reduction potential of TFF promotes the formation of inorganic-rich SEI on Li. The Li||Cu half-cell and anode-free Cu||NMC 811 full cell using 1 M LiFSI/DME-TFF electrolyte showed a more stable performance than that using the state-of-the-art electrolyte of 1 M LiFSI/FDMB. More importantly, we discovered that the FSI− anion's early stage decomposition product Li(FSO2NSO2Li) is highly reactive, which would react with ether solvents at room temperature to form more soluble LiFSO2NSO3R, destroying the formed SEI and compromise the cell performance. These key findings offer deep insights into SEI formation and inspire groundbreaking improvements for LMBs through the rational design of electrolyte solvents and cosolvents.
Acknowledgments
This work was supported by the Assistant Secretary for Energy Efficiency and Renewable Energy, Office of Vehicle Technologies of the US Department of Energy through the Advanced Battery Materials Research (BMR) Program (Battery500 Consortium phase 2) under DOE contract No. DE-AC05-76RL01830 from the Pacific Northwest National Laboratory (PNNL).
Conflict of interest
The authors declare no conflict of interest.
Open Research
Data Availability Statement
The data that support the findings of this study are available on request from the corresponding author. The data are not publicly available due to privacy or ethical restrictions.


