Mapping of N−C Bond Formation from a Series of Crystalline Peri-Substituted Naphthalenes by Charge Density and Solid-State NMR Methodologies
Graphical Abstract
Abstract
A combination of charge density studies and solid state nuclear magnetic resonance (NMR) 1JNC coupling measurements supported by periodic density functional theory (DFT) calculations is used to characterise the transition from an n–π* interaction to bond formation between a nucleophilic nitrogen atom and an electrophilic sp2 carbon atom in a series of crystalline peri-substituted naphthalenes. As the N⋅⋅⋅C distance reduces there is a sharp decrease in the Laplacian derived from increasing charge density between the two groups at ca. N⋅⋅⋅C = 1.8 Å, with the periodic DFT calculations predicting, and heteronuclear spin-echo NMR measurements confirming, the 1JNC couplings of ≈3–6 Hz for long C−N bonds (1.60–1.65 Å), and 1JNC couplings of <1 Hz for N⋅⋅⋅C >2.1 Å.
Introduction
The concept of structure in chemistry implies the existence of bonds that can persist over a range of inter-nuclear distances until a point is reached where the bond is considered broken.1 The formation of bonds is central to our understanding of all chemical processes. In this study, we measure the degree of covalent bond formation in a series of crystalline organic compounds using two complementary solid-state methods, X-ray crystallography and NMR which are both supported by density functional theory (DFT) calculations.
Interactions between electrophilic and nucleophilic functional groups separated by a range of interatomic distances, measured by single-crystal X-ray diffraction, can be considered to represent discrete stages in the reaction between such groups.2 The concept was first developed using transannular amine-carbonyl interactions (with interatomic distances ranging from 1.64 to 2.58 Å) in a series of pyrrolizidine alkaloids, such as senkirkine and clivorine (ESI Scheme S1, structures S1 and S2).3 It was extended to through-space interactions in peri-disubstituted naphthalenes between dimethylamino or methoxy groups and a ketone, ester or carboxamide electrophile, where small pyramidalizations of the carbonyl carbons were observed.4 These peri-naphthalene systems can alternatively contain methylthio or naphtholate moieties as electron-rich groups, and alkynes, polarized alkenes or aldehydes as the electron-deficient centre.5, 6 For peri-naphthalenes bearing a dimethylamino (-NMe2) group adjacent to an electrophilic group containing a multiple bond (such as C=O, C=C, or C≡N), the naphthalene skeleton can hold the groups close to the optimal orientation for orbital overlap, often referred to as the Bürgi–Dunitz angle, inducing an n–π* interaction which can modify the chemistry of the groups.4 If the electrophile is sufficiently reactive an intramolecular bond is formed.7 The inter-group separation can be controlled by adjusting the substituents at the opposing peri positions.8 n–π* Interactions are particularly important in chemistry, e.g., O⋅⋅⋅C=O interactions between the carbonyl groups is critical in determining conformations of proteins (such as collagen), and the role of n–π* interactions in enzymatic processes is only just being recognised.9 X-ray crystallography of model compounds based on peri-naphthalenes and acenaphthenes have been used to probe the mechanism of nucleophilic attack on silicon and unconventional hydrogen bonding to an amide nitrogen atom.10
To study the progression from n–π* interaction to initial bond formation we designed a series of six peri-naphthalenes with a -NMe2 group situated next either to an aldehyde or various alkenes functionalized with two terminal electron-attracting groups, outlined in Figure 1, 1–6. X-ray crystallography shows the Me2N⋅⋅⋅C distances decrease as the electrophilic strength of the alkene series increases, with the longest for two benzoyl groups terminating the alkene (1; 2.695 Å), then for two nitriles (3; 2.413 Å), and finally three with a cyclic link between the terminal groups: a diester (4; 1.651 Å), a diamide (5; 1.624 Å) and a diketone (6; 1.612 and 1.626 Å).7, 11 The aldehyde has the second-longest inter-atomic distance in the series (2; 2.481 Å).12 Notably, for 4–6 the separations correspond to the formation of a particularly long N−C bond (1.612–1.651 Å) which completes a doubly-fused five-membered ring in a zwitterionic structure (cf. a Me3N+-CHRCO2− bond: 1.536 Å, and a typical N−C bond between neutral atoms: 1.47 Å).13 We have probed the development of N⋅⋅⋅C peri-bonding in this series of crystals using two complementary solid-state methods:
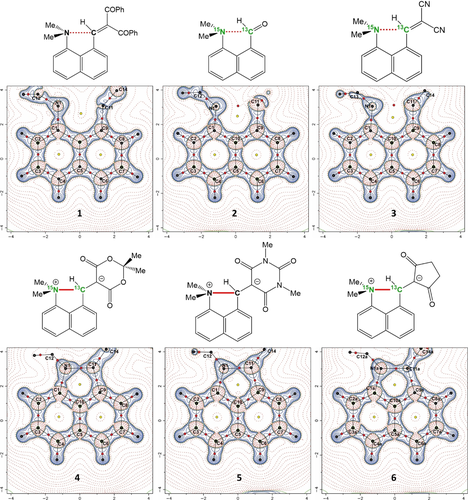
The structures of the peri-substituted naphthalenes 1–6 with their Laplacian maps from the charge density determinations. The static deformation charge density distribution maps are given in the ESI. The selectively labelled 15N and 13C sites, used for NMR studies of 2, 3, 4 and 6, are highlighted in green.
(1) by determination and topological analysis of the charge densities for the six molecules in this series using accurate, high-resolution single crystal X-ray diffraction measurements, which are supported by DFT calculations.
(2) using NMR to directly measure the 1JNC coupling between the two nuclei involved in the interaction in the solid state for isotopically enriched molecules 2, 3, 4 and 6.
For the NMR study, the molecules were prepared with 15N (60 %) and 13C (99 %) isotopic labels at the peri positions (ESI). The crystallographically determined structures are related to the experimentally determined 1JNC couplings using periodic DFT calculations to derive the theoretical coupling constants, thus providing a joint solid-state charge density/NMR approach. The most closely-related charge density studies on peri-systems relate to proton sponges and a long (2.700 Å) Me2N⋅⋅⋅CONMe2 interaction, whilst investigations into Cl⋅⋅⋅Cl interactions and extended hypervalent bonding in S⋅⋅⋅S−S⋅⋅⋅S and S⋅⋅⋅Se−Se⋅⋅⋅S situations have also been completed.14, 15 Solid-state 1J coupling studies between peri chalcogenide elements have also been made.16 However, no combined charge density/1J coupling studies on crystalline peri-naphthalenes have been reported.
Results and Discussion
Charge density determinations were made from X-ray diffraction data on high-quality crystals of 1–6 at 100 K, with data for 6 collected using a synchrotron source (Diamond Light Source) on account of small crystal size. Parameters derived from the topological analysis of the charge densities using QTAIM are given in Table 1.17 Laplacian maps through the molecular plane are shown in Figure 1 with further details, e.g., molecular graphs showing bond paths, and bond and ring critical points, given in the ESI. All structures have a bond (3, −1) critical point between the interacting peri N and C atoms, that is a point where the electron density gradient is zero and is a maximum in two and a minimum in one of three orthogonal directions. As the Me2N⋅⋅⋅C distance decreases from 2.6758(4) to 1.6070(6) Å, the charge density at this critical point increases dramatically from 0.13 e Å−3 in 1, to 1.29 and 1.35 e Å−3 in the two distinct crystallographic environments for the cyclic dione 6, which is ca. 80 % of the charge density for a typical N+−C bond, as observed in the N+−Me bonds in 6 (1.55–1.62 e Å−3) or seen in tetramethylammonium cations (1.54–1.65 e Å−3).18
|
|
Charge Density
|
Experimental MAS NMR |
Density Functional Theory (Periodic DFT) |
||||||
|---|---|---|---|---|---|---|---|---|---|---|
|
Me2N⋅⋅⋅C [Å] |
Bond path [Å] |
ρ(r) [e Å−3] |
∇2ρ(r) [e Å−5] |
δiso(15N) [ppm] |
δiso(13C) [ppm] |
Rij(N⋅⋅⋅C) [Å] |
1JNC [Hz] |
δiso(15N) [ppm] |
δiso(13C) [ppm] |
1 |
2.6758(4) |
2.695 |
0.13 |
1.69 |
– |
– |
2.676 |
0.85 |
−328 |
157 |
2 |
2.4796(7) |
2.481 |
0.19 |
1.97 |
−341 |
188 |
2.480 |
0.48 |
−335 |
191 |
3 |
2.4163(2) |
2.418 |
0.21 |
2.20 |
−337 |
167 |
2.416 |
0.45 |
−318 |
166 |
S1[20] |
2.292(4) |
2.245 |
0.33 |
2.26 |
– |
– |
2.292 |
0.61 |
−314 |
183 |
S2[21] |
1.993(3) |
1.993 |
0.56 |
2.13 |
– |
– |
1.993 |
2.32 |
−296 |
177 |
4 |
1.6467(5) |
1.647 |
1.19 |
−2.92 |
−295 |
94 |
1.647 |
5.88 |
−285 |
93 |
5 |
1.6237(9) |
1.624 |
1.26 |
−3.46 |
– |
– |
1.624 |
4.01 |
−282 |
89 |
6 |
1.6252(7) 1.6070(6) |
1.625 1.607 |
1.29 1.35 |
−4.30 −6.73 |
−292 −292 |
88 83 |
1.625 1.607 |
4.73 3.57 |
−290 −287 |
86 82 |
S3 200 K |
– |
– |
– |
– |
– |
– |
2.167 |
1.94 |
– |
– |
100 K[8] |
– |
– |
– |
– |
– |
– |
1.750 |
7.04 |
– |
– |
The Laplacian  , the second derivative of the charge density with respect to distance, highlights areas of charge concentration and depletion, and thus reveals the fine details of the electronic distribution. The Laplacian maps show an increasing spread of charge concentration between the interacting N and C atoms as their separation distance decreases (Figure 1). For 1–3, the charge concentration on the N atom is representative of the lone pair, but for 4–6, there is contact between the charge concentrations on the N and C atoms. The Laplacian values at the bond critical point (BCP) for 1–3 are small and positive, indicating closed-shell interactions, and increase slightly from 1 to 3 (1.69 to 2.20 e Å−5), but decrease strongly from 4 to 6 (−2.92 to −6.73 e Å−5), indicating the shared nature of these interactions. However, they do not reach the Laplacian values for typical N+−C bonds, as seen in the N+−Me moieties in 6 (−8.49 to −9.60 e Å−5). Together with charge density data, this suggests that even in 6 the N−C bond in the five-membered ring between peri groups is not fully formed. We note that although in the structural formulae for 4–6 the peri N atom is assigned a charge of +1, the Hirshfeld and QTAIM charges derived from the CD study are much smaller (Hirshfeld: 0.00 to +0.12; QTAIM: −0.18 to −0.98), and the Hirshfeld charges contrast with those for 1–3, which are negative (−0.04 to −0.11), due to the more localized electron lone pair.
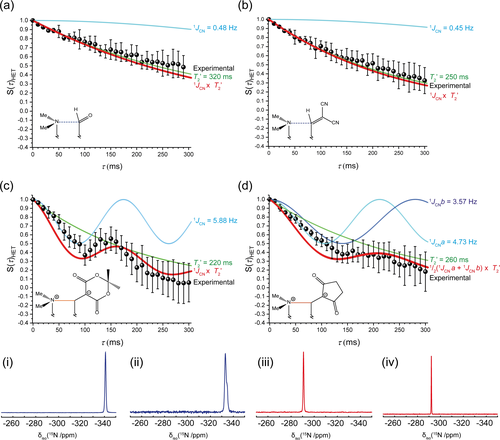
The 15N-13C heteronuclear spin-echo intensities (black circles) of the 15N resonance with an increasing tau (τ) delay for the naphthalenes a) 2, b) 3, c) 4 and d) 6 at 11.75 T (ν0 1H=500.1, 13C=125.76 and 15N=50.69 MHz) and a MAS frequency of (νR) 11 kHz. On each graph the GIPAW-DFT determined Simpson simulated 1JNC couplings (cyan), T2 determined from spin-echo experiments (green), and their product (red) are given. The decays follow a cos(πJNCτ)exp(−τ/T2) function. (i, ii, iii and iv) The respective 15N MAS NMR spectra of structures 2, 3, 4, and 6, those without a bond give a low-frequency resonance (blue) and after a bond has formed a ≈50 ppm shift to high frequency (red) is observed.
The alkene bond under attack from the dimethylamino group extends its length by ca. 0.12 Å from 1.3509(3) and 1.3659(2) Å in 1 and 3 to 1.4687(6) and 1.4737(6) Å in the two crystallographically independent molecules of 6, with a decrease in the charge density at the BCP, from 2.28 and 2.25 e Å−3 in 1 and 3 to 1.84 and 1.85 e Å−3 in 6. Furthermore, there is a change in the Laplacian from −19.87 and −20.10 e Å−5 in 1 and 3 to −14.76 and −14.77 e Å−5 in 6. Given that the typical charge density and Laplacian values for a single C−C bond are ca. 1.6 e Å−3 and −10 to −12 e Å−5, this suggests that the double bond in 6 has not been fully transformed into a single (σ) bond.22 There is also a change in the ellipticity of this bond, derived from the CD determination (Section 2, ESI), from 0.29–0.32 for 1 and 3, to 0.13–0.17 for 4–6 which could be interpreted as a reduction in the π component of the bonding, though this approach has been questioned since there is no direct connection between the topological analysis and an orbital based description of bonding.23
To provide data for intermediate N⋅⋅⋅C separations, the charge densities for the alkaloids senkirkine and clivorine, S1 and S2, were determined using B3LYP functionals, a 6–311++G** basis set, and atomic coordinates from their reported crystal structures.20, 21 At the BCPs for their transannular N⋅⋅⋅C interactions there are small charge concentrations (0.33 and 0.56 e Å−3) increasing with decreasing N⋅⋅⋅C separation, and their Laplacian values (2.26 and 2.13 e Å−5) are similar to those of the dinitrile 3. Further calculations were completed for 1–6 and reproduced the experimental charge densities at the N⋅⋅⋅C BCP to within 0.2 e Å−3 for 1–5, while for 6 the values were within 0.7 e Å−3, though the diffraction dataset for 6 is slightly less extensive and complete than for 1–5. The trend of the Laplacians was also reproduced, though with greater divergence (more negative) for 4–6 (ESI, Figure S27). The variation of Laplacian with the N⋅⋅⋅C separation for 1–6 and S1 and S2 (Figure 3), shows a trend which can be fitted with a Morse-like function, which shows a small rise in Laplacian as the N⋅⋅⋅C distance contracts to ca. 2.1 Å and then a rapid decrease in value, passing through zero at ca. 1.8 Å. Thus, the Laplacian is a sensitive discriminator for the bonding, with the small positive values corresponding to closed-shell interactions, which decrease strongly for 4–6 suggesting covalent interactions. A similar Morse-like relationship of the Laplacian against interatomic separation was shown by Minor and Woźniak et al. for OH⋅⋅⋅O and NH⋅⋅⋅N hydrogen bond formation.24 A plot of the calculated energy density (H) at the N−C bond critical point against increasing N⋅⋅⋅C separation tended, from negative, to zero at ca. N⋅⋅⋅C: 2.45 Å, suggesting this is the limit for covalent interaction (ESI). Furthermore, the Delocalisation Index (DI) was calculated for the peri N⋅⋅⋅C interaction/bond in each molecule as a measure of bond order.25 For 4–6, this was in the range of 0.71–0.72, being lower for 2 (0.14) and 3 (0.19), and very low for 1 (0.08). For 4, the other three N−C bonds had DI's of 0.84–0.85 consistent with the peri-bond not being fully formed (ESI, Table S16, Figure S29).
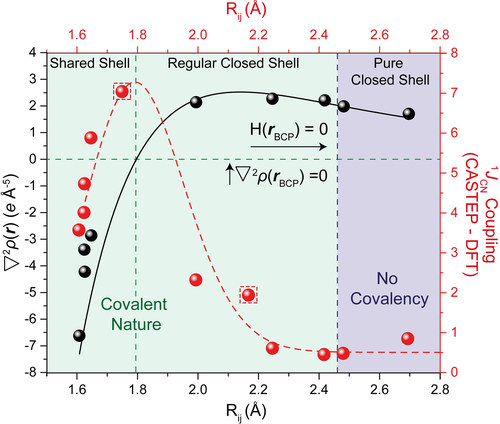
The relationships between the Laplacian of the charge density (∇2ρ(r)) and the 1JNC coupling against the distance between the interacting N⋅⋅⋅C atoms (Rij). The ∇2ρ(r)−Rij relationship is fitted to a Morse-like dependence, as given by Mallinson and Woźniak,14 ∇2p(r)=De [1−exp{−a }], where De=2.417 and R1=2.13867. Accordingly, the DFT-derived 1JNC couplings–Rij relationship is tentatively imposed over a constrained inverse Morse potential, 1JNC=−De[1−exp{−a
 }]2, where Re was fixed to ≈1.8 Å and De is derived from a Harmonic oscillator function to be 7.4 Hz. The function was offset to (1JNC) 0.5 Hz, the lowest periodic DFT determined 1JNC coupling at longer bond lengths. The two calculated 1JNC for S3 at 100 and 200 K are given in red dashed squares.
The charge density, determined from X-ray diffraction measurements, maps the valence electron distributions between the interacting groups. The corresponding crystal structures for S1–S2 and 1–6 have been used to calculate, via DFT, the 1JNC couplings between 15N and 13C atoms located at either end of the peri interaction/partial bond to characterise the interaction across the Me2N⋅⋅⋅C bridge. This use of DFT to predict the NMR parameters is compared to experimental measurements made on naphthalenes 2, 3, 4 and 6 in which the two interacting/bonding atoms are both isotopically labelled (Scheme S1, ESI).
The 13C and 15N cross-polarization MAS (CPMAS) spectra of the 15N⋅⋅⋅13C enriched aldehyde and alkenedinitrile, 2 and 3, show single resonances from the labelled sites, with δiso(13C): 188 and 167 ppm (Figure S32, ESI) and δiso(15N): −341 and −337 ppm (Figure 2, i and ii) respectively. For 4 and 6, the shorter N⋅⋅⋅C distances reduce the 13C shifts to lower values, δiso: 94 ppm (4) and δiso: 88 and 83 ppm (for crystallographically independent molecules of 6) consistent with the formation of N−C bonding and an sp3 carbon centre. For 15N, which has a negative gyromagnetic ratio, the shifts increase accordingly to δiso −295 and −292 ppm for 4 and 6, respectively, with no differentiation between the two independent molecules of 6, consistent with the formation of a more deshielded nitrogen nuclei (Figure 2, iii and iv). The chemical shift is a large NMR interaction (kHz) and is highly sensitive to changes in bonding and the local environment, however, it only indirectly suggests an N−C bond has formed.
The presence of a measurable 1JNC coupling at the 15N nucleus would indicate there is an electron-mediated through- bond two nuclear spin interaction across the Me2N⋅⋅⋅C bridge, which has traditionally been used to characterize and quantify bonding environments.26, 27 Solid-state NMR experiments seldom succeed in achieving the spectral resolution observed in the solution state because of the existence of high order cross terms which cannot be reduced by MAS, residual dipolar couplings, and the distribution of isotropic shifts due to non-perfect ordering or π-stacking faults.28 A mechanism for measuring the 1J coupling in the solid-state is to utilise the spin-echo sequence which refocuses the evolution of all the terms that appear as offsets, in particular those that are caused by a distribution of chemical shifts. The use of spin echoes in an NMR experiment allows the detection of chemical shift separated J couplings even when inhomogeneous broadening means it is not directly visible in the observed spectrum.29 The presence of other highly coupled nuclei with large quadrupolar couplings (such as 14N or 17O) can also cause dephasing of the signal and prevent accurate measurements of the J-coupling, therefore the measurement was observed from the perspective of the 15N nuclei which is solely coupled to 99 % 13C (I= ), whereas the more sensitive 13C is coupled to 60 % 15N (I=
 ) and 40 % quadrupolar 14N (I=1), which would cause greater dephasing and overestimation of the 1J coupling. We have previously discussed a methodology of utilizing periodic DFT calculations on molecular structures determined by single-crystal X-ray crystallography to determine 1J couplings which are validated with spin-echo solid-state NMR experiments. Here, we expand this methodology to compare the charge density maps with NMR observations.29
The heteronuclear 15N-13C spin-echo decay for the aldehyde 2 and dinitrile 3 (Figure 2 a and b) both show very shallow exponential decays which are indicative of narrow resonances that are not broadened by 1JNC coupling contributions. A green simulated fit is given for the T2 decays, with the blue SIMPSON30 simulation of the periodic DFT determined 1JNC coupling, and their product is given in red. The observed decay can be reliably fitted to both the T2 component (determined from a homonuclear spin-echo) and T2 with the minor 0.48 or 0.45 Hz 1JNC coupling. The origin of these small 1JNC couplings is attributed to the weak bonding interaction between the two nuclei.
The zwitterions 4 and 6 both show a more dramatic exponential decay, which cannot solely be attributed to the measured T2 relaxation. The GIPAW-DFT 1JNC calculations predict more substantial couplings of 5.88 Hz for 4 and an average of 4.15 Hz for 6. When the cosine of these couplings is multiplied by the exponent of the T2 decay, the red projections (Figure 2 c and d) are observed, which are in good agreement with the spin-echo data. The dione 6 has two crystallographically distinct molecules, with Me2N⋅⋅⋅C distances of 1.607 and 1.625 Å, resulting in 1JNC couplings of 3.57 and 4.73 Hz, respectively. It is presumed both sites will give an equal contribution to the spin echo, thus a 1JNC coupling of 4.15 Hz was utilised in the simulation. Unfortunately, the summation of the two offset 1JNC components dampens the cosine feature of the decay, giving a less accurate fit. Concurrent periodic-DFT calculations were performed on two structures arising from variable temperature studies on a substituted derivative of 3 (S3, ESI), which have been very recently reported, to provide 1JNC couplings in the Me2N⋅⋅⋅C: 1.7–2.4 Å region.8 In this unique case the Me2N⋅⋅⋅C separation at 200 K is 2.167(4) Å, but contracts, in a reversible process, to 1.749(3) Å at 100 K giving calculated 1JNC values of 1.94 and 7.04 Hz, respectively.
In Figure 3, the N−C distance (Rij) is plotted against both the second derivative of the charge density and the periodic DFT-derived, NMR confirmed, 1JNC coupling constants (Hz) for 1–6 and S1–S3. A negative second derivative of the electron density is representative of a shared shell covalent bond which is observed below 1.8 Å. Between 1.8 and 2.45 Å a positive second derivative of the electron density is observed, which is still covalent in nature but is defined as regular closed-shell, and at longer bonds lengths (>2.45 Å) no covalency is observed and a pure closed-shell bond arrangement dominates. The corresponding 1JNC coupling results can be tentatively fitted to an inverse Morse function (Figure 3, red dashed line), in contrast to the Morse-like dependence outlined by charge density. It is interesting to note that though the 1JNC values are larger for 4–6 with high delocalization indices for the peri N−C bond, and very small for 1–3, there is a maximum in the value of 1JNC (ca. 7.4 Hz) which occurs at an N⋅⋅⋅C separation of ca. 1.79 Å. Indeed, the maximum coincides with the point where the Laplacian of the charge density in the bond begins to strongly decrease as the N⋅⋅⋅C distance closes. Above an N⋅⋅⋅C separation of 2.45 Å, corresponding to a calculated energy density of zero at the bond critical point, the coupling remains constant at a minimum value of 0.5 Hz, consistent with no significant covalency between the two atoms.
Conclusion
We have presented an advanced NMR crystallography methodology that allows DFT-driven observables and experimental charge density measurements to be utilised to determine the conditions required for bond formation in a series of model compounds containing a Me2N⋅⋅⋅C(sp2) interaction or partially formed bond. For this model system, as confirmed by DFT corroborated charge density and NMR observations, the variation of Laplacians and 1JNC coupling constants suggest that at an N⋅⋅⋅C separation of ca. 1.8 Å, the system starts to form a covalent shared shell bond, with an increasing degree of formation as the atomic separation reduces further. This approach opens up the possibility of identifying the transition state for bond formation, of importance, for example, for understanding enzyme catalyzed conjugate additions.31
For additional bond formation studies, a more computational approach could be taken. Models for different reaction stages could be obtained using calculations on various substituted peri-naphthalene compounds, with the N⋅⋅⋅C interaction distance constrained to desirable distances in the 1.5–2.5 Å range but allowing full relaxation of the rest of the structure. From each such structure QTAIM parameters and 1J-couplings could be derived. Modelling of crystal structures may also assist, for example, the tolerance of a N⋅⋅⋅C interaction within the 1.7–2.3 A range, for example, in S3, may be partly due to other attractive interactions such as the hydrogen bonding in the crystal packing.8 Furthermore, computational methodologies, such as random structure searching, can identify new synthetic targets with desired N⋅⋅⋅C distances.32 To summarise, we have illustrated here that charge density, NMR and DFT methods can be used together to characterize bond formation, a process which is at the heart of chemistry.
Acknowledgements
We thank the EPSRC for a grant from their Physical Sciences Initiative (EP/E018203/1) (JW/MES), for support of the EPSRC UK National Mass Spectrometry Facility at Swansea University, and for support for the EPSRC National Crystallography Service (SJC). J.V.H. acknowledges the funding of the solid state NMR instrumentation in Millburn House from the EPSRC, the University of Warwick and the Birmingham Science City Advanced Materials Projects 1 and 2 and support by Advantage West Midlands and the European Regional Development Fund. J.V.H. also acknowledges the University of Warwick Scientific Computing Research Technology Platform (RTP), and EPSRC grant EP/K000128/1, for access to the TINUS and MINERVA high-performance computing clusters. We thank Prof. C. S. Frampton and Dr. L. H. Straver (Bruker Ltd) for collecting an X-ray dataset, and we thank Dr. Claire Wilson for support in the collection and processing of X-ray diffraction data at the Diamond Light Source.
Conflict of interest
The authors declare no conflict of interest.


