Autocatalytic Nucleation and Self-Assembly of Inorganic Nanoparticles into Complex Biosimilar Networks
Abstract
Self-replication of bioorganic molecules and oil microdroplets have been explored as models in prebiotic chemistry. An analogous process for inorganic nanomaterials would involve the autocatalytic nucleation of metal, semiconductor, or ceramic nanoparticles-an area that remains largely uncharted. Demonstrating such systems would be both fundamentally intriguing and practically relevant, especially if the resulting particles self-assemble into complex structures beyond the capabilities of molecules or droplets. Here, we show that autocatalytic nucleation occurs with silver nanoparticles, which subsequently self-assemble into chains through spatially restricted attachment. In dispersions containing “hedgehog” particles, these reactions produce complex colloids with hierarchical spike organization. On solid surfaces, autocatalytic nucleation of nanoparticles yields conformal networks with hierarchical organization, including nanoparticle “colonies.” We analyzed the complexity of both types of solid-stabilized particle assemblies via graph theory (GT). The complexity index of idealized spiky colloids is comparable to that of complex algal skeletons. The GT analysis of the percolating nanoparticle networks revealed their similarities to the bacterial, but not fungal, biofilms. We conclude that coupling autocatalytic nucleation with self-assembly enables the generation of complex, biosimilar particles and films. This work establishes mathematical and structural parallels between biotic and abiotic matter, integrating self-organization, autocatalytic nucleation, and theoretical description of complex systems. Utilization of quantitative descriptors of connectivity patterns opens possibility to GT-based biomimetic engineering of conductive coatings and other complex nanostructures.
Introduction
When painstakingly designed, certain chemical systems can self-replicate, and are often studied to shed light on the origins of life.1-5 These chemical systems are typically based on nucleic acids,1, 6 peptides,5, 7, 8 or surfactants.9-11 Spontaneous multiplication of microscale droplets and vesicles,8-11 which captures some aspects of cell division, have also been observed. In this context, self-replication processes in nanoscale colloids would represent a notable departure from traditional biosimilar systems, which rely solely on peptides, nucleotides, and surfactants ‘borrowed’ from biology. Such nanoscale chemical systems would require fundamentally distinct reactions and coupling mechanisms, primarily leveraging inorganic rather than organic chemistry. Furthermore, such processes need not align with prebiotic chemistry frameworks and should instead be considered as pathways to complex biomimetic materials, rather than to living organisms. The ability of inorganic nanoscale colloids to self-assemble closely resembles that of biomolecules and offers a significant advantage over microscale droplets.12 Additionally, the unique optical, catalytic, and electrical properties of inorganic materials -absent in organic particles and molecules- provide practical motivation for such studies.
The chemistry-agnostic spontaneous multiplication of particles via chemical templating has been modeled computationally,13-16 though the experimental chemical pathways to such systems remain elusive and the published studies eventually resort to peptide chemistry.7 In fact, the direct analogy of microdroplet division for inorganic colloids is, in fact, energetically prohibited. Dividing a parent colloidal inorganic particle into two ‘daughter’ particles would demand much greater (>10x) activation energy than in organic systems–due to the strong interatomic bonds in inorganic crystals, which have significantly higher cohesion energy compared to the weak intermolecular interactions holding droplets together.
An approximate analog to molecular self-replication in case of inorganic materials would be the autocatalytic synthesis of metals, semiconductors, or ceramic nanoparticles (NPs). We hypothesized that autocatalytic reduction of metal ions near metal NPs absorbing light quanta to gain additional energy may allow newly formed particles to initiate the formation and growth of their own offspring. Furthermore, the strong van der Waals (vdW) attraction between ‘mother’ (NPm) and ‘daughter’ (NPd) nanoparticles, with Hamaker constants17 ~5x higher than those of organic substances (e.g., 25×10−20 J for gold vs. 5×10⁻²⁰ J for hydrocarbons), should further facilitate the self-assembly.18
This light-driven open system appears experimentally feasible but fundamentally complex. First, the growth of NPm must be drastically slowed at a specific size to allow NPd to grow and reach similar dimensions, before the Ag+ supply is depleted. The main challenge is that this requirement opposes the typical Ostwald ripening process seen in nanocolloids, where larger NPs grow while smaller NPs disappear.19
Second, 1–3 nm thick surfactant layers, which typically regulate NP growth rate and colloidal stability, also act as barriers, preventing electron ejection into the solvent and hindering NPd formation. These layers significantly reduce vdW attraction between NP inorganic cores. Additionally, surfactants pose further challenges, including strong light scattering,3, 9 weak attenuation of electron beams, and competitive adsorption of long-chain molecules to solid surfaces. These factors obstruct real-time observation of nanoscale dynamics and complicate the identification of underlying chemical mechanisms.
Third, the shape, size, and composition of NPs are influenced by the local flux of metal ions and electromagnetic fields, rather than by the NPm itself, as in surfactant-stabilized droplets. This inherent stochasticity leads to high polydispersity among NPs, complicating the identification of structural patterns. Additionally, irreversible agglomeration of NPs into disorganized precipitates impedes both autocatalytic nucleation and the emergence of complex structures.
Results and Discussion
Light-Driven Autocatalytic Nucleation
Building on prior knowledge of NP interactions20 and crystallization behavior12, 21 we investigated silver NPs with citrate ions as surface ligands for a possibility of autocatalytic nucleation (Figure 1A). Citrate surface ligands address the challenges highlighted above by being small and labile. They also provide a minimal redox barrier while still sufficiently preventing rapid NPm growth. Citric acid and citrate ions are known to be involved in Szent-Györgyi-Krebs metabolic cycle in bacteria as a substrate for enzyme aconitase catalysing stereo-specific isomerization of citrate to isocitrate via cis-aconitate in a non-redox-active process.22 Note that aconitase is a large protein with a molecular weight of 80,000 - 85,000 Da depending on the organism and specific isoform whose catalytic activity is dependent on the [Fe4S4] cluster.23 The chemical functionality of citrate molecules in the NP-based system is conceptually different from their known biological functions. Concomitantly, the NPs are chemically much simpler than aconitase or any other enzyme known to convert citrate into other biomolecules.
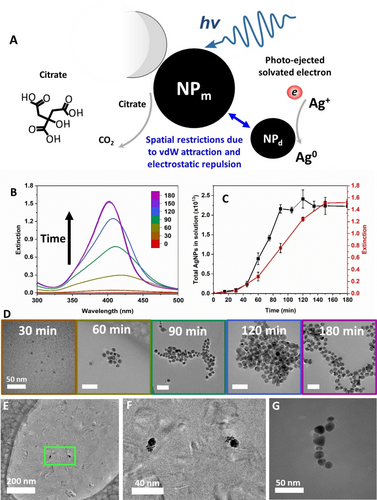
Optical, kinetic, and structural properties of NP assemblies produced during photoinduced autocatalytic nucleation. (A) Schematics of autocatalytic nucleation and growth of silver NPs via a sequence of photoinduced redox reactions initiated by photoejection of electrons that become solvated in water. The size of the solvated electron is 2.5–2.8 Å.26, 27 Drawn not to scale. (B) Extinction spectra of NP dispersion at 30 min intervals. (C) Extinction intensity at the max wavelength (red) compared to the total actual concentration of NPs measured with NTA (black). (D) TEM images of NPs at 30 min intervals of the process. Border colour matches time points for B. Scale bars are 50 nm. (E, F) Cryo-TEM images of a ‘mother’ NP with the growing ‘daughter’ NPs in the process of autocatalytic nucleation (60 min). (F) Expanded view of the section of the image in (E) highlighted by the green frame. (G) NP asembly observed on an LBL-functionalized TEM grid under self-replicating conditions (90 min).
Excitation of plasmonic states of metal NPs leads to electromagnetic hot spots, enabling electron photo-ejection into the surrounding medium.24, 25 The electrons in aqueous media become solvated forming electrostatic complexes with water molecules with a size of 2.5–2.8 Å and a lifetime exceeding 250 ps.26, 27 The solvated electrons reduce Ag+ to Ag0, which results in nucleation and growth of NPd near the NPm (Figure 1, and Supplementary Text 1). Simultaneously the remaining holes in parent NP oxidized the molecules of citrate (Figure 1A). The oxidation products of citrate may be multiple and may temporarily remain attached to the NP surface; the repeated electron transfer from these products to the NP will ultimately lead to formation of CO2.
In practice, a solution of 0.1 mM silver nitrate (AgNO3) and 3 mM sodium citrate dihydrate at pH 10.3 was illuminated with 365 nm ultraviolet (UV) light at an intensity of 1.3 mW/cm2 (Figure S2 and Supplementary Text 2). The optical extinction peak between 400 and 420 nm displayed nearly ideal S-shaped kinetics (Figure 1C, Figure S2), expected for self-replicating and autocatalytic systems.28-30 The initial lag seen in Figure 1C corresponds to the slow emergence of a few NPm, followed by explosive growth in the middle of the S-curve as the local Ag+ concentration remains high. The final S-curve plateau is reached as Ag+ depletes.31 This system is robust across a wide range of physical conditions, including illumination with photons and electrons of varying energies. The photoinduced reduction pathway Ag++e−→Ag0→NP allows for realization under 1D, 2D, and 3D diffusion conditions, enabling spatial modulation of autocatalytic nucleation.
Transmission electron microscopy (TEM), leveraging the high contrast of NPs in electron beams, was used to determine the structural and temporal patterns of NP product(s) (Figures 1,2). Under conditions that yielded the S-shaped accumulation kinetics, the irregularly shaped NPs grew gradually during the illumination (Figure S3). The peak wavelength shifted slightly from 417 nm (Figure S1A and Supplementary Text 3) to 402 nm due to increased charge density around the NPs (Figure S4).32 Cryo-TEM images indicated that clusters of 1.1–1.5 nm critical nuclei formed near the NPm surface, with an average diameter d ~8 nm (Figure 1D, 60 min), confirming the mechanism of photoinduced autocatalytic nucleation, depicted in Figure 1A. These clusters produced NPd (Figures 1 and 2, Figure S7B) via interparticle exchange of Ag0 and catalytic reduction of Ag+.
The high optical contrast of NPs in light beams also allowed us to investigate their dynamics and localization using nanoscale tracking analysis (NTA), enabling direct particle counting in the media. NTA data revealed S-shaped kinetics (Figure 1C), characterized by an initial incubation period, followed by a rapid increase in NP count, and concluding with a plateau as expected for the autocatalytic nucleation process with limited availability of the starting reactant, i.e. Ag+.
Self-Assembly of Photogenerated Nanoparticles
TEM images (Figure 1F, Figure S7, S8), zeta-potential distribution (Figure S5), NTA dark field microscopy videos, and snapshots (Figure S6, Movie S1) revealed that autocatalytic nucleation is accompanied by the self-assembly of NPs into particle chains (Supplementary Texts 4, 5) when a bigger NP formed earlier produces an offspring nucleating in the vicinity of its surface (Figure 2A). Subsequently the ‘daughter’ NPs do the same which substantiates the use of this terminology that follows the prior practice of using these terms in respect to bacteria.33, 34
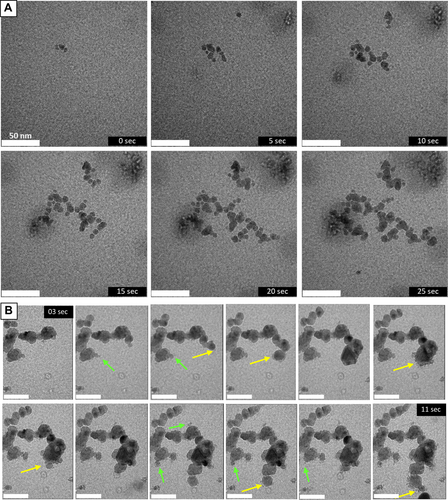
LPTEM imaging of self-replicating NPs forming networked chains. (A) A sequence of LPTEM images in 5 sec intervals of NP autocatalytic nucleation coupled with their assembly into chains. These time-lapse images demonstrate the bigger NPs generate (or ‘give birth’) to smaller NPs nucleating in its vicinity. Later the ‘daughter’ NP generates a ‘granddaughter’ NP in a similar fashion. Note that ‘mother’ and ‘daughter’ particles do not need to be the identical. Also, these terms do not imply any gender or sexual identities for higher organisms; they follow the previous use of these terms for bacteria.34 (B) A sequence of snapshots in Movie S3 between 3 and 11 sec for the growing segments of the NP chains obtained at 200 e−/Å⋅s electron beam illumination. The yellow arrows point to critical nuclei and early ‘daughter’ particles. Green arrows point to ‘daughter’ particles being consumed by ‘mother’ particles in agreement with the Gibbs−Thomson relation. Scale bars are 50 nm.
The average quasi-steady-state NP size depends on the illumination conditions and can range from d equal to 6.6 nm ±2.7 nm, 16.1 nm ±2.2 nm, and 18.2 nm±2.1 after 30, 60, and 180 min of 365 nm illumination, respectively (Figure S3). Illumination by a 130 e−/Å⋅s electron beam produces chains with an average d =13.6±3.5 nm. These NP chains form through spatially restricted attachment resulting from propagating linear anisotropy, leading to organized chains rather than disordered agglomerates. Starting from NP pairs, the energy barrier to assembly is higher at the chain's midpoint than at the apexes aligning the NPs into chains than can also be assisted by the dipolar interactions due to their asymmetry.12
Demonstrating the robustness of the process, conformal self-assembly of continuously generated NPs was also observed on surfaces, for example, on polyelectrolyte-functionalized35 TEM grids floating on the growth solution surface (Figure 1E, Figure S8, and Supplementary Text 6). The distances between NPs ranged from 0.5 to 0.9 nm (Figure S9), which is consistent with the ejection of hot electrons that reduce Ag+ ions in solution around the NPm,25, 36 as illustrated schematically in Figure 1A.
Nanoscale videography using liquid-phase TEM (LPTEM) demonstrated the rapid growth of intersecting NP chains following autocatalytic nucleation (Movie S2, Figure 2, Supplementary Text 7). Movie S3 also shows that NPs can nucleate outside the focus area, then diffuse and attach to a pre-formed chain from a different NPm. Chain length is reduced in NP systems when NPm growth is too slow (Figure S10, Movie S4, and Supplementary Text 8), resulting primarily in the generation of individual NPs.
Kinetics and Thermodynamics of the Autocatalytic Nucleation of Nanoparticles
To quantitatively describe the S-shaped kinetics (Figure 1C, Figure S2) of our NP system, we focused on experimentally accessible parameters. The standard Finke-Watzky model, commonly used to describe NP growth,37 fit poorly to our temporal trajectories (Figure S11C, S12, S14, Supplementary Text 9). Therefore, we modified the model to account for the chemical reactions described by Eq. S7–S9, incorporating two populations of exchangeable and non-exchangeable silver atoms on NP surfaces and cores. The validity of Eqs. S4–S6 and Eqs. S7–S9 for photoreduction of silver ions was confirmed by N. T. K. Thanh et al. and Völkle et al.37, 38 Additional validation is demonstrated by nearly perfect fit of experimental and theoretical curves in Figure 3A, B, C. Our modified kinetic model achieved high-confidence fits to the S-shape experimental curves under various illumination conditions (Figure 3A, B, C) and predicted S-shape curves for other chemical species, (i.e., Ag+ and Ag0, Figure S13).
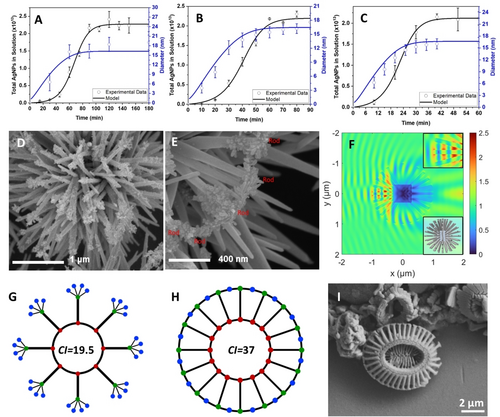
Chemical mechanistic aspects of photoinduced autocatalitic nucleation of NPs. (A, B, C) Kinetic model of light-driven autocatalytic nucleation of NPs for the total number of NPs (black lines) and their diameter (blue lines) vs. experimental NP concentration data (black hollow circles) and experimental NP diameter data (blue hollow circles) for light intensities of (A) 1.3 mW/cm2; (B) 8 mW/cm2; and (C) 17.2 mW/cm2. (D, E, F) Self-replicated NP assemblies produced on spiky microparticles with electric field singularities. (D) SEM image of NPs self-replicated ‘hedgehog’ particles (HPs) with ZnO spikes after 30 min of illumination. (E) SEM image of self-replicated NPs after prolonged 180 min forming bridges between the ZnO spikes. (F) Electromagnetic model of HPs under illumination with 365 nm light. The cores of the HPs are Fe2O3 cubes. The hotspots of the electromagnetic fields are concentrated at the apexes of the ZnO spikes (upper inset). The full computational model of the HP is given in the lower inset. (G, H) Graph models of the idealized HPs with self-assembled NP chains consistently forming four secondary spikes (G) and bridges interconnecting ZnO spikes across the outer circumference (H) representing the idealized HPs in (D) and (E). (I) SEM image of E. huxleyi reproduced from A.S. Rigual-Hernándeza et al., Anthropocene 2020, 31, 100254.
A kinetic model with a set of three kinetic constants–k1, k2, and k3– cumulatively describe light-driven redox reactions initiated by photo-ejected electrons interacting with Ag+ and NPs (Supplementary Text 10, Figure S1A). Futhermore, our kinetic model predicted trends for temporal derivatives of NP concentration, that is, d[NP]/dt, d2[NP]/dt2, and d3[NP]/dt3 (Figure S14). Using experimental data from three light intensities (i.e., 1.3, 8, and 17.2 mW/cm2) and validation points from TEM images (Figure S15 and Figure S16), we estimated these parameters (Figure 3, C-F and Figure S13, C-F). The calculated k1, k2, and k3 values (Table S1) closely matched known rate constants for diffusion-controlled nucleation, growth, and agglomeration of transition-metal nanoclusters.39, 40 As predicted from Eq. S1–S6, k1, k2, and k3, increased linearly with light intensity (Table S1, Figure S17), consistent with photoinduced reaction behavior.
We also sought to determine the chemical basis for the consistent switch from NPm to NPd growth, which correlates with a rapid drop in the chemical potential, μ, as particle volume increases. (Supplementary Text 11). Thermodynamic estimates, based the Gibbs−Thomson relation, surface tension (γ), and the dependence of μ on particle size,31, 36 predict a NP diameter of d=6.4 nm for the transition from rapid to slow NPm growth, marking the onset of the rapid NPd growth. This estimate aligns closely with the experimental diameter of d=6.6 nm ±2.7 nm observed for the self-replicated NPs after 30 minutes of illumination (Figure 1C, Figure S3). A similar NP size of ~6 nm was observed in mother-daughter pairs when the post-formation growth rate decreased (Figure S10). Additionally, cryo-TEM data for NPm indicated a characteristic diameter of ~8 nm (Figure 1E). The continued growth of NPs within chains is attributed to the finite probability of plasmon localization on any NP in the chain and the gradual oxidation of citrate, which increases γ and, consequently, the particle size.
Self-assembly into Hierarchically Organized Particles
Nucleation events at interfaces facilitate NP formation and confine growth, allowing for detailed structural examination. Additionally, solid–liquid interfaces stabilize NP assemblies against fluidic distortions and capillary forces during drying.
We investigated the formation and organization of NP assemblies produced by autocatalytic nucleation in the presence of “hedgehog” particles (HPs) and flat glass substrates. The electromagnetic field localized between the HP spikes restricts the location and growth direction of NP chains but without impeding Ag+ diffusion, creating opportunities for spatial organization of newly formed NPs (Figure 3 and Figure S18). HPs with zinc oxide (ZnO) spikes41 produce hotspot singularities at their apexes (Figure 3D-F) and 365 nm light illumination further induces high-field zones that bridge the spikes (Figure 3F, upper inset). Consequently, NPs preferentially nucleate, grow, and self-assemble on the apexes, forming a second generation of Ag spikes and, in some cases, NP bridges between the ZnO spikes.
Using analysis of structural complexity based on graph theory (GT), as described in a previous study,42 we calculated the complexity index (CI) from GT models of the self-assembled nanostructures. Assuming a uniform distribution of silver nanospikes self-assembled on the apexes of the ZnO mesoscale spikes, the particle in Figure 3D is represented by a graph model in Figure 3G. Similarly, particles with mesoscale ZnO spikes interconnected by self-assembled nanoscale bridges from silver NPs, as shown in Figure 3E, can be represented by a graph model in Figure 3H. Although these models are idealizations of the fully decorated HP subsets, they yield maximum CIs for these colloidal particles that are equal to 19.5 and 37.0, respectively (see calculations in SI). Interestingly, the CI for double-spike HPs shows a linear dependence on the number of silver nanospikes, SAg, as CI=(45/8) • SAg + (81/4). The values of CIs for the hierarchical double-spike and spike-bridged particles, which combine both nanoscale and microscale structural elements, are comparable to the inorganic skeleton of the phytoplankton Emiliania huxleyi43 (Figure 3I). Its graph model aligns with that in Figure 3H, with the same CI value of 37 indicating that the complexity of self-assembled nanostructures can be similar to those observed in nature.
Self-organization into NP Networks
Networks are a nearly universal higher-order structural motif in biology. Illuminating glass slides floating on the growth solution and surface-functionalized with (PSS/PDDA)3PDDA bilayers leads to the formation of nanostructured “colonies” comprising hundreds of interconnected NPs localized in microscale patches. These NP colonies produce neurite-like networks that radiate from a central nucleation site (Figure 4D). Self-organization into networked architectures results from strong attractive vdW forces (Figure 1A), combined with spatial restrictions on NP attachment imposed by the electrostatic repulsion, plasmonic properties of the chains and the solid–liquid interface. Continuous conduction through NP networks conformally grown on solid surfaces can be obtained via electroless metal deposition catalysed by the NPs (Figure S19, and Supplementary Text 12).
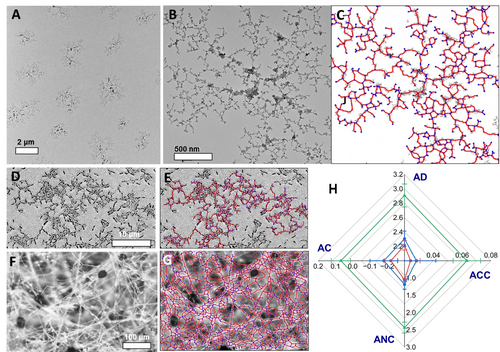
Comparative evaluation of biosimilarity of NP networks. (A) TEM image of the microscale ‘colonies’ of NPs conformally grown on solid substrates. (B–G) Original images (B, D, F) and their graphs (C, E, G) for (B,C) self-replicating NP networks (red −), (D,E) Streptococcus spp. on agar (blue −); and (F,G) R. stolonifera on Capsicum annuum L (green −) (H) The spider plot of GT parameters for NP, bacterial, and fungal networks: AD – average degree, ACC – average clustering coefficient, ANC – average nodal connectivity, and AC – assortativity coefficient.
While the NP networks produced by autocatalytic nucleation may appear random, they follow specific hierarchical patterns.44 Their complexity can also be assessed using GT. Unlike the hierarchical particles in Figure 3, which are analyzed based on nodes with identical graph symmetry (marked by color, see SI), self-assembled networks require a different approach. For infinite graphs where each node's neighbors and degrees (i.e., the number of connected edges), can vary stochastically, the CI becomes infinite. Nevertheless, these networks exhibit non-random structural organization. The identification of their structural patterns requires assessment and comparison of multiple GT parameters (Figure 4), which, like CI, can be extracted from microscopy data.
To highlight the biosimilarity and non-randomness of the NP networks, we compared them to bacterial and fungal networks. Specifically, we used Streptococcus spp biofilms grown on agar and R. stolonifera biofilms grown on Capsicum annuum L as models for bacterial and fungal networks, respectively. Additional fungal network data were sourced from the literature, including Aspergillus fumigatus biofilm grown on human bronchial epithelia cells,45 Trametes versicolor biofilm grown on wheat grain,46 Ganoderma lucidum biofilm grown on wood,47 and Aspergillus niger 55890 biofilm grown on agar (Figure S21 and Table S1).
The GT parameters (also known as descriptors or indexes) of average nodal degree (AD), average clustering coefficient (ACC), average nodal connectivity (ANC), and assortativity coefficient (AC) enabled a quantitative, multiparameter comparison of the organizational patterns. Although none of the investigated fibrous networks do not form perfectly ordered square, triangular, or other lattices, the values and variability of ACC, ANC, and AC suggest they are far from random. For example, the absolute value of |AC| ranges from 0.25 to 0.3, in contrast to the value of 0 expected in random networks. Similarly, ACC in random networks with a similar number of nodes is typically ~10−3, but the ACC for NP and other networks in Figure 4 is 10 times larger exceeding 10−2.
The analysis of connectivity patterns based on multiple GT descriptors reveals that NP networks are structurally identical to those produced by Streptococcus spp (Figure 4), yet markedly different from those networks produced by a wide spectrum of fungi. Both bacteria and NP networks result from autocatalytic nucleation followed by the attachment of NPd to NPm in a “replicate-and-attach” mechanism. In contrast, fungal networks are the product of individual cell growth, leading to intersections (“grow-and-intersect” mechanism), which produces distinct topological patterns.
Applying Fractal Theory (FT) provides further insights into the complexity and structural motifs of both synthetic and biological structures. The average fractal dimension, df, for NP networks is 1.75±0.041, which is consistent with dendritic NP assemblies reported in previous studies.48 Bacterial and fungal networks display df values of 1.88±0.040 and 1.85±0.020, respectively. The similarity in fractal dimensions across these networks highlights the value of GT for more nuanced and accurate analysis. Nevertheless, combining GT and FT, we achieve a quantitative evaluation of complexity based on multifractal spectra, f(α), of their graph representations.49 The Lipschitz-Hölder exponent, α, at the maximum of f(α) is 1.41, 1.2, and 1.45 for NP networks, Streptococcus spp, and R. stolonifera, respectively (Figure S23). These findings suggest that despite their simple components, NP networks are as complex as the those produced by bacteria and fungi.
Conclusions
In summary, silver NPs can multiply autocatalytically, producing a polydisperse population of offspring by utilizing the energy of incident photons. Newly formed NPs attach to previously formed NPs via strong van der Waals attraction, counterbalanced by electrostatic repulsion, resulting in an extensive network of interconnected chains. The coupled processes of autocatalytic nucleation, growth, and self-assembly are supported by interfaces and can occur on both dispersed particles and solid substrates. Structural analysis of these solid-stabilized NP assemblies using GT and FT reveals a complexity comparable to that of their biological analogs. The emergence of NP systems with quantifiable similarities to biological patterns may provide the missing link between inorganic and organic complex systems existing in the primordial Earth. They may also explain the formation of complex inorganic structures in meteorites and fossils misclassified as biological,50 which could otherwise be entirely abiotic.
Funding
This work was supported by the NSF 2243104 project “Center of Complex Particle Systems (COMPASS)”; Vannevar Bush DoD Fellowship to N.A.K. titled “Engineered Chiral Ceramics” ONR N000141812876 and in part by the Office of Naval Research (MURI N00014-20–1-2479); ONR COVID-19 Newton Award “Pathways to Complexity with ‘Imperfect’ Nanoparticles” HQ00342010033; AFOSR FA9550-20–1-0265, “Graph Theory Description of Network Material” as well as NSF project “Energy- and Cost-Efficient Manufacturing Employing Nanoparticles” NSF 1463474, and “Nanospiked Particles for Photocatalysis” NSF 1566460. Michigan Center for Materials Characterization (MC)2 is acknowledged for its assistance with electron microscopy, and for the NSF grant #DMR-9871177 for funding of the JEOL 2010F analytical electron microscope used in this work.
Supporting Information
Data and materials availability: All data are available in the main text or the Supporting Information.
Author contributions
Conceptualization: NAK. Methodology of NP autocatalytic nucleation: CNM and NAK. Investigation of NP autocatalytic nucleation: CNM. Visualization of NP autocatalytic nucleation: CNM. GT calculations of NP and bacterial networks: KGW. Methodology and imaging of biofilm cultures: ESTE and SJV. Fractal analysis of all networks; GT analysis of bacterial and fungal network: DO; JL – electromagnetic calculations. Funding acquisition: NAK. Supervision: NAK. Writing – original draft: CNM and NAK. Writing – review & editing: CNM, KGW, ESTE, DO, JL and NAK.
Acknowledgments
The authors thank E. Wilson for supplying the hedgehog particles. We also thank D. Hoff for support with dark-field microscopy, B. Kerns for discussions on cryo-TEM, E. M. Nieves for support with Streptococcus spp. biofilm culture, and Q. Cheek for helpful discussions on liquid TEM.
Conflict of Interests
Authors declare that they have no competing interests.
Open Research
Data Availability Statement
The data that support the findings of this study are available in the supplementary material of this article.


