Exercise haemodynamics may unmask the diagnosis of diastolic dysfunction among patients with pulmonary hypertension
Abstract
Aims
Heart failure with preserved ejection fraction can lead to pulmonary hypertension. The aim of the present study was to evaluate the role of exercise during right heart catheterization in the unmasking of diastolic dysfunction.
Methods and results
Between 2004 and 2012, 200 symptomatic patients with exertional dyspnoea, preserved left ventricular systolic function and suspected pulmonary hypertension, underwent right heart catheterization. Included in the study were 63 patients with resting pulmonary arterial wedge pressure (PAWP) ≤15 mmHg. Patients were divided to three tertiles based on their peak exercise PAWP. Mean age was 60 ± 20 years and 29% were males. Mean pulmonary arterial pressure was 31 ± 14 mmHg at rest and 42 ± 18 mmHg upon exercise. Mean change in PAWP between rest and exercise was 0.0 ± 4.3, 4.6 ± 2.4, and 16.6 ± 7.1 mmHg in the lower, middle, and upper tertiles, respectively (P < 0.001). Higher exercise PAWP tertiles were associated with reduced pulmonary vascular resistance (8.3 ± 6.7, 2.9 ± 2.7, and 5.8 ± 4.6 Woods units, respectively; P = 0.004). A multivariate linear regression model demonstrated that each 5 kg/m2 increase in body mass index was associated with 2.5 ± 1.0 mmHg increase in exercise PAWP (P = 0.017). A multivariate binary logistic model showed that subjects with borderline PAWP at rest (12–15 mmHg) were 4.5 times more likely to be in the upper tertile of exercise PAWP (P = 0.011).
Conclusions
In symptomatic patients with pulmonary hypertension, preserved left ventricular ejection fraction and PAWP ≤15 mmHg, exercise during right heart catheterization may unmask diastolic dysfunction. This is especially true for obese patients and patients with borderline resting PAWP.
Introduction
Left-sided heart failure is the most common cause of pulmonary hypertension (PHT).1 Heart failure with preserved ejection fraction (HFpEF) is a growing public health problem, which can also lead to PHT in up to 70% of patients.2-5 Pulmonary hypertension caused by left heart disease or post-capillary PHT is currently classified as group 2 PHT according to the Dana Point 2008 PHT classification and is associated with high morbidity and mortality.6-8 The group 2 PHT subtype is defined by a mean pulmonary arterial pressure ≥25 mmHg and a resting pulmonary arterial wedge pressure (PAWP) ≤15 mmHg; the latter criterion differentiates group 2 PHT from other types of PHT or pre-capillary PHT.9
In order to differentiate pulmonary arterial hypertension (group 1 PHT) from group 2 PHT, it is mandatory to invasively assess PAWP at rest. However, despite the increasing prevalence of HFpEF, data on the role of exercise haemodynamics in the diagnosis of patients with pulmonary hypertension and preserved ejection fraction (EF) is limited.9 To date, there are no defined criteria and much controversy exists concerning the role of stress manoeuvres and volume overload during right heart catheterization. The aim of the present study was to assess the role of exercise haemodynamics in the diagnosis of group 2 PHT among patients with normal PAWP at rest.
Methods
Study population
Between 2004 and 2012, 200 consecutive symptomatic patients with exertional dyspnoea of New York Heart Association (NYHA) class II–IV, preserved left ventricular systolic function, and elevated pulmonary artery pressure by echocardiogram, underwent right heart catheterization at a tertiary medical centre in Israel. These patients were retrospectively evaluated for the purpose of this study. Before catheterization, all patients were clinically evaluated by a team of cardiologists and pulmonologists. Pre-catheterization evaluation included physical examination, electrocardiogram, chest X-ray, echocardiography, pulmonary function test, and lung perfusion scan if required. Data collection was approved by the local institutional review committee.
For the purpose of the present study, patients with significant valvular disease (defined as any degree of aortic or mitral stenosis, and more than mild mitral or aortic regurgitation), left ventricular ejection fraction <50% by echo, or significant lung disease by lung function test were excluded.
Of the 200 patients evaluated in the catheterization laboratory, final study population included 63 patients with normal mean PAWP at rest (i.e. ≤15 mmHg), i.e. suspected non-group 2 PHT. In the primary analysis, and as there are no validated levels of ‘normal’ PAWP at exercise, the study population was divided arbitrarily to three tertiles based on maximal exercise PAWP. Three tertiles consisted of <11 mmHg, 11–18 mmHg, and >18 mmHg, based on the distribution of exercise PAWP in the final study population.
Echocardiography
Two-dimensional transthoracic echocardiographic and Doppler studies were obtained with clinical ultrasound machines equipped with 3.5 MHz transducers using standard views. The studies were digitally stored (McKesson's Horizon Cardiology™ Medical Software; Tel Aviv, Israel). Left ventricular function was estimated by the reader. Echocardiographic evaluation was in accordance with the American Society of Echocardiography Guidelines and Standards.
Right heart catheterization
A pulmonary artery catheter was introduced through the right or left femoral vein using the Seldinger technique. The transducer was carefully adjusted to reflect the height of the mid-chest of every patient as previously described10. Systolic, diastolic, and mean right atrial pressure, right ventricular pressure, pulmonary arterial pressure (PAP) and PAWP were measured directly using a 7.5 French Swan–Ganz catheter(Edwards LifeSciences, Irvine, CA, USA). Mean PAWP was measured at end-expiration by assessing digitalized and paper tracings. Cardiac output (CO) was measured according to both estimated Fick and thermo-dilution methods. Stroke volume was calculated by dividing the CO by the heart rate. The trans-pulmonary gradient (TPG) and the diastolic pressure gradient were calculated as previously described.11 Although not part of the routine haemodynamic assessment of patients with PHT, resting right heart catheterization was followed by moderate intensity exercise of the upper extremities, which comprised abduction–adduction movement of the upper limbs while holding 1–1.5 kg weights, until reaching at least a 10% rise in heart rate, compared with baseline, or until patient exhaustion. Hemodynamic measurements were repeated at peak exercise. The exercise protocol was approved by an institutional committee.
Statistical analysis
Categorical data were compared with the use of the chi-square test or Fisher's exact test. Continuous data were compared with Student t-test or one-way ANOVA as appropriate. In addition to the primary analysis , additional analyses included: (i) three tertiles based on the degree of change in PAWP between rest and exercise (cut-off points of 3 mmHg and 8 mmHg) and (ii) patients with borderline PAWP at rest (12–15 mmHg) vs. patients with PAWP at rest <12 mmHg. A multivariate linear regression model was used to evaluate the association between body mass index (BMI) and exercise PAWP. Similarly, a multivariate binary logistic regression model was used to evaluate the role of borderline PAWP (12–15 mmHg) and obesity in identifying which patients will have exercise PAWP >18 mmHg (upper tertile of the study population). Age (above and below 60 years) and gender were used as pre-specified categorical covariates in both models. Statistical significance was accepted for a two-sided P < 0.05. The statistical analyses were performed with IBM SPSS version 20.0 (Chicago, IL, USA).
Results
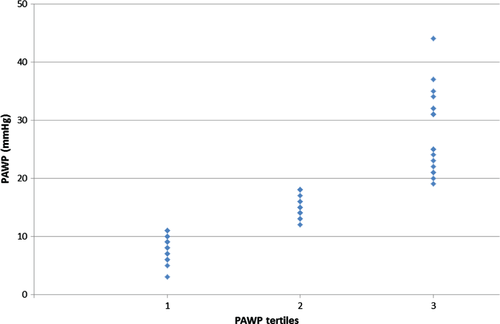
The final sample population included 63 patients and consisted of predominantly women (71%) with a mean age of 60 ± 20 years. Baseline characteristics of study population according to tertiles of peak exercise PAWP are summarized in Table 1. The distribution of PAWP at exercise among the tertiles is shown in Figure 1. There was a trend towards a higher proportion of women and elderly patients in the middle and upper tertiles that did not reach statistical significance. While there were no statistically significant differences in the rates of hypertension, diabetes mellitus or dyslipidaemia among the three study groups, there was a trend towards higher rates of hypertension in the middle and upper tertiles (36%, 63%, and 62%, respectively, P = 0.14). Study groups had similar rates of ischaemic heart disease, atrial fibrillation and chronic lung disease, as well as similar rates of chronic use of cardiac medications (data not shown). The BMI increased significantly between the lower, middle, and upper tertiles (24 ± 4, 28 ± 4, and 28 ± 7 kg/m2, respectively, P = 0.023). Similarly, obesity (BMI >30 kg/m2) was significantly more common in the middle and upper tertiles.
| All (n = 63) | Low (n = 23) ≤11 mmHg | Mid (n = =19) 12–18 mmHg | High (n = 21) >18 mmHg | P | |
|---|---|---|---|---|---|
| Age (years) a | 60 ± 20 | 53 ± 22 | 65 ± 17 | 62 ± 17 | 0.10 |
| Male sex | 18 (29%) | 10 (44%) | 3 (16%) | 5 (24%) | 0.12 |
| Body surface area (m2) | 1.81 ± 0.25 | 1.79 ± 0.21 | 1.79 ± 0.25 | 1.83 ± 0.29 | 0.85 |
| Body mass index (kg/m2)* | 27 ± 5 | 24 ± 4 | 28 ± 4 | 28 ± 7 | 0.023 |
| Obesity | 14 (22%) | 1 (4%) | 6 (32%) | 7 (33%) | 0.035 |
| Hypertension | 33 (53%) | 8 (36%) | 12 (63%) | 13 (62%) | 0.14 |
| Diabetes mellitus | 12 (20%) | 4 (18%) | 2 (11%) | 6 (30%) | 0.30 |
| Dyslipidaemia | 24 (39%) | 7 (32%) | 8 (42%) | 9 (45%) | 0.65 |
| Active smoking | 6 (10%) | 4 (17%) | 1 (5%) | 1 (5%) | 0.35 |
| Ischaemic heart disease | 8 (13%) | 2 (9%) | 3 (16%) | 3 (15%) | 0.75 |
| Chronic lung disease | 13 (21%) | 6 (27%) | 3 (16%) | 4 (20%) | 0.66 |
| Atrial fibrillation | 8 (13%) | 2 (9%) | 2 (11%) | 4 (20%) | 0.53 |
| Haemoglobin (g/dL)† | 13.6 ± 1.6 | 13.9 ± 1.7 | 13.1 ± 1.6 | 13.6 ± 1.5 | 0.31 |
| GFR (mL/min) a | 76 ± 33 | 77 ± 31 | 77 ± 33 | 74 ± 37 | 0.94 |
- GFR, glomerular filtration rate.
- * Values are expressed as mean ± SD.
- † SI conversion factors: to convert haemoglobin to mg/dl divide values by 10
Echocardiographic data
Echocardiographic data are summarized in Table 2. Mean estimated right ventricular systolic pressure was 61 ± 26 mmHg, with statistically significant lower values in the middle tertile. Left ventricular systolic and diastolic dimensions as well as estimated left ventricular ejection fraction were similar across the three study groups. Notably, patients in the upper tertiles demonstrated larger left atrial areas (17 ± 4, 18 ± 2, 21 ± 6 cm2; P = 0.034) and higher rates of predefined left atrial enlargement. While E/a ratio and E/e′ ratio were similar in the three groups, patients in the upper tertile had significantly higher E wave peak velocities (69 ± 17, 72 ± 11 and 100 ± 46 cm/s, respectively, P = 0.03).
| All (n = 50) | Low (n = 18) ≤11 mmHg | Middle (n = 17) 12–18 mmHg | High (n = 15) >18 mmHg | P-value | |
|---|---|---|---|---|---|
| Estimated LVEF (%) | 60 ± 5 | 59 ± 6 | 62 ± 4 | 60 ± 3 | 0.21 |
| LVESD (mm) | 24 ± 6 | 25 ± 6 | 23 ± 6 | 23 ± 8 | 0.48 |
| LVEDD (mm) | 43 ± 6 | 40 ± 7 | 45 ± 4 | 43 ± 6 | 0.06 |
| LVEDD/BSA (mm/m2) | 24 ± 4 | 23 ± 4 | 26 ± 4 | 24 ± 3 | 0.06 |
| IVS (mm) | 9.7 ± 2.2 | 9.9 ± 2.9 | 9.4 ± 1.5 | 9.9 ± 2.0 | 0.71 |
| PW (mm) | 9.3 ± 2.3 | 8.7 ± 2.3 | 9.2 ± 1.1 | 10.4 ± 3.0 | 0.12 |
| LV mass (grams) | 130 ± 33 | 128 ± 38 | 138 ± 24 | 117 ± 6 | 0.43 |
| LV mass index (g/m2) | 74 ± 16 | 74 ± 17 | 80 ± 15 | 64 ± 14 | 0.19 |
| LA diameter (mm) | 36 ± 6 | 34 ± 6 | 38 ± 4 | 38 ± 7 | 0.11 |
| LA area (cm2) | 19 ± 4 | 17 ± 4 | 18 ± 2 | 21 ± 6 | 0.035 |
| LA volume (mL) | 83 ± 30 | 74 ± 26 | 77 ± 20 | 101 ± 38 | 0.027 |
| LA volume/BSA (mL/m2) | 49 ± 17 | 42 ± 14 | 44 ± 13 | 57 ± 22 | 0.029 |
| LA enlargement (%) | 33 | 12 | 31 | 62 | 0.017 |
| SPAP (mmHg) | 61 ± 26 | 68 ± 29 | 45 ± 17 | 68 ± 23 | 0.010 |
| Peak E wave (cm/s) | 78 ± 29 | 69 ± 17 | 72 ± 11 | 100 ± 46 | 0.030 |
| Peak A wave (cm/s) | 70 ± 22 | 64 ± 21 | 73 ± 13 | 80 ± 31 | 0.26 |
| E/A ratio | 1.2 ± 0.7 | 1.4 ± 1.0 | 1.0 ± 0.3 | 1.1 ± 0.3 | 0.48 |
| E/e′ ratio (septal) | 11.8 ± 5.2 | 12.0 ± 4.8 | 10.8 ± 4.6 | 12.3 ± 7.0 | 0.86 |
| E/e' ratio (lateral) | 7.5 ± 3.7 | 6.7 ± 2.3 | 6.9 ± 2.0 | 9.7 ± 6.6 | 0.24 |
- LVEF, left ventricle ejection fraction; LVESD, left ventricular end systolic diameter; LVEDD, left ventricular end diastolic diameter; IVS, interventricular septum; PW, posterior wall; LV, left ventricle; LA, left atrium; SPAP, estimated systolic pulmonary arterial pressure.
- Values are expressed as mean ± SD.
Right heart catheterization and exercise haemodynamics
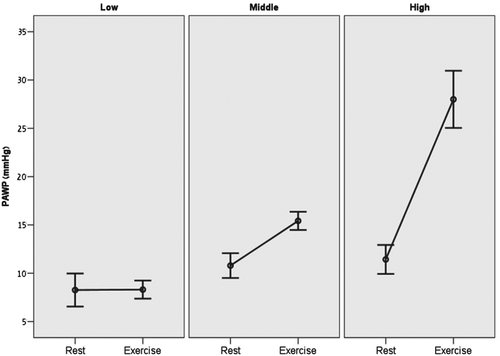
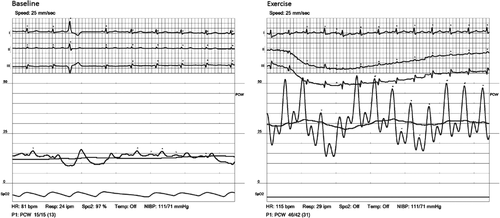
Complete results of right heart catheterization and exercise haemodynamics are summarized in Table 3. Mean resting heart rate of the study population was 79 ± 14 bpm, which increased to 98 ± 14 bpm at peak exercise (mean change of 19 ± 14 bpm; average increase of 24%). The peak exercise heart rate was 61 ± 8% of the age-predicted maximal heart rate (220-Age). Mean resting PAWP of the entire study population was 10.1 ± 3.6 mmHg and mean exercise PAWP was 17.0 ± 9.3 mmHg. Figure 1 graphically shows the distribution of exercise PAWP in the different study groups. Patients in the upper tertile demonstrated not only higher absolute exercise PAWP values, but also a significantly higher change between rest and exercise PAWP pressures (change of 0.0 ± 4.3, 4.6 ± 2.4, and 16.6 ± 7.1 in the lower middle and upper tertiles, respectively; P = 0.001; Figure 2). Higher exercise PAWP tertiles were associated with lower transpulmonary pressure gradients at rest (28 ± 16, 13 ± 10, and 22 ± 13 mmHg; P = 0.002) and during exercise (28 ± 16, 13 ± 10, and 22 ± 13 mmHg; P = 0.001). This association was also true for diastolic transpulmonary pressure gradients11 at rest and during exercise. Moreover, higher exercise PAWP was also associated with reduced pulmonary vascular resistance at rest (8.3 ± 6.7, 2.9 ± 2.7, and 5.8 ± 4.6 Woods units; P = 0.004) and during exercise (8.0 ± 6.9, 2.9 ± 2.1, and 3.2 ± 2.4 Woods units; P = 0.008). A specific example of PAWP tracings at rest and exercise showing also the development of ‘giant’ V-waves is shown in Figure 3.
| All (n = 63) | Low (n = 23) ≤11 mmHg> | Middle (n = 19) 12–18 mmHg | High (n = 21) >18 mmHg | P-value | |
|---|---|---|---|---|---|
| Heart rate at rest (bpm)* | |||||
| Rest | 79 ± 14 | 84 ± 15 | 77 ± 13 | 76 ± 11 | 0.08 |
| Exercise | 98 ± 14 | 101 ± 15 | 98 ± 11 | 95 ± 16 | 0.36 |
| Change in heart rate (bpm)* | 19 ± 14 | 17 ± 15 | 20 ± 11 | 19 ± 14 | 0.76 |
| RA pressure at rest (mmHg)* | 6.2 ± 3.8 | 5.1 ± 4.6 | 6.5 ± 2.0 | 7.2 ± 3.7 | 0.19 |
| Mean PAP (mmHg)* | |||||
| Rest | 31 ± 14 | 36 ± 16 | 24 ± 10 | 34 ± 12 | 0.007 |
| Exercise | 42 ± 18 | 43 ± 19 | 31 ± 12 | 50 ± 15 | 0.002 |
| Change in mean PAP (mmHg)* | 10 ± 9 | 6 ± 7 | 7 ± 6 | 17 ± 9 | <0.001 |
| Borderline PAWP at rest (%)† | 38 | 22 | 32 | 62 | 0.018 |
| PAWP (mmHg)* | |||||
| Rest | 10.1 ± 3.6 | 8.3 ± 3.9 | 10.8 ± 2.7 | 11.4 ± 3.3 | 0.007 |
| Exercise | 17.0 ± 9.3 | 8.3 ± 2.2 | 15.4 ± 2.0 | 28.0 ± 6.5 | <0.001 |
| Change in PAWP (mmHg)* | 6.9 ± 8.7 | 0.0 ± 4.3 | 4.6 ± 2.4 | 16.6 ± 7.1 | <0.001 |
| TPG (mmHg)* | |||||
| Rest | 21 ± 15 | 28 ± 16 | 13 ± 10 | 22 ± 13 | 0.002 |
| Exercise | 25 ± 17 | 34 ± 19 | 16 ± 12 | 22 ± 14 | 0.001 |
| DPG (mmHg)* | |||||
| Rest | 9.8 ± 10.1 | 14.4 ± 11.3 | 3.5 ± 5.1 | 10.5 ± 9.6 | 0.001 |
| Exercise | 10.5 ± 14.0 | 18.8 ± 11.8 | 4.1 ± 7.1 | 7.2 ± 16.6 | 0.001 |
| CO at rest (L/min)* | |||||
| Rest | 4.4 ± 1.5 | 4.2 ± 1.6 | 5.0 ± 1.6 | 4.2 ± 1.2 | 0.23 |
| Exercise | 6.8 ± 2.1 | 6.4 ± 2.7 | 7.4 ± 1.7 | 6.7 ± 1.5 | 0.52 |
| CI (L/min.m2)* | |||||
| Rest | 2.5 ± 0.8 | 2.4 ± 0.9 | 2.8 ± 0.8 | 2.3 ± 0.5 | 0.10 |
| Exercise | 3.8 ± 1.1 | 3.6 ± 1.4 | 4.2 ± 0.9 | 3.8 ± 0.9 | 0.38 |
| PVR (Woods units)* | |||||
| Rest | 5.9 ± 5.4 | 8.3 ± 6.7 | 2.9 ± 2.7 | 5.8 ± 4.6 | 0.004 |
| Exercise | 4.9 ± 5.1 | 8.0 ± 6.9 | 2.9 ± 2.1 | 3.2 ± 2.4 | 0.008 |
- RA, right atrium; PAP, pulmonary artery pressure (mean); PAWP, pulmonary capillary wedge pressure; TPG, transpulmonary gradient; DPG, diastolic transpulmonary gradient; CO, cardiac output; CI, cardiac index; PVR, pulmonary vascular resistance.
- * Values are expressed as mean ± SD.
- † PAWP = 12–15 mmHg
A second analysis compared patients with borderline rest PAWP (12–15 mmHg; n = 24) and patients with low resting PAWP (<12 mmHg; n = 39). Both groups were similar with respect to age, sex and all other baseline clinical characteristics (data not shown). Echocardiographic parameters were similar between the two groups, with the exception of higher peak E-wave velocities (98 ± 36 vs. 67 ± 17 cm/s; P = 0.014) and a trend towards higher rates of left atrial enlargement among patients with borderline PAWP at rest (50% vs. 21%, P = 0.058). Borderline PAWP at rest was associated with significantly lower transpulmonary pressure gradients at rest (16.5 ± 10 vs. 24.2 ± 16.1 mmHg; P = 0.023), lower diastolic trans-pulmonary pressure gradients at rest (5.5 ± 6.0 vs. 12.4 ± 11.3; p = 0.003) and lower pulmonary vascular resistance at rest (3.8 ± 2.2 vs. 7.2 ± 6.4; P = 0.004). During exercise, patients with borderline PAWP at rest demonstrated lower pulmonary vascular resistance compared with patients with normal PAWP (3.0 ± 2.4 vs. 5.9 ± 5.8; P = 0.035).
Role of BMI
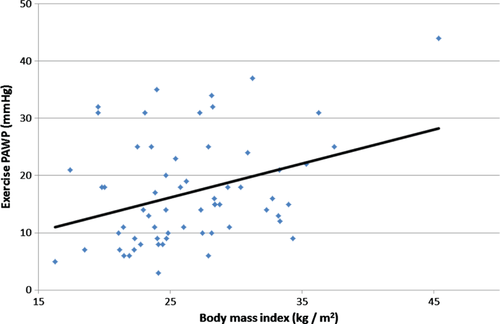
The correlation between BMI and exercise PAWP is shown in Figure 4. Among patients with normal rest PAWP, there were 14 (23%) patients with body mass index >30 kg/m2. Obese patients had a mean BMI of 34 ± 4 kg/m2 vs. 24 ± 3 kg/m2 among non-obese patients (P < 0.001). Both groups had similar baseline clinical and echocardiographic characteristics, with the exception of higher lateral E/e′ ratio (12.8 ± 4.1 in the obese patients vs. 6.2 ± 2.2 in the non-obese; P = 0.001). Compared with non-obese patients, right heart catheterization of obese patients demonstrated similar pulmonary arterial pressure at rest and during exercise, and a similar PAWP at rest. However, obese patients had significantly higher exercise PAWP (22 ± 10 vs. 16 ± 9 mmHg; P = 0.039) and a trend towards a higher change in PAWP between rest and exercise (11 ± 8 vs. 6 ± 9, P = 0.066). There were no significant differences in transpulmonary pressure gradient and pulmonary vascular resistance between obese and non-obese patients.
Multivariate models
A multivariate linear logistic regression model, with age and gender as covariates was used to evaluate predictors of higher PAWP at exercise. While age and gender were not significantly associated with PAWP at exercise (P = 0.09 and P = 0.399, respectively), our model demonstrated that each 5 kg/m2 increase in BMI was associated with 2.5 ± 1.0 mmHg increase in exercise PAWP (P = 0.017), and that borderline PAWP (12–15 mmHg) at rest was associated with 5.3 ± 2.2 mmHg increase in exercise PAWP (P = 0.019). Similarly, a multivariate binary logistic model adjusted for age, gender, and BMI showed that subjects with borderline PAWP at rest were 4.5 times more likely to be in the upper tertile of exercise PAWP [hazard ratio (HR) = 4.45 95% confidence intervals (CI) 1.4–14.1, P = 0.011].
Discussion
This study evaluated the importance of exercise haemodynamics in the diagnosis of masked HFpEF among patients with exertional dyspnoea, suspected pulmonary hypertension, and normal PAWP at rest. We screened 200 consecutive patients and identified 63 subjects with preserved left ventricular systolic function, no significant lung or valvular disease, and normal PAWP at rest, who completed rest and exercise haemodynamic evaluations during a right heart study. The main finding of our study is that exercise haemodynamics may unmask early diastolic dysfunction in a significant proportion of this population. The diagnosis of HFpEF in this population has important clinical and therapeutic implications as it reclassifies the diagnosis from pre-capillary to post-capillary PHT, and redirects the clinical focus to a cardiovascular aetiology.
The diagnosis of HFpEF is challenging and requires signs or symptoms of heart failure, preserved ejection fraction, and evidence of left ventricular diastolic dysfunction. The consensus statement by the European Society of Cardiology suggests using either right heart catheterization or tissue Doppler echocardiography in order to diagnose HFpEF.12 However, there is growing data regarding an ‘early’ phase among HFpEF patients, in which clinical and laboratory findings are subtle or absent at rest, but become apparent during exercise.13 The echocardiographic assessment of diastolic function during a stress study is not validated and is not routinely performed, partly because of technical difficulties.
In our analysis, one-third of the study population had normal resting PAWP coupled with exercise PAWP >18 mmHg. These patients had clinical, echocardiographic, and haemodynamic findings that support the diagnosis of early diastolic dysfunction. While these patients were older and predominantly women, these differences did not reach statistical significance. However, we did find higher BMI and higher rates of obesity among these patients. Most echocardiographic parameters were not different in patients with elevated exercise PAWP except for significantly higher rates of left atrial enlargement, and higher peak E wave velocities. Both of these echocardiographic parameters have been shown to correlate with diastolic dysfunction.14 Haemodynamic studies of these patients demonstrated lower mean and diastolic trans-pulmonary pressure gradients, and lower pulmonary vascular resistance. Higher transpulmonary gradient and pulmonary vascular resistance are used to differentiate intrinsic pulmonary vascular disease from left-heart conditions,11 and, therefore, our findings suggest that primary disease of the pulmonary vasculature is less likely to exist in these patients.
Previous reports clearly demonstrated that exercise can be used to identify a significant increase in left ventricular filling pressures among subjects with normal pressures at rest, and therefore aid in the diagnosis of diastolic dysfunction and HFpEF.14 For example, Ha et al.15 used echocardiography to evaluate patients with normal left ventricular EF and exertional dyspnoea and found a subgroup of patients who had a normal E/E′ ratio at rest which increased during exercise. In a similar study Burgess et al.16 measured E/E′ at rest and during supine cycle ergometry in 37 patients undergoing left heart catheterization. They successfully demonstrated that E/E′ correlated with invasively measured left ventricular diastolic pressure during exercise, and concluded that exercise can be used to identify patients with reduced exercise capacity and increased left ventricular filling pressures.16
In an important study by Borlaug et al.,13 55 patients with exertional dyspnoea and EF >50% were referred for invasive exercise haemodynamic studies. The investigators used exercise PAWP >25 mmHg to diagnosis HFpEF, and showed that HFpEF patients had normal cardiac filling pressures at rest but a markedly abnormal haemodynamic response to exercise. Their relatively high cut-off of 25 mmHg is significantly different from our report because they requested patients to reach maximal exertion, while our exercise protocol was of moderate intensity and was limited to a 10% increase in heart rate. Our modest intensity protocol is probably more suitable and convenient for routine clinical practice. These investigators did state, however, that similar results were obtained even when an exercise PAWP cut-off of 18 mmHg was used in their analysis, which is exactly the cut-off of the upper tertile exercise PAWP in our study.
Classification is crucial in determining treatment and prognosis among patients with PHT.17 However, despite the cumulative data on the role of exercise in the diagnosis of diastolic dysfunction and HFpEF, current guidelines do not recommend the routine use of exercise haemodynamics for the diagnosis and classification of PHT, and differentiation between pre- and post-capillary PHT is solely based on PAWP below and above 15 mmHg at rest.9, 18, 19 The finding in our study that patients with borderline PAWP levels (12–15 mmHg) at rest more frequently have elevated levels at exercise, may question the use of 15 mmHg as a definite cut-off value differentiating between pre- and post-capillary PHT.
Our multivariate models successfully showed that there are subpopulations in which exercise haemodynamics are especially important, such as higher BMI and patients with borderline PAWP at rest. Therefore, our results suggest that exercise haemodynamics may have an important role in these specific subpopulations with risk factors or clues for diastolic dysfunction, and when echocardiography and resting haemodynamic studies are equivocal. Subpopulations in which exercise haemodynamics might be also appropriate include older patients, and patients with hypertension, atrial fibrillation, diabetes mellitus, enlargement of the left atrium, and an E/E′ ratio >15.12, 20 Using a multivariate linear regression model we clearly showed that higher BMI is associated with increased exercise PAWP. As there is no clear definition or cut-off value for exercise PAWP, we preferred to use a linear model. Our results are supported by previous data about the association between obesity, diastolic dysfunction, and atrial fibrillation.12, 21 These data include the important work of Russo et al.22 who used a community-based study of 950 subjects to show that increased BMI was associated with worse left ventricular diastolic function. We believe that, in the special case of obese patients with PHT and preserved systolic function, every effort should be made to include exercise as a routine part of right heart catheterization.
As this is a retrospective analysis of patients with exertional dyspnoea who were referred for right heart catheterization, the study suffers from selection bias and the results may not be applicable to other populations. Owing to the small sample size, our analysis was underpowered to identify other potential clinical or echocardiographic markers of early diastolic dysfunction. In addition, the degree of exercise was not uniform for all patients (the increase in exercise intensity was stopped once the patient's heart rate increased by at least 10%). However, Borlaug and colleagues13 showed that 85% of the increase in PAWP occurred at low-level exercise, similar to the work level reported in the present study. Significantly, echocardiographic data was not available for all subjects, and echocardiographic data were collected from multiple echocardiography laboratories. It might also be speculated that exercise increase in PAWP may not be caused by unmasked diastolic dysfunction but rather the ‘Bernheim effect’ (e.g. acute distension of the right ventricle leading to compression of the left ventricle). However, the echocardiographic parameters at rest of patients in upper tertile of PAWP at exercise provide an indication that we are probably dealing with patients in the early stages of HFpEF. Furthermore, mode of exercise using upper limbs may cause elevation of intrathoracic pressures and may influence the interpretation of PAWP at exercise. However, as this mode of exercise was performed homogeneously in all patients we believe that it does identify the group of patients with true elevation of PAWP at exercise. Lastly, patients in the middle tertile had significantly lower pulmonary arterial pressures, with no apparent explanation other than chance.
In conclusion, in patients with exertional dyspnoea, suspected PHT, preserved left ventricular systolic function, and PAWP ≤15 mmHg, exercise during right heart catheterization may enhance the diagnosis of diastolic dysfunction allowing reclassification of PHT from pre-capillary to post-capillary.
Funding
None.
Conflict of interest: none declared.


