Assessment of aggregate resources: an integrated geophysical approach
ABSTRACT
Fluvio-glacial sand and gravel provide an important resource for the construction industry. The efficient and economic extraction of such geologically complex deposits requires a detailed understanding of their grade distribution. This is typically undertaken as point observations over the resource using a borehole drilling programme. We investigate the viability of using measurements of the elastic and electrical properties of the subsurface, derived from geophysical profiles, to determine the spatial variability of aggregate quality.
A refraction seismic, surface wave seismic and resistivity survey was carried out over a fluvioglacial sand and gravel deposit at Scorton, Yorkshire, UK, on agricultural land adjacent to an active quarry. Two 190 m profiles, with borehole control at their extremes, were acquired with a 2 m source and receiver spacing. The P- and S-wave velocities ( and
and  ), together with resistivity and depth distributions were determined down to c. 20 m. The subsurface was divided into four layers: uncon-solidated sand and gravel; dry consolidated sand and gravel; saturated sand and gravel; and basal clay.
The work flow initially involved processing and interpreting the three geophysical techniques independently. Crossplots of the elastic and electrical parameters were used to distinguish unconsolidated from consolidated material; the water table; increased silt content; and recognize the basal clay. The Vp/Vs ratio proved very powerful at discriminating fine material ( ) from coarse material (Vp/Vs ~ 1.5). Regression analysis of crossplots produced P- and S-wave relationships for the material, while electro-acoustic relationships were less successful, especially below the water table. The results of the petrophysical analysis were used to set up guided inversions for the resistivity survey. Careful use of the refraction results as an a priori model for the resistivity survey was found to improve the resistivity inversion, though use of a sharp boundary introduced edge effects at the water table.
The results from the integrated analysis were combined with the guided inversions into a final interpretation that enabled silt content, particle size and clay lenses to be mapped, which were not identified in the separately processed data.
INTRODUCTION
Fluvio-glacial sand and gravel provide an important resource for the construction industry, however the complex nature of their deposition causes significant challenges for the efficient and economic extraction of such deposits (Long et al. 2004). The standard technique for assessing both the spatial distribution and quality of a reserve is to undertake a shallow drilling programme. Such a procedure is limited by spatial sampling and the difficulty of distinguishing between boulders and coarse, yet economic, material with standard drilling techniques. We investigate the integration of elastic and electrical properties of the subsurface derived from surface geophysical measurements to determine the spatial variability of aggregate quality over a test site adjacent to the active Scorton gravel and sand quarry in the Swale-Ure Washlands, North Yorkshire, UK (Fig. 1a). At this location a high-quality resource is considered to be 40% sand and 60% gravel. Poorer quality pockets of coarser or silty material are considered lower value.
Seismic refraction tomography, multichannel analysis of surface waves (MASW) and resistivity profiling are complimentary techniques that measure different properties of the subsurface: P-wave velocity (Vp), S-wave velocity (Vs) and resistivity ( ), respectively (Reynolds 1997). Standard geophysical methodologies treat these parameters individually, with the interpretation of lithology often undertaken qualitatively by the geophysicist.
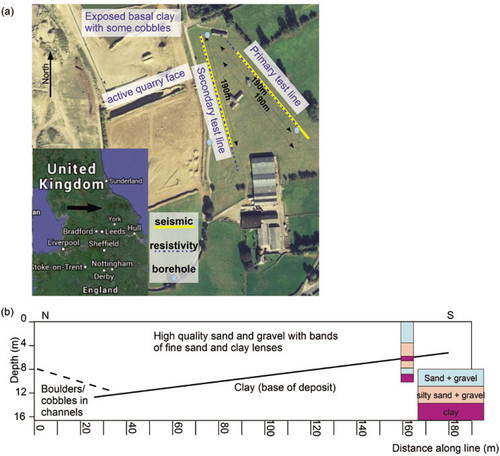
a) Location and overview map of the site. Google Maps (2010) showing locations of seismic and resistivity lines. b) Geological cross-section along the primary line.
The three techniques have different limitations that affect the degree of interpretation that can be made of their results. Refraction tomography is able to resolve vertical and lateral P-wave velocity gradients but cannot detect velocity inversion or very thin layers (Turesson 2007). MASW can detect velocity inversions and lateral changes in Vs, though it can create a smoothed result in 2D (e.g., Turesson 2007; Ivanov et al. 2009). Electrical resistivity tomography is good at detecting lateral and vertical variations in resisitivity though resolution is limited by the array type and the inversion is susceptible to equivalence and sharp boundaries can be smoothed (Reynolds 1997).
Work by Doetsch et al. (2010) showed how different complimentary geophysical techniques can be used to constrain an inversion using petrophysical relationships derived from the data. We use petrophysical work on rock properties (e.g., Mavko et al. 1998; Doetsch et al. 2010) to obtain relationships between the electrical and elastic parameters. Near-surface material can be heterogeneous, highly attenuating and show great variation in P- and S-wave velocities. Work on unconsolidated deposits (e.g., Brocher 2005) has shown that petrophysical techniques can aid the discrimination of second-order features such as porosity and clay content.
Work has been done on joint inversion of parameters using cross-gradient constraints, (e.g., Gallardo and Meju 2004) giving better structural agreement between models than independent inversion. This shows the benefit of integrating the processing and analysis of these techniques.
When inverting geophysical observations, such as seismic refraction traveltimes, a good initial model will aid convergence to a global minimum and reduce the chance of the inversion resulting in a local minimum or divergence (Gubbins 2004). Cardielli and Fischanger (2006) found constraining resistivity inversions to reference models better recovered complex geology. Initial models are typically based on either a priori knowledge of the geology or on data driven assumptions. A third method, investigated in this paper, is to produce a synthetic model of one property based on the known values of another. (e.g., Catt et al. 2009)
This paper aims to assess the extent to which guided inversion and correlation of geophysical parameters can improve a ground model of a sand and gravel resource. The primary objective is to map the extent, distribution and quality of an aggregate resource. The second objective is to analyse the techniques, jointly, using petrophysical relationships to distinguish material of different quality. The final objective is to integrate these relationships in a guided inversion.
GEOLOGICAL BACKGROUND
The superficial geology of the Swale-Ure Washlands, Yorkshire, UK, has been significantly influenced by the ice sheet that covered much of the British Isles during the Quaternary (Long et al. 2004). As the ice retreated northwards around 19 000 years ago, it laid down glacial clay or till. Extensive fluvial-glacial sand and gravel deposits were laid down on top of this till by rivers carrying sediment in the glacial meltwater (Long et al. 2004). The large volumes of water that were released by the valley glaciers created high-energy rivers capable of carrying much more sediment than those of today. This load included large cobbles (>62 mm) and boulders (>200 mm), which would have travelled a relatively short distance from the glacier front as well as finer sand and gravel (0.06–63 mm) that were carried further.
The resource at the Scorton site (Fig. 1a) is high-quality, fluvio-glacial sand and gravel. The high-energy glacial outwash explains the heterogeneity of the deposit through the site that, according to quarry records, ranges from silty sands with 20% gravel through to areas with up to 60% gravel. As of summer 2010 some pockets of sandy and silty material were visible in the active quarry face. Clay lenses, metres in extent, have also been reported. The base of the deposit is considered by the quarry to be a Quaternary glacial till, which varies from surface level to a depth of more than 15 m across the site due to the complex deposition of sediment and cutting of fluvial channels. Some deep channels have been found that contain cobbles and boulders, parts of which are too large to be considered a resource. Differentiation between economic resource and coarser or finer material was an important driving force for the present work.
Boreholes, up to 18 m deep and spaced at approximately 200 m intervals (Fig. 1a,b), have been relatively successful at defining the depth to basal clay but there are economically important local variations that are not captured by the borehole spacing. Furthermore none of the boreholes has been able to identify any areas likely to contain cobbles as cable percussion drilling and flight auger drilling cannot penetrate the boulder and cobble layer while reverse circulation drilling crushes any larger material to sand.
The sand and gravel forms an unconfined aquifer with the water table at a depth of 9–10 m, from quarry logs. The basal clay is believed to be an aquitard and, as such, play a significant role in controlling the flow and extent of the aquifer. A geological cross-section formed from this geological and borehole information is shown in Fig. 1(b).
The challenging nature of the site means no single geophysical technique can reliably characterize all the necessary features of the deposit. It is thus a good location to assess the ability of integrated analysis to define the quality of the deposit either by direct measurement, such as a change in a physical property, or by mapping known geological indicators, such as channels in the clay.
DATA ACQUISITION AND PROCESSING
The data were acquired on agricultural land adjacent to the existing Scorton sand and gravel quarry (Fig. 1a). Seismic data were measured using ninety-six 10 Hz vertical geophones at 2 m spacing and an accelerated weight drop source spaced every 4 m totalling 66 shots including offset shots. In order to acquire refraction first breaks and full Rayleigh surface wave signals on the same record across the 190 m spread, the sample interval was set at  with a 1 s record length. Two off-end shots were acquired with 25 m offset from the nearest receiver. The resistivity lines were acquired using a Wenner configuration on 48 electrodes at 2 m spacing moved along in half spread roll-ons allowing an order of 15 m depth penetration and line lengths of 190 m and 238 m. The acquisition configuration is shown in Fig. 1(a) with the two test lines and borehole control highlighted. In all section displays below, the primary line is shown. For the cross-plots, the data from both lines were included.
In order to assess the effectiveness of combined analysis, the three methods were first processed separately using standard techniques constrained by knowledge of the background geology, borehole data and quarry extraction records. For the seismic data the inversions were run first with the values picked, then re-run plus and minus estimated errors. This is a rather harsh method of propagating errors in a non-linear inversion, compared to more robust probabilistic inversion methods. Within the time limits and scope of the work this was deemed a reasonable estimate of the model error.
Seismic refraction analysis
The refraction first breaks were picked and 1178 reciprocity checks were carried out on all possible shot-receiver pairs with erroneous values re-picked. The mean error was 0.07 ms with a standard deviation of 1.5 ms. An example shot is shown in Fig. 2(a) with the first breaks identified. On visual inspection of the traveltime versus distance plots (Fig. 2b) up to four layers were recognized on the longest offset data, identified on the figure. The first arrival times were inverted using the time depth method (Palmer 1980), which was converted into a starting model for later seismic tomographic analysis. A 15 layer 2 m grid was set up and the data were inverted using the tomograph-ic method of Zhang and Toksoz (1998), where the velocities were allowed to vary from 300-3000 m/s with 3 nodes per cell edge. The fastest gradient identified in the traveltime picks was 2400 m/s and a margin of 600 m/s allowed all reasonable velocities to be modelled in the tomography. A horizontal, three point smoothing filter of weighting 1:2:1 was applied to reduce the influence of spurious points. A vertical filter was not applied, so as to prevent smearing of refractors. First break picking errors were estimated at ±1.5 ms and, the tomography was re-run twice, with first break picks plus and then minus 1.5 ms to estimate the possible error in the velocity and depth of the result.
A layered case is present, as seen in Fig. 3(a). The top layer has a velocity of 300-400 m/s (±50) from ground level to 2-4 m (±0.5) depth followed by a layer of 600-800 m/s (±50) down to depths of 6-9 m (±0.5) where there is a steep velocity gradient. Below this gradient, the velocity jumps to 1800-2000 m/s (±50). The 2000 m/s contour is the maximum contour and varies from 15-10 m (±2) depth.
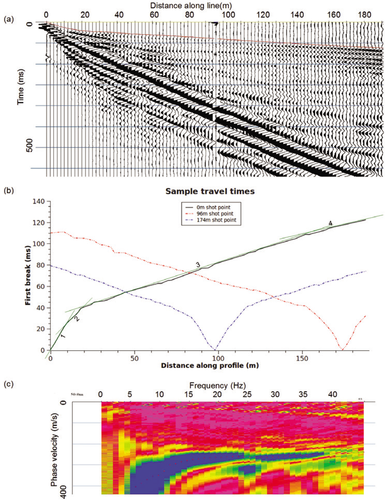
a) Shot record at 0 m along the profile (first breaks in red). b) Sample traveltimes at three locations along the line (example layers shown in green). c) Dispersion curve with picks at the midpoint at 50 m along the profile with some contribution from Fig. 2(a).
Surface wave analysis
Surface waves have the property of velocity dispersion when travelling through multilayered media whereby different frequencies propagate at varying velocities. The longer the wavelength of the surface wave, the greater the depth at which it samples. As a rule of thumb, Rayleigh surface waves, which are measured here with vertical component geophones, are predominantly dependent on the S-wave velocity at a depth of about a 1/3 of their wavelength (Socco and Strobia 2004).
Strong dispersion developed in the shot records by 8–10 m offset with a poor signal-to-noise ratio beyond 100 m. The receiver spacing was 2 m. Those traces with offsets of 10–100 m were sorted into common midpoint gathers. The 1 s record length was sufficient to record the full surface wave record over this range, as seen in Fig. 2(a). These were formed by assuming that the signal recorded at a geophone samples the earth between source and receiver and is thus most representative of the midpoint. Traces from different shots are gathered by their midpoint location creating 1D profiles at regular spacing down the line. Each of these common midpoints was transformed into the frequency-phase velocity domain and the fundamental mode of their surface wave dispersion curve was picked (Fig. 2c). The geophones were specified at 10 Hz, though examination of the frequency-phase velocity curves showed a good signal at lower frequencies, so 8–40 Hz was used as the processing bandwidth. Although the geophone amplitude response is non-linear with frequency below 10 Hz, dispersion curve picks can still be made from the relative amplitude for a given frequency. A Vs starting model was formed assuming that at a depth of 1/3 wavelength, Vs is approximately the phase velocity at that frequency. For the above acquisition and processing parameters, this assumption means phase velocities at depths of approximately 3–13 m were sampled. The surface waves were then inverted using the multichannel analysis of surface waves non-linear least squares technique developed by Park et al. (1999). The RMS misfit over the 2D section was 2.8%. The picking errors were estimated at ±10 m/s from the dispersion curves and the inversion re-run with these errors added and subtracted to the input data to estimate the errors in Vs and depth.
The results are shown in Fig. 3(b) for the primary test line where the RMS misfit over the 2D section is 2.4%. There is a slow layer of  m/s with little heterogeneity, which extends to 13±2 m depth at the northern end to 5±1 m depth at the southern end. Below is a layer of approximately 5 m thickness that has a steadily increasing velocity from 300–1-00±15 m/s with depth. Below this, the velocities increase more slowly from 400–460±15 m/s from 18–28±2 m depth at 5–140±8 m along the profile. This is deeper than expected from the initial model and most of the contribution would come from the lowest frequencies that have the broadest, hardest to pick peaks on the dispersion curves. At 140±8 m along the profile, this higher velocity layer appears to terminate and the velocity field varies more slowly to the south, from 400–440±15 m/s.
Resistivity analysis
The apparent resistivities, acquired at Wenner electrode spacings of 2–32 m along the profiles, were inverted using an 12-norm, smoothness-constrained least squares inversion method (Reynolds 1997; Loke et al. 2003). The results are shown in Fig. 3(c). Errors were estimated by examining the maximum and minimum resistivity values at the limits of the model uncertainty. At the near-surface there is a 1.5±0.5 m thick layer of 100-300±20  overlying a highly resistive (>400
  ) layer varying from 5-7±0.5 m thickness. Below this, the resistivity drops rapidly to <225±20
  though uncertainty cross-sections imply this region and depth are the worst resolved parts of the model. The highly resistive layer is not homogeneous as there are a number of low-resistivity features, flanked by highly resistive features. The sensitivity of the model decreases with depth: at 4 m depth and 8 m depth, sensitivity is roughly 1/5 and 1/25, respectively of that at 0.5 m depth.
INTERPRETATION OF SEPARATELY PROCESSED DATA
With the aid of borehole control, the above results were interpreted as shown in Fig. 3(d). The first layer is interpreted as the soil layer with a Vp of 300–500±50 m/s, a Vs of 260–320±15 m/s and a resistivity of 150–150±20  . The second layer is interpreted as dry sand and gravel. It has a fairly constant Vp across the profile while the resistivity and S-wave velocity vary along the line, interpreted as an increase in sand and silt content in the deposit to the south. The water table, expected at 10 m depth from borehole logs, appears to vary from 12±0.5 m depth in the north to 10±0.5 m depth in the south in some agreement with the interpreted clay layer from the borehole control. The feature labelled A (Fig. 3) occurs at the same point as a very low-resistivity surface feature and may, if it is a genuine geophysical anomaly, represent a velocity inversion. Velocity inversions are not detectable by refraction (Reynolds 1997). There are possible clay and silt lenses as indicated by, for example, label B (Fig. 3) with anomalously high Vp and low resistivity. There is strong evidence for shallow basal clay in the resistivity section in the form of very low
  ) patches, marked C in Fig. 3. This interpretation is in agreement as to the depth to basal clay with the borehole at 170 m. The Vs trend is in general agreement with that expected from the geological cross- section in Fig. 1(b). Also on this plot there is indication of a layer with a high velocity at approximately 10 m depth at 180 m along the line, which may indicate a shallow clay lens, which would agree with the thin clay layer in the borehole. In summary, the independent interpretation of the individual data sets distinguished layers in the sand and gravel; found low-resistivity clay lenses in the unsaturated zone; estimated the location of basal clay and the water table. There is also lateral variation within the layers attributed to relative changes in silt content. The inherent limitations of each technique, however, meant that the detailed distribution of material in the deposit remained unresolved.
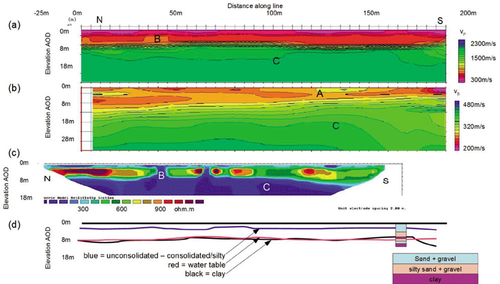
Separately processed results of a) refraction tomography, b) surface wave inversion, c) resistivity inversion and d) interpretation. All plots are to the same scale with a common x-axis. Features are labelled.
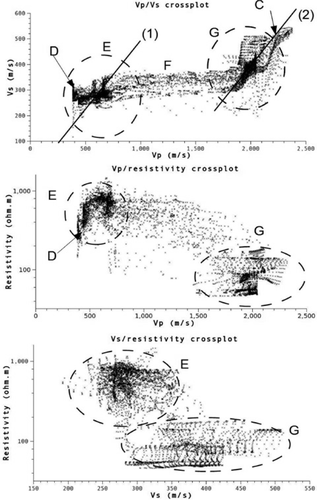
Crossplots of a) Vp : Vs, b) Vp : resistivity and c) Vs : resistivity for both test lines. Explanation of the annotations in the text.
CORRELATION BETWEEN GEOPHYSICAL PARAMETERS
The independent results can be assessed in an integrated manner by assessing correlation between parameters. Crossplots allow relationships and trends between geophysical properties to be measured, such as Castagna’s mudline relationship between Vp and Vs and the Archie-Wiley time average method between Vp and resistivity (Mavko et al. 1998). Vp/Vs ratio cross-section plots can illustrate where a resource shows locally variation from predicted relationships.
In order to be jointly assessed, the inverted models (Vp, Vs and  ) must first be interpolated onto a common grid. The data from both lines were gridded and interpolated using a common minimum curvature grid, regularly spaced at 2 m horizontally and 0.5 m in depth. A linear spline was chosen in preference to a cubic to minimize artefacts across the water table.
The three different geophysical techniques invert for three independent models of the subsurface. Each technique has quite different resolution and depth penetration limitations, discussed in the separate processing above. Gridding and comparing these data leads to poor correlation in some areas, which will lead to artefacts and scatter in the crossplots.
Crossplots
 (1)
(1) (2)
(2)above and below the water table respectively.
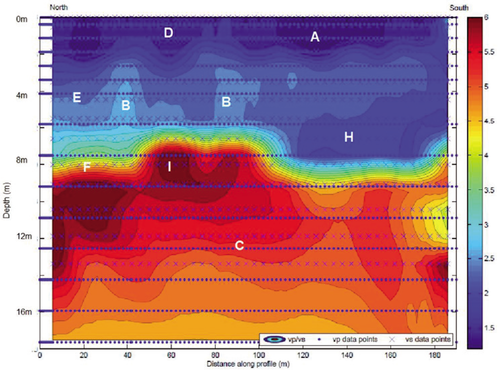
Vp : Vs plot of the seismic data. Data points are shown. Key features are marked. Explanation of the annotations in the text.
Figure 4(b) plots Vp versus resistivity ( ) and shows a general trend of decreasing resistivity with increasing P-wave velocity. There is a grouping of points at either end of the range: region G has low resistivity
  ) with high velocity (> 1500 m/s) while E has low velocity (< 800 m/s) with relatively high resistivity
  ). Region E is interpreted as the highly resistive, unsaturated sand and gravel layer. G is identified as the fully saturated deposit and clay layers. D may be the near-surface, less resistive soil layer but further interpretation is hampered by the effects of gridding the data: evident as vertical striping.
Figure 4(c) plots Vs versus resistivity. There is once again an increased density of data points with a low velocity (Vs <350 m/s), high resistivity  ) group labelled E and a medium-high velocity (330-520 m/s) with medium-low resistivity
  ) G. E is interpreted as the unsaturated deposit while G is interpreted as the saturated deposit. There are again significant gridding effects attributed to the poorer depth penetration of the resistivity technique and also the poor lateral resolution of the surface wave technique at depth.
Despite the scatter and resolution effects in the crossplots it was felt the correlation between parameters reduces inversion ambiguity and aids interpretation.
Vp/Vs ratio
Brocher (2005) compiled numerous borehole seismic measurements in California and suggested that the Vp/Vs ratio varies with alluvium type, from 10 for artificial fill to 1.4 for coarse-grained alluvium. While the depth of these measurements were generally deeper than that studied here, different lithologies were indicated by changes in Vp/Vs. Near-surface, poorly compacted soils typically have Vp/Vs ratios between 2–4. A large change is caused by increased saturation, which significantly increases the propagation velocity of P-waves but not S-waves, increasing Vp/Vs up to 10.
The Vp/Vs ratio was calculated on a node by node basis across the grid and the results are shown in Fig. 5. There is a sharp change in ratio from 3 to 5 at a depth of 6–8±0.5 m, annotated F and a second layer (Vp/Vs 1.5–2) at a depth of 2–3±0.5 m, which has some anomalously low values (<1) at A. There is some lateral variation in the deposit, namely two fingers of high Vp/Vs ratio at B and an anomalously low-ratio region at H. There is further lateral variation with the high-ratio region (Vp/Vs > 5) at I appearing shallower than the rest of the line.
The area above the sharp contours at 6–8±0.5 m depth is interpreted as unsaturated sand and gravel with further separation into unconsolidated soil and sand and gravel above 2–3±0.5 m depth (D) and consolidated/silty sand and gravel below (E). The unrealistically low values (~1.2) at A are attributed to the relatively low resolution of the surface waves at high frequency (depth penetration ~λ/3 i.e., 2 m at around 35 Hz). The ‘fingers’ at B could also be anomalies, however they occur at the same location as events seen in the resistivity profiles in Fig. 3(c) so may be clay lenses with a higher Vp/Vs ratio than sand. H is interpreted as coarser material in a channel as implied by its low Vp/Vs ratio. I is attributed to a lens of clay possibly causing a perched water table.
GUIDED RESISTIVITY INVERSION
Correlation analysis can be used to help constrain the separate inversions by creating an a priori synthetic model of one property based on the known values of another. The success of this approach will be assessed and compared to independent processing of the three techniques of refraction tomography, multichannel analysis of surface waves and resistivity.
Two ways of constraining the inversion are assessed.
One method is to add seismic-defined boundaries to resistivity inversion, permitting an abrupt resistivity contrast across them. Fixed boundaries can lead to erratically varying resistivity values if the seismic and resistivity data are not compatible. Here, the water table and clay layers were extracted from the seismic refraction time term inversion and inserted into the resistivity data (shown as black lines on Fig. 6).
In the second method, the resistivity of blocks in the initial model are defined, following the methodology described in Catt et al. (2009), where the size and resistivity of the blocks can be revised by the subsequent inversion. Here, the blocks were defined by estimating a layered model from the results of the standard processing and inserted into the resistivity data as shown in Table 1.
These a priori models, shown in Table 1, were then inverted with standard tomographic processing. The final sections along with the goodness of fits are shown in Fig. 6.
Model (c) has a marginally higher RMS error, while (b), (d), (e) and (f) have a slightly lower RMS error than the blind inversion. Inversions with the seismic line boundaries as constraints result in a jagged appearance at edges (labelled H in Fig. 6). All the revised initial models sharpen the highly resistive layer and bring out features in the medium resistivity layer (labelled E). Models (d) and (e) show a medium resistivity feature,  , while (b), (c), (e) and (f) have a high-resistivity feature,
  . There is a general agreement in all models that the high- resistivity layer becomes less resistive along the profile, from over 1000 Ωm at the southern end to 300-700 Ωm at the northern end.
Models (d) and (e) have the most geologically realistic final sections. Model (b) shows a highly resistive area, labelled  , where the deposit is expected to be saturated, while the seismic boundary in models (c) and (f) appear to distort the vadose zone, making it jagged. All models show a distinct bowing in the bottom of the vadose zone from 8–9 m depth at the edges to 4–5 m depth in the centre. This is in agreement with the perched water table interpreted from the Vp/Vs plot (Fig. 5, H) from approximately 40–100 m along the line and 8–10 m depth. This is further supported by the presence of very low-resistivity bodies
  ) in this region. Models (e) and (f) appear to have sharpened the edges of the clay lenses in the dry gravel layer and both suggest a feature (labelled
  ) in the vadose zone. All models show a lowering of resistivity in the unsaturated layer towards the south of the line supporting the interpretation of increased silt content from the increased Vs in the surface wave results (Fig. 3b). Generally there is very little change in the position of the horizontal boundaries, indicating that all starting models converge towards the same structure. Lateral changes in resistivity have been more sharply resolved by the use of starting models derived from crossplot analysis.
DISCUSSION
The results from the above processing can be combined into a subsurface model, shown in Fig. 7(b), which describes the interpreted distribution of lithology. Since the processing was completed, the sand and gravel resource under the geophysical profiles has been fully extracted down to basal clay. This provides an opportunity to assess the extent to which guided inversion and correlation of geophysical parameters on combined geophysical data can improve our understanding of a sand and gravel resource.
From extraction records the top layer consisted of 6–7 m of good quality sand and gravel with localized bands on fine sand. Below this upper sand and gravel, a laterally extensive band of clay of 0.2–2 m thickness at 6–7 m depth was found. This clay layer forms the upper boundary to a layer of coarse material including cobbles (>62 mm), boulders (>200 mm) and large rocks. Towards the south there is increased sand content and there is also some increase in sand content near the basal clay. The basal clay, representing the base of the deposit, was found at 14-15 m. A more detailed record of deposit variation was not recorded over the extraction period. This record is summarized in the lithological cross-section in Fig. 7(c).
| Starting model | Boundaries used in inversion | Inversion RMS error |
|---|---|---|
| (a) Blind - as in independent analysis above | None | 1.7% |
| (b) Blind - as in independent analysis above | two seismic layers: ‘water table’ and layer 4 | 1.3% |
| (c) Blind - as in independent analysis above | one seismic layer: ‘water table’ | 2.2% |
| (d) ‘dry gravel’ block | None | 1.0% |
2-5.0 m depth, 800  |
||
| (e) ‘dry gravel’ and | None | 1.0% |
| ‘saturated gravel’ blocks | ||
2-5.0 m depth, 800  |
||
8-11 m, 100  |
||
| (f) ‘dry gravel’ block | one seismic layer: ‘water table’ | 1.0% |
2-5.0 m depth, 800  |
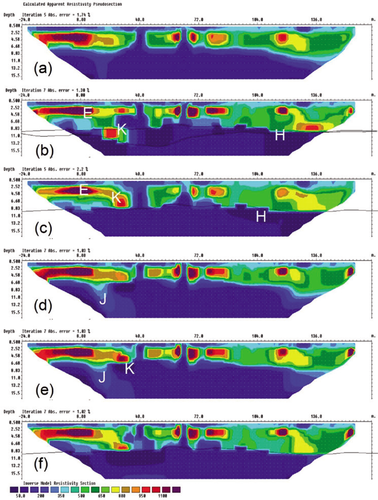
Different resistivity results. Starting models from Table 1. Black line indicates the seismic refractor. Details are labelled.
There is some agreement between the ground model formed from the geophysical data and that uncovered by extraction. The interpreted location of the basal clay was in good agreement with that found at the site though mislocated as it was at the limits of the Wenner array’s resolution. The top 6–7 m were correctly interpreted as good quality sand and gravel. The anomalies identified in the initial interpretation as clay lenses (low Vp/Vs, low resistivity) could relate to the bands of fine sand found on site. The 0.2–2 m band of clay found at 7 m depth, however, was not identified in the interpretation, as this is probably too thin to be detected by refraction or resistivity at 2 m array spacing. The clay lens identified as a perched water table (Fig. 5, H) could, however, be a thick part of this layer. Some coarse material was identified at >8 m depth 100–190 m along the profile, though from extraction it was found to be more laterally extensive. The poor resolution at depth, below the clay layer as well as the inherent inability of refraction to detect velocity inversions may explain the difficulty resolving this layer. Both seismic methods tended to smooth the final model, especially the MASW result further limiting interpretation at depth. Further research into resolution and the extent of smoothing by these methods using synthetic modelling would be beneficial.
The layers detected by the standard inversions were in agreement with the lithological cross section. The further lateral variations interpreted from the integrated inversion were of a scale too small to have been recorded in the quarry logs and thus were not reported.
Comparing the interpretation made from separate processing (Fig. 7a) with that after integrated analysis and processing (Fig. 7b), a more detailed interpretation of the quality and distribution of a sand and gravel resource can be made after the integrated techniques.
CONCLUSION
The primary objective of this study was to map the extent, distribution and quality of a sand and gravel aggregate resource. This was partially achieved by performing a standard geophysical survey using the complementary techniques of refraction seismics, multichannel analysis of surface waves and resistivity. All three methods distinguished unconsolidated sand and gravel from a dry sand and gravel layer. The sharp increase in resistivity and P-wave velocity (Vp) was interpreted as the vadose zone down to the water table. The surface wave inversion showed S-wave velocity increasing steadily with depth representing consolidation. The top of the basal clay was interpreted from the resistivity and surface wave results. Clay lenses were interpreted in the unsaturated deposit from the resistivity section. Thus the dimensions, distribution and quality of the resource have been interpreted with a standard geophysical survey.
The second objective was to analyse the techniques in an integrated manner using petrophysical relationships to distinguish material of different quality. Vp/Vs, Vp/resistivity and Vs/resistivity plots were produced, which were found to discriminate the unconsolidated region; increasing silt content; basal clay; and saturated from unsaturated deposit. Without good geological control, further interpretation was difficult. A 2D plot of the Vp/Vs ratio proved very powerful at distinguishing fine material such as clay and silty sand (Vp/Vs ~ 3) and gravel, from coarse material such as boulders (Vp/Vs ~ 1.5) above the water table. These results show petrophysical methods to be very useful in distinguishing different layers and even detecting second-order properties such as increasing clay or silt content.
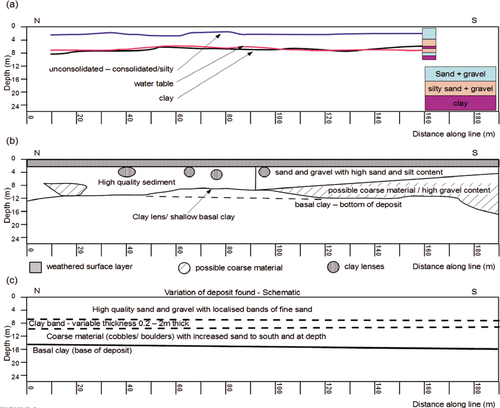
(a) Geological interpretation from separate analysis. (b) Geological interpretation after integrated analysis. (b) Recorded production from extraction notes for the quarry (x-axis does not indicate lateral extent).
The final objective was to use relationships between the techniques in a guided inversion. Some guided inversions were found to improve the resistivity inversions. By adding a priori information about the high-resistivity layer as a starting model but allowing it to vary through the inversion, the definition of the layers and features were sharpened, reducing errors. When fixed seismic layers constrained the inversion they introduced artefacts in to the resulting sections.
The empirical relationships derived from this work are specific to this example but the concept of joint integrated data inversion has been shown to benefit the final interpretation. The vertical layering of the sand and gravel resource was estimated well by interpreting the separate techniques. Lateral variation was detected by integrated analysis with estimates as to the location of clay lenses, coarse material and other features.
ACKNOWLEDGEMENTS
The work presented in this paper was undertaken as part of an MSc in Exploration Geophysics at the University of Leeds and carried out with a NERC Master’s Training Grant (069604B). Tarmac Limited are thanked for providing geological information, permission to perform the work and logistical support. Roger Clark is thanked for reading and improving the manuscript and Phil Murphy, David Cornwell and Jonathan Mound are thanked for their help and advice. A big debt of gratitude goes to Stuart Morrow for helping with the fieldwork. The use of the Matlab, Res2Dinv and SeisImager software packages is acknowledged.


