
Assessment of ground compaction using multi-channel analysis of surface wave data and cone penetration tests
ABSTRACT
The construction of a new industrial and commercial area in 2009 at the Givors’ former glass factory area in France involved heavy dynamic compaction work. For the purpose of founding the new buildings, it was necessary to improve the ground mechanical properties of 7–15 m of well-graded gravel backfill lying on geotechnical bedrock. In order to assess the quality and depth of ground compaction, cone penetration tests are often performed before and after compaction. The method is intrusive and a one-location test. It requires a substantial amount of time to evaluate a large area and evaluation quality is quite dependent on the operation technique and soil type. In this paper, the quality and extent of ground compaction were evaluated using results from the in situ Multi-Channel Analysis of Surface Waves (MASW) seismic method and cone penetration tests (CPT). MASW tests were used to determine shear-wave velocity ( ) profiles before and after compaction and CPT tests were adopted to determine the correlation between
  and the measured penetration resistance (
 ) improvement along profiles. The results of this study show the effectiveness of surface waves for the evaluation of compaction performance and demonstrate the potential of this technique to engineering and environmental problems.
INTRODUCTION
Evaluation of soil geotechnical parameters is a preliminary task to be conducted either for designing building foundations, or for studying site effects in seismic hazard evaluation. Both of these applications show the importance of knowing soil elastic properties, which govern its behaviour in presence of natural or human solicitations. Shear-wave velocity ( ) is usually taken as a good indicator of the elastic behaviour of soils and is classically estimated from cross-hole measurements. In order to avoid destructive and expensive testing, we study here the possibility to estimate the quality and depth of ground compaction using
  distribution with depth obtained by the Multi-Channel Analysis of Surface Waves (MASW) method (Park et al. 1999). This method studies surface wave dispersion i.e., variation of phase velocity (
 ) with frequency (
 ). The technique consists in: 1) data acquisition using a multichannel recording system; 2) dispersion curve picking; 3) inversion of dispersion curve. Surface waves are easy to generate by impact sources or vibrators and are mostly sensitive to shear- wave velocity. The determination of
  profiles from surface waves is attractive since their propagation velocity, i.e., phase velocity, highly depends on the stiffness-depth profile. An important step in the MASW method is to generate a reliable image of dispersion energy in the frequency velocity (f-c) domain. A high-resolution image leads to an accurate picking of dispersion curves and helps to separate fundamental and higher propagation modes of surface waves. Several methods allow to obtain dispersion images such as the F-K transform (Gabriels et al. 1987), tau-p transform (McMechan and Yeldin 1981; Moktar et al. 1988), phase shift method (Park et al. 1998) and linear Radon transform (Luo et al. 2008). Modelling results (Park et al. 1998) show that the resolution of a dispersion image is mainly influenced by the geophone spread length. The resolution increases as the geophone spread increases.
Estimating  variations with depth is tackled as an inverse problem for which the phase velocity variations with frequency constitute the observations. Several inverse methods used in seismology have already been proposed to resolve such a problem. Dorman and Ewing (1962) used surface waves to determine elastic properties of crustal-mantle structures. Engineering problems were tackled in Nazarian and Stokoe (1984) where a hammer was used as an impulsive source for generating Rayleigh waves while ground motions were recorded from two seismic sensors. The dispersion was afterwards derived from the spectrum of recorded vertical motions. Addo and Robertson (1992) also used the same approach and validated the method on six different sites by comparing Spectral Analysis of Surface Wave (SASW) (Nazarian and Stokoe 1984) inverted results and cone penetration test (CPT) data. The evaluation of ground densifica-tion using SASW and resonant column (RC) tests was performed by Kim and Park (1999). Gabriels et al. (1987) and Karray et al. (2010) improved the method by taking into account higher propagation modes of Rayleigh waves and by increasing the distance between the sources and receivers. Xia et al. (1999) proposed an inverse method based on the Levenberg-Marquart technique. Recently, inversion of the full-waveform has been proposed in order to overcome the limitations of the usual approach based on the inversion of a dispersion curve (Forbriger 2003,2003; Romdham et al. 2011.). The Linearized Least-Squares (LLS) technique used for this study is adapted from Hermann (1987) and was already tested in Bitri et al. (1998).

a) Photograph of the dismantled Givors’ former glass factory site, purpose of the dynamic compaction project; b) conceptual 3D view of the new industrial and commercial area. (from Givors Development, by courtesy)
The purpose of this paper is to present and discuss the results of our methodology based on a surface wave method for the assessment of the quality and depth of ground compaction on the studied site.
SITE DESCRIPTION
The project is located on the Givors’ former glass factory area along the Gier river. The site was occupied for over a century by industrial activities. The plant was dismantled recently (Fig. 1a) and the construction of new industrial and commercial buildings is planned (Fig. 1b). For the purpose of building and founding these structures, a ground improvement technique was proposed by engineers to meet the dual problem of soils with low-mechanical properties and environmental issues resulting from a chemical residual impact of former industrial activities on the soil and water. A compaction program was developed in order to improve the backfills overlying sand and gravel deposited by the Gier river. Particle size analysis of five samples taken at 2 m depth and average friction ratio ( ) clarified that the filling material is of sand type. According to geotechnical available reports, the average mechanical characteristics of the backfills are:
  and
and  Mpa where
  is the measured cone resistance obtained during CPT tests,
  the friction ratio obtained during CPT tests and pl* and
  are breaking limit pressures. For the purpose of assessing the quality and depth of the ground compaction procedure, preliminary tests were realized over a 160 × 35 m area (Figs 1 and 2). The positions of the four parallel seismic lines (A, B, C and D) and the five CPTs (B3, B15, C8, D3 and D15) that were performed before and after dynamic compaction on this test area are shown in Fig. 2. The groundwater level is about 6 m below the surface. Initial investigations and geotechnical feasibility studies have recommended pile or micropile foundations, embedded in compact sand and gravel at 12–15 m depth. In fact, deep piles could impact the water resource, blending the superficial polluted soil and water with the deeper ones.

Localization of the 160 x 35 m test area on the dismantled Givors’ former glass factory site. The four parallel seismic lines (A, B, C and D) are highlighted in red solid lines and the five CPTs (B3, B15, C8, D3 and D15) are marked using black circles. (Adapted from Brûlé et al. 2010)
DYNAMIC COMPACTION
Dynamic compaction is a cost attractive ground improvement technique for brownsites especially when thick, heterogeneous and polluted backfills have to be densified.
‘High Energy’ Dynamic Compaction (HDCTM) work was performed in 2009 at the Givors’ former glass factory area in France. For the purpose of founding the new buildings, the objective was to improve the ground mechanical properties of 7–15 m of well-graded gravel backfills laying on geotechnical bedrock composed of sediments of the Gier river.
For granular soils, dynamic compaction tends towards an improved soil with more homogeneous properties than initially. Therefore, for this 85 000 m2 building project, the heavy compaction work increased the density of the ground by means of energy applied by ponder (m = 27 000 Kg) free-dropped on the soil surface from various heights (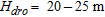 ) with a square print grid (Fig. 3). It led to a large-scale ground improvement.
The energy brought at each drop is more than 4000 kJ and the velocity of the ponder impacting the soil is about 20–25 m/s. Ponder drops create compaction craters (Fig. 3) that are filled using the same material before being compacted again. This way, there is no change in the lithology. At the final stage of compaction, the elevation of the area is globally changed by about a –50 to –80 cm downwards vertical translation. In the rest of the study, we assume that this difference in elevation can be considered negligible.
SHEAR-WAVE  PROFILING
MASW is an effective tool for obtaining vertical shear-wave profiles from a single non-invasive measurement. The method was developed by the Kansas Geological Survey and can be used with active or passive sources (Song et al. 1989; Xia et al. 1999; Park et al. 1999; Park et al. 2007).
Numerical relationships between soil mechanical properties and  have been previously published. One of these relationships, which is given by the elastic theory and is an essential property for evaluating dynamic responses and the stiffness of soil, is the small-strain shear modulus,
 is a valuable indicator of the dynamic properties of soil and rock because of its relation with
  , given by the equation
  , where soil density
  is the total unit weight of the soil divided by gravity.
  has units force per length squared (i.e., kPa). This relation demonstrates the good correlation of
  to soil mechanical properties, which are improved during compaction stages and allow for the expectation of a
  increase after ground compaction.
The MASW method is based on dispersive characteristics of surface waves. The accepted rule of thumb for the maximum penetration depth in dispersive media is approximately half the longest wavelength. In layered media, the velocity propagation of surface waves depends on the frequency (or wavelength) of the wave because waves of different wavelengths sample different parts of the layered medium. For example, high-frequency (short wavelength) waves propagate only in near-surface layers.

a) Schematic representation of the ‘High Energy’ dynamic compaction (HDCTM) procedure; b) photograph of a 27 000 Kg ponder free-dropped on the soil surface.
Low-frequency waves with longer wavelengths propagate through the near-surface layers and also deeper layers. Therefore, by using surface waves over a wide range of frequencies, one can effectively sample different portions of the material profile (Richart et al. 1970).
 reference models before compaction were established in September 2009 along four linear parallel lines (A, B, C and D) on the test area (Fig. 2). The second surface wave investigations were carried out at the end of October 2009, after heavy dynamic compaction on the same lines in order to assess the effect of compaction.
To increase the speed and efficiency of data recording and thereby keep acquisition costs down, a multichannel seismic cable was designed and manufactured. It consists in 24 geophones at fixed 2 m intervals. Each geophone is attached to a single self-orientating, gimbals-mounted, vertical geophone with 10 Hz central frequency. To help ensure proper coupling, each gimbal geophone is housed in a heavy casing (~1 kg). To damp the motion of the sensor around its rotational axis, the inside of the casing is filled with viscous oil. The seismic cable is towed behind a vehicle. A 24-channel Geometrics Stratavizor seismograph was used to record impacts of a 10 kg hammer seismic source. The source-to-nearest-receiver offset was 4 m, whilst the increment between source locations along the seismic lines was 10 m. The general configuration of receivers and sources in the MASW test is shown in Fig. 4. The record length was selected as 1024 ms at 1 ms sample intervals.
 (1)
(1)where  is the phase velocity,
  is the number of traces in the shot gather,
  is the amplitude spectrum of the first trace,
  is the amplitude spectrum of the trace at distance
  and
and  is its phase spectrum. The dispersion curve is obtained by picking the maximal values of the
  modulus. If the seismic signal in the shot gather consists in single noise free surface wave mode, the maximum value of the
  modulus should be equal to
  . If this value is smoother then
  , than we can attribute this to an error in the phase velocity between the traces in the shot gather (Hermann 1987).

MASW test field configuration.

Typical seismic shot gathers of line C before (a) and after (b) compaction, with the related dispersion f-c images. The reference fundamental mode before compaction overlays both f-c images in black solid lines. Here we observe the  shift for high frequencies (from 15 Hz) between fundamental modes before and after dynamic compaction.

Depth-c converted dispersion curves used as initial models before and after dynamic compaction obtained along the seismic lines A, B, C and D. The mean resolution factor of dispersion curves picking overlays the plot in red solid lines. We observe the increased  (around 40 m/s) from 0–8 m depth after dynamic compaction.
O’Neill (2003) evaluated, by numerical and field repeatability testing, the error envelopes of dispersion curves determined using equation (1). The observation was a large increase in the phase velocity standard deviation at low frequency, often exceeding 30%, although at the highest frequencies it is 1% or less. In order to qualitatively assess the reliability of the data, a resolution factor of picking is computed considering the balanced inverse velocity standard deviation in the dispersion patterns according to the frequency, as described by O’Neill (2003).
Typical seismic shot gathers before and after dynamic compaction, with the related dispersion f-c images showing the fundamental mode, are presented in Fig. 5(a,b). One can see here the  for high frequencies (from 15 Hz) after dynamic compaction. The initial models for the inversion process of dispersion curves were obtained by converting f-c curves and the resolution factor as a function of the frequency in the depth-velocity domain (depth-c) using the empirical relation of a half wavelength described by Xia et al. (1999). Figure 6 shows the initial models obtained before and after dynamic compaction using this relation and the mean resolution factor of dispersion curves picking. On this figure we observe increased
  (around 40 m/s) from 0–8 m depth after dynamic compaction. Below 8 m depth,
  appears to be more or less unchanged. The mean resolution factor shows that the picking accuracy of the dispersion curves decreases with depth. According to this observation, a lower confidence is given to estimated velocities at high depths.
Each dispersion curve was then individually inverted into a 1D depth/ profile. A 2D matrix of
  was produced by gathering all 1D
  profiles into sequential order according to the surface coordinate at the midpoint of the spread, the common procedure described by Park (2005). Ten iterations for inverting velocities and ten more for inverting layers thickness were necessary to converge to the final model. This allowed a root mean square error between the measured and calculated dispersion curves less than 5%. The LLS inversion technique used for this study is adapted from Hermann (1987).
CONE PENETRATION TEST
As described in Lunne et al. (1997), in the CPT, a cone on the end of a series of rods is pushed into the ground at a constant rate and continuous or intermittent measurements are made of the resistance to penetration of the cone. Measurements are also made of either the combined resistance to penetration of the cone and outer surface of a sleeve or the resistance of a surface sleeve. The total force acting on the cone,  , divided by the projected area of the con,
  , produces the measured cone resistance,
  .
.
Early applications of CPT mainly determined the soil geotechnical property of bearing capacity. The original cone penetrometers involved simple mechanical measurements of the total penetration resistance of pushing a tool with a conical tip into the soil. Different methods were employed to separate the total measured resistance into components generated by the conical tip and friction generated by the rod string. In the 1960s, a friction sleeve was added to quantify this component of the friction and aid in determining soil cohesive strength (Begemann 1965). Electronic measurements began in 1948 and improved further in the early 1970s (De Reister 1971). Most modern electronic CPT cones now also employ a pressure transducer with a filter to gather pore water pressure data. CPT testing, which also gathers these piezometer data, is called CPTU testing. CPT and CPTU testing equipment generally advances the cone using hydraulic rams mounted on either a heavily ballasted vehicle or using screwed-in anchors as a counter-force. One advantage of CPT over the Standard Penetration Test (SPT) is a more continuous profile of soil parameters, with CPTU data recorded typically at 2 cm intervals. CPT for geotechnical applications was standardized in 1986 by ASTM Standard D 3441 (ASTM 2004).

 soundings obtained at the points B3, B15, C8, D3 and D15 before and after dynamic compaction. Underlined items correspond to
  soundings for which
  profiles are shown in Fig. 8. Here we observe an increased
  (2–9 MPa) for almost all soundings from 0 to 8–10 m depth after dynamic compaction. Let us note that points B3 and D15 highlight slices between 4–6 m depth with no difference between
  before and after dynamic compaction.
The  reference soundings before compaction were established in September 2009 at five points (B3, B15, C8, D3 and D15) on the test area (Fig. 2). The second CPTs were carried out at the end of October 2009, after heavy dynamic compaction at the same points in order to assess the effect of compaction. Figure 7 shows the
  soundings obtained before and after dynamic compaction. On this figure we observe the increased
  (2–9 MPa) for almost all soundings from 0 to 8–10 m depth after dynamic compaction. Below these depths,
  seems to be unchanged.
DATA ANALYSIS
Inverted  profiles at the points B3, C8 and D15 before and after dynamic compaction are shown on Fig. 8. This figure indicates that
  increased for about 10–80 m/s at a depth of 1–8 m. The B3 profile shows that
  at the 4–6 m depth slice did not increase as already observed on the B3
  sounding. In general, we can observe consistency in the shape and maximum depth of increased
  and
and  before and after dynamic compaction at the points B3, C8 and D15, which provides a consistency check of
  sensibility to improved mechanical parameters in the near-surface. However
  profiles show a global lack of consistency below 8 m depth. This can be explained by the low resolution of the picking of dispersion curves for low frequencies, which results in
  inconsistencies in depth (Fig. 6). Following this observation, lower confidence is given to estimated
  with depth.

 profiles at the points B3, C8 and D15 before and after dynamic compaction. This figure indicates that
  increased for about 10–40 m/s at a depth of 1–8 m.
In order to assess the quality of ground compaction, the variables  and
and  , corresponding respectively to the difference between inverted
  and
and  after and before compaction, were considered. The relation
  is plotted in Fig. 9.
For many engineering applications, it is common practice to normalize measured  and SPT N-values to a reference effective overburden stress, typically 1 atmosphere (approximately 101 kPa) (Robertson and Wride 1998; Karray et al. 2010; Harutoonian et al. 2012). Several studies have concluded that use of stress-normalized N- or
  - values in
  correlations prove to be considerably less accurate than correlations based on non-normalized values (Sykora and Stokoe 1983; Lodge 1994; Piratheepan 2002; Hasancebi and Ulusay 2007; Wair et al. 2012). Additionally, for the purpose of site classification in accordance with design codes and calculation of
  , it is not appropriate to normalize penetration resistance for overburden stress. For some applications, such as liquefaction triggering assessment, it may be necessary to normalize
  estimates to a reference stress level. In such cases,
  can be estimated from non-normalized penetration resistance and then normalized for overburden.
 was determined as an average value of
  between depths corresponding to the
  layers for profiles B3, C8 and D15 where both
  and
and  values were available. This procedure allowed the extraction of 20 samples used in a linear regression between
  and
and  increases as the representative
  increases, showing an acceptable correlation among variables (
 ). This indicates that the shear-wave velocity determined by the MASW test is a meaningful variable in the evaluation of the quality of layer compaction. Figure 9 shows the linear regression between
  and
and  from which
  can be obtained using the following equation:
 (2)
(2)with a  value of 0.0002 indicating that the regression is statistically significant. Calculating the spatial variation of
  as a function of
  values using equation (2) then becomes possible over entire seismic lines.
RESULTS
 sections obtained using equation (2) along the lines A, B, C and D are shown in Fig. 10. The results indicate that the near-surface, globally less than 5–8 m depth, was homogeneously improved by dynamic compaction according to a
  increase of 4–7 MPa. We observe higher compaction depths (around 10–13 m) between the abscissa 80–120 m on the lines A, B and C that may be interpreted as former channels of the Gier river. Let us note that the maximum compaction depths with the CPTs are consistent with these observed limits. Below, materials were not improved by compaction. This can be explained by the presence of compact sand and gravel constituting the geotechnical bedrock. However, on lines B, C and D, an improved layer (1–4 MPa) is visible from 10–15 m depth in the west part of the test area probably due to the presence of intercalated soft sand.

Relation  increases as the representative
  increases, showing an acceptable correlation among variables (
 ).
).

 sections obtained using equation (2) along the lines A, B, C and D. Maximum compaction depths observed on CPTs are represented using red crosses. The improved near- surface appears in shades of red. The interpreted maximum compaction depths using the 3 MPa threshold overlay the sections in black dotted lines. Black solid lines represent buried improved zones due to intercalated soft sand.

3D view of the interpreted maximum ground compaction depth over the entire test area. Potential routes of a former channel of the Gier river overlay the surface in black dotted lines.
According to these observations, an interpreted maximum compaction depth, assimilated to the top of the bedrock, was extracted using 3 MPa thresholds on  sections and compaction depths from CPTs, highlighted in Fig. 10. In order to assess its variability over the entire test area, interpreted maximum ground compaction depths were then interpolated using the kriging technique (Fig. 11).
CONCLUSION
An evaluation procedure to determine the quality and extent of ground compaction is proposed by effectively combining the results from in situ MASW tests with those from CPT tests. The following conclusions can be drawn: (i) the MASW method, which is rapid and non-intrusive, is an effective tool in assessing the quality and depth of ground improvement by measuring  profiles before and after compaction, (ii) comparison between the MASW and CPTs results, before and after compaction, demonstrates the correlation between
  and
and  (iii) a procedure for estimating the improvement of the ground due to compaction is proposed by combining in situ Vs profiles determined by MASW tests with the linear regression between
  and
and  determined by CPT tests, (iv) results demonstrate the ability of the procedure to accurately delineate near-surface features and detect bedrock. This study demonstrates the potential of surface waves in geotechnical investigations.
ACKNOWLEDGEMENTS
This work was carried out under BRGM financial contribution. The authors thank Ménard France for permission to publish the results. We also thank the Colorado School of Mines for allowing the SU package at geophysicists’ disposal in freeware (Cohen and Stockwell 1997) and R. Herrmann for placing the Computer Program in Seismology free on the web. The authors thank C.B. Park, D. Albarello and an anonymous reviewer for their constructive and detailed reviews.
 ) mapping