Definition of buried archaeological remains with a new 3D visualization technique of a ground-penetrating radar data set in Temple Augustus in Ankara, Turkey
ABSTRACT
The aim of this paper is to image particularly buried archaeological remains with a new technique for 3D display in the Temple of Augustus (Monumentum Ancyranum) relating to the Roman time, around and in Agora in the Ulus district of Ankara, Turkey. 2D ground-penetrating radar (GPR) data were acquired on constant spaced parallel profiles in the study area. After data processing, a 3D data volume was built using a parallel 2D data set. The full data block was divided into sub-data blocks in time. A weak amplitude range was made invisible with zero opaque by applying zero opacity to these values in the visualization. The arranged visible maximum amplitude range was enlarged or the amplitude scale was weighted with a constant coefficient, which was greater than one and smaller than two and had a decimal number, according to the time range. In this way, a transparent 3D image was obtained for determining buried remains according to the depth range. Interactive visualization was carried out by constructing sub-blocks of the transparent 3D volume.
The interactive transparent 3D visualization was provided to identify the archaeological remains on native locations with depth in a 3D volume. Very complex and deep wall structures were visualized with any depth range inside (cella) of the Temple of Augustus and a few very narrow cubic anomalies exceeding 4 m deep were determined at the East side of the temple. An excavation could not be carried out in the cella because of the sensitivity problem of the cella walls. However, excavations in front of the East wall of the temple encouraged the new 3D image results. In addition, a lot of iron clamps connecting wall marble stones were determined on a profile gathered on the East wall.
INTRODUCTION
The ground-penetrating radar (GPR) method has been used successfully for determining buried archaeological remains. Furthermore, detailed imaging has become an important area of interest (Goodman 1994; Daniels 2000; Goodman et al. 2007; Masini et al. 2007, 2008). Generally, parallel 2D profile data are acquired in the archaeological area. 3D data imaging obtained by lining parallel 2D profile data sets is used for slices of time at a constant depth. The locations and the depth of the remains in the study area can be determined with the slices of the 3D data volume. Therefore, the GPR method gives more precise results than other geophysical methods. However, the obtained results and their interpretation can be further improved when the data set is visualized as a volumetric rendering of the remains. Therefore anybody can imagine how that area looked like in the past by looking into the 3D image. Such imaging may be simulated by a transparent half bird’s-eye view into the 3D data volume or its sub-volumes. We attempted to realize this type of imaging by arranging the amplitude scale according to the time range and appointing an opaque interval to the amplitude scale for each time range. We applied this method of visualization on the archaeological remains of the Temple of Augustus in the Ulus district of Ankara, Turkey (Fig. 1). A similar type of visualization was first introduced by Kadioglu (2008), Kadioglu and Daniels (2008) and Daniels et al. (2003) for different purposes.
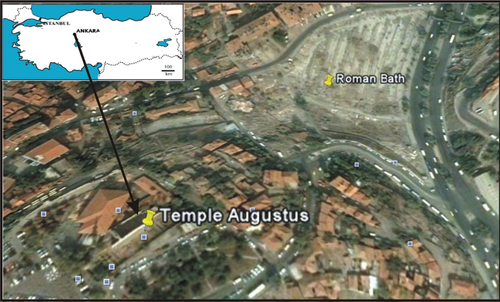
Map of the study site: Temple Augustus in Ulus, Ankara, Turkey.
HISTORY OF THE STUDY SITE
Anatolia, which has always been more a point of transit, a bridge between the West and the East, has been home to ideas moving from all directions. So, it is in the Roman and post-Roman periods the role of Anatolia in general and of Ancyra (the Roman name of Ankara) in particular was of the greatest importance. Ankara, today the capital of the Turkish Republic, has a very long history dating back to at least VIII Century B.C. Its position at the centre of Anatolia made it a key stopping-place on the Persian Royal Great Route. It then became the capital of the Galatians, who established peaceful relations with the Romans, who were gradually occupying Anatolia. Between 20–25 BC, the kingdom of Galatia was annexed to the Roman Empire to form the province of the same name, with Ancyra as its capital (French 2003; www.bilkent.edu.tr/~arkeo). Now, the only visible remains of the Roman period are the Roman Bath, the Gymnasium, the Temple of Augustus of Rome, streets, a theatre and a city defence-wall.
The best known of these monuments is the ‘Temple of Augustus’, which was consecrated to the Emperor Augustus and to the Goddess Rome. All that remains today of the original building known as Monumentum Ancyranum is the pronaos and the lateral walls of the cella (Fig. 2a). The West wall of the cella has been badly holed and they tried to repair it with a dissimilar style to the original wall. This wall has also become unstable due to it leaning away from its foundations. The plan of the temple has a rectangular shape, the axis directed North-West and the main entrance is facing the large square in front of the Haci Bayram Mosque (Fig. 2b). Inside the pronaos, on the intact lateral wall of the cella, there is the Augustan text called the Res Gestae Divi Augusti (The Deeds of the Divine Augustus) in Latin, the most important and famous of the Roman world. The document was cast in two bronze columns in Rome. The bronze columns in Rome are lost. The Temple in Ankara provides the most complete text in both Latin and Greek. After 395, when Christianity became the official religion of the Roman Empire, the temple was converted into a church, an apse and an underground martyrium for displaying relics, being added at the East end (www.gisdevelopment.net; www.anadolumedeniyetlerimuzesi.gov.tr). It appears to have remained in use as a church until 806, when Ancyra fell to the Arabs and its bronze doors were removed for display in Baghdad. Then, in the late 14th or early 15th Century, when the Haci Bayram Mosque was constructed, it was converted into a medrese and apparently continued to function in this way until the 1920s (Cooke 1998; www.bilkent.edu.tr/~arkeo).
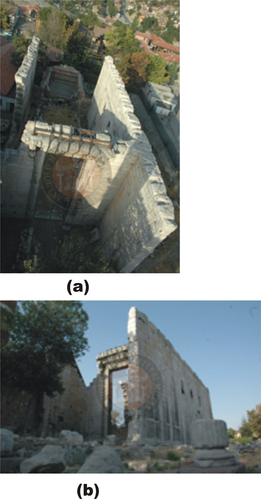
Temple Augustus: a) a view of the entrance (pronoas) and inside (cella) of the temple, b) view of the South-East side (arranged from www.anadolumedeniyetlerimuzesi.gov.tr).
We applied the GPR method to research the buried archaeological remains of the ‘Temple of Augustus’. This was justified as this method is non-invasive for the conservation of architectural and archaeological heritage, effective in the urban area and gives more exact results for locations, depths and shapes of the buried remains, although the entire area is composed of rock groups, iron fence, etc.
DATA ACQUISITION AND PROCESSING
The data measurement site was inside of the temple, cella and the East side (behind the East wall of the cella) of the temple. The plan of the cella is a rectangular shape and its axis directed North-West (Figs 2 and 3). A RAMAC CUII GPR system was used with a 500 MHz centre band frequency shielded antenna to acquire the profile data. In the cella of the Temple of Augustus, the GPR data measurements were carried out on parallel 2D profiles along the South-North direction. The profiles were almost 19 m long and spaced 1 m apart (Fig.3). Each profile had a trace spacing of 5 cm and 512 time samples with a 76 ns time window with 0.1478 ns of time sampling interval per trace. The first profile started behind the pronaos along the East wall in the cella and the last profile was along the West wall next to the Haci Bayram Mosque (Fig. 4). The East side had three echelons and each echelon was very small. Therefore, we gathered the data in three steps called East side–1, East side–2 and East side–3. We used the same antenna and the same data acquisition parameters as those used inside the cella. The East side–1 was 5 m in width and 9 m in length. East side–2 and East side–3 were much smaller than step –1, approximately 6 m in width and 3 m in length (Fig. 5). Finally, we measured the data and conducted a survey with a 800 MHz centre frequency shielded antenna on a profile on the East wall in order to see the iron clamps connecting the wall stones (Fig. 6). There were a lot of cavities in the wall in order to remove iron clamps to be used in unknown wars after the Roman period.
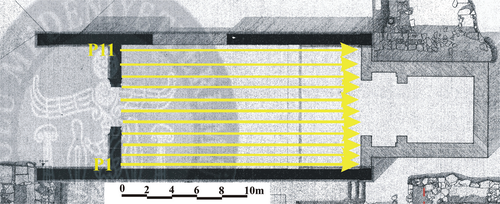
Plan of the temple and GPR profiles in the cella.
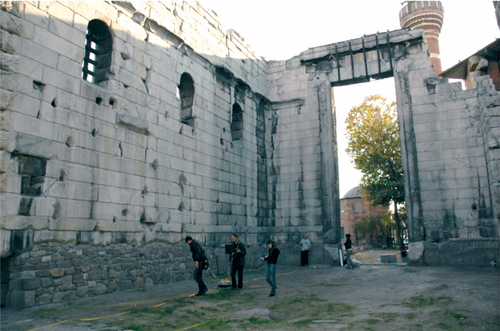
GPR data measurements in the cella.
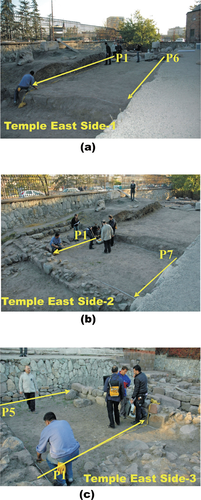
GPR data measurements along the East side (behind the East wall of the cella) called a) East side–1, b) East side–2 and c) East side–3.
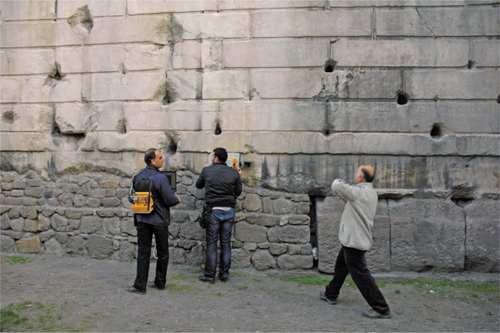
GPR data acquisition on a profile on the East wall of the cella with a 800 MHz shielded antenna.
The GPR data were processed with the REFLEXW version 3.5 program. After arranging the profiles, the start time correction was applied. Dewow and background removals were applied to all the profiles. The amplitude attenuations were balanced by using a linear gain. A second order band-pass Butterworth filter was applied to the whole data set to eliminate low-frequency artefacts and high-frequency noise. The average velocity of the electromagnetic (EM) wave was determined by a velocity analysis of 0.11 m/ns. The REFLEXW program allowed the construction of a synthetic hyperbola to be matched with diffraction patterns throughout the profiles. The best matching hyperbola provided the velocity analysis. The velocity analyses were carried out by different diffraction hyperbolas on the profiles and then, the mean velocity was determined to transform the time scale to the depth scale. Therefore, the velocity was accepted as a constant according to the depth to transform the time scale to the depth scale. Finally, Kirchhoff migration was applied to the radargrams using this velocity. Figure 7 indicates the processed radargrams of the profiles of the cella. A colour scale of the radargrams (on the right-hand side of Fig. 7) indicates the amplitude range, which begins with maximum negative polarity and ends with maximum positive polarity. The blue colour range represents maximum negative amplitude, while the purple colour range represents the positive amplitudes according to their values.
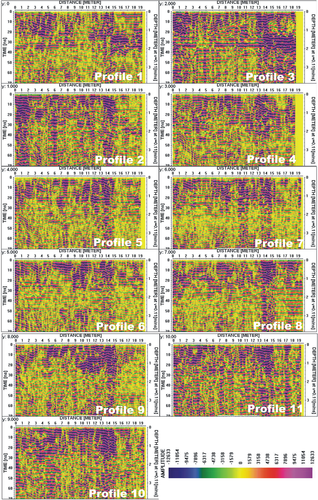
The processed radargrams of the profiles in the cella of the Augustus Temple.
TRANSPARENT HALF BIRD’S EYE VIEW INTO THE 3D DATA VOLUMES
The 3D data block could be imaged as one or some slices including profiles, times (or depths) and common traces of the profiles, or separated into sub-blocks. Generally both slices and subblocks are rendered as solid iso-volumes with linear opacity determined by the amplitude of the anomalies. This opacity is useful when slices, especially time slices, are interpreted. It is known that the maximum positive and maximum negative amplitude ranges in the amplitude-colour scale represent the remains. Therefore, one should check maximum amplitude ranges on the time slices to determine the remains. Figure 8 indicates traditional depth slices at 0.73 m (14.6 ns) and 1.40 m (28 ns) of the data set of the cella. The buried wall group could be seen on the slices. One should check interactive slices to determine location and shapes according to depth carefully.

Depth slices at a) 0.73 m (14.6 ns) and b) 1.40 m (28 ns) of the GPR data set of the cella.
Our aim was to obtain a good 3D data volume display, which was a critical part of interpreting the GPR data set. When viewing the 3D image, someone could have a vision of the buried archaeological remains. This imaging could be supplied by a transparent half bird’s-eye view revealing only buried remains (Kadioglu and Daniels 2008). Transparency could be achieved by constructing an opacity function instead of linear opacity determined by the amplitude scale. The horizontal axis of the opacity function was the amplitude scale starting with maximum negative amplitude and ending with maximum positive amplitude, the vertical axis was appointed opacity coefficients of the determined amplitude range (Kadioglu and Daniels 2008; Kadioglu and Kadioglu 2010). Thus, any amplitude range could be highlighted or minimized by the appointed opacity coefficient. The REFLEXW program could allow the opacity coefficient to be chosen between one (maximum opacity) and zero (transparent). A transparent view could be obtained only by eliminating the unwanted amplitude range to reveal buried wall remains. Therefore, the amplitude range was important. Because it was known that the maximum amplitudes represented the remains, the weak amplitude range was eliminated by giving zero opacity value and transparent 3D imaging was obtained. However, obtaining a transparent 3D view of full time range might be restricted by the amplitude range because of decreasing amplitudes of the remains according to time. Therefore, firstly the full data block should be divided into sub-data blocks in time or depth. While Fig. 9(a) indicates solid 3D sub-data volumes of the cella including first a half metre, Fig. 9(b) represents a transparent view of the same sub-data volume where the opacity function has been activated only for maximum negative and positive amplitude ranges with the opacity coefficient one and eliminated all other amplitudes with the opacity coefficient zero. That was, the opaque function value was one for the blue colour range between (–11585)–(–15446) and for the purple colour range (11585)–(15446) and zero for the other amplitude-colour range seen on the right-hand side of these figures. The horizontal x-axis of the 3D display indicates the distance along the measuring profile. The horizontal y-axis represents the profile sequence. The vertical axis indicates research depths, which were transformed from the time axis, from the surface into the underground. This process was repeated for other sub-data volumes (Figs 9–13).

Interactive 3D sub-volumes of the GPR data of the cella in depth ranges with the same amplitude-colour ranges a) solid 3D sub-volumes between 0–0.5 m and b) transparent 3D sub-volumes of the same depth range, c) solid 3D sub-volumes between 0.5–1 m and d) transparent 3D sub-volumes of the same depth range.
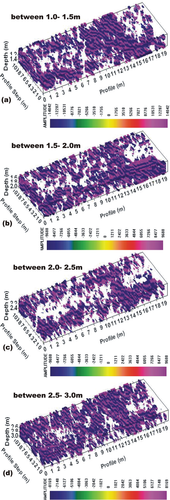
Transparent 3D sub-volumes of the cella starting in 1.0 m depth and ending 3.0 m with 0.5 m depth ranges, respectively.
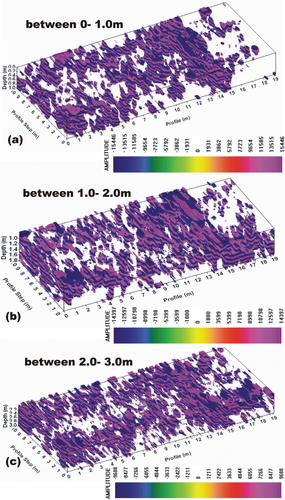
Transparent 3D sub-volumes of the cella starting on the surface and ending 3.0 m with 1 m depth ranges, respectively.
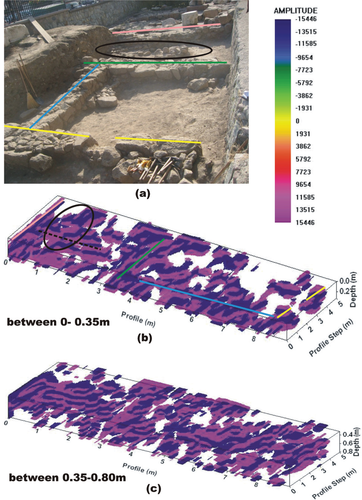
East side–1: a) excavation result at the 0.5 m depth, b) transparent 3D sub-volumes between 0–0.35 m, c) between 0.35–0.80 m.
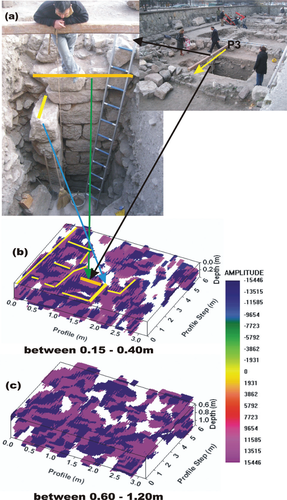
East side-2: a) excavation result of 1.5 m × 2.5 m surface area between 0–4.0 m depth, b) transparent 3D sub-volumes between 0.15–0.40 m, c) between 0.60–1.20 m and d) between 0.15–1.30 m.
It was also known that the amplitudes of the remains decreased according to time. If opacity coefficients could be different than 1 and 0, then the decreased amplitudes could be weighted by these coefficients (Kadioglu and Daniels 2008; Kadioglu and Kadioglu 2010). However, the amplitude scale was weighted by a constant coefficient, changing with the time range of the 3D sub-volumes, which was bigger than 1 and smaller than 2 and had a decimal number in the REFLEXW program to see the remains with the same colour range. The weighting reduced the maximum and minimum amplitude value of the amplitude-colour scale for increasing depth ranges as seen in Fig 9(c,d) and Figs 10 and 11 in order to reveal deep buried remains. Figure 9(c) shows a solid 3D data sub-volume representing a 50–100 cm depth range of the cella and Fig. 9(d) indicates transparent visualization of the same data volume for the already constructed opaque function for the amplitude-colour scale of the interested depth range, which activated an amplitude range bigger than (–10798) and (10798) for the weighted new amplitude-colour scale of the interested depth range.
A good transparent 3D display for the transparent half bird’s eye view was also achieved by carefully selecting the viewing angle. The resulting display of transparent 3D volume, including remains located in their proper spatial positions could allow a more complete interpretation. Figure 10 shows other 3D sub-volumes of the cella of the temple. Selecting a depth range depends on the interpreter. While depth range is increasing, small details could disappear in 3D volume because of the decreasing opacity range of the maximum amplitudes to obtain more sensitive transparent visualization. Figure 11 represents transparent 3D displays of the full GPR data set in three parts including 3D displays of Figs 9 and 10. Other study areas, East side–1, East side–2 and East side–3 of the temple, were also visualized by the same approximation. Some 3D half bird’s eye views of the transparent sub-volumes are presented in Figs 12 and 13.
RESULTS AND INTERPRETATION
Without doubt, the most important site was inside of the temple. The profiles (Fig.7) and the traditional time slices with constant depths (Fig. 8) indicated that the underground of the cella included buried wall remains especially on the sides and between 12–15 m of the cella. Indeed, it was difficult to decide whether there was a main wall, revealed on the surface between 13–15 m, on the time slices. The reason could be that the walls had huge rock blocks that interspaced broadly, laterally and longitudinally. These walls might have been damaged or broken in the past. However, the walls appeared to be more intact in the transparent 3D data volumes of the definite time ranges (depth ranges) in Figs 9–11 than time slices at constant depth (Fig. 8). The transparent 3D data volumes visualized all remains with depth changing. Figures 7–11 suggest that the cella had more complicated wall remains, between 9–19 m on all profiles, until 2 m of depth. Unfortunately, an excavation could not be carried out to verify the visualization results because of the stability problem of the temple walls. Confirmation of the results could be supplied by comparing the excavations of the East side and their 3D visualization results. East side–1 was excavated to 0.5 m depth (Figs 5a and 12a) and an excavation was carried out in East side–2 between profiles 2–5, 1.5 m in width and 4 m in depth (Figs 5b and 13a). Transparent half bird’s eye views of East side–1 could indicate a strong similarity with the excavation results (Fig. 12b,c), although this side had some decomposed rock groups and there was a base of cemented rock dating from near time at depth 0.5 m. Therefore the excavation was stopped at 0.5 m depth. The buried wall remains in East side–2 were also started very near to the surface and saw some changing until approximately 4 m depth of the transparent 3D images and time slices (Figs 13 and 14). Figure 13 indicates excavation results and some transparent half bird’s eye view of the 3D display near to the surface. Figure 14 shows some depth slices to help determine buried remains individually and understanding transparent 3D sub-volumes. The excavation confirmed the wall remains between 0.5–1.5 m on profile 3 until depth 4 m (Figs 13 and 14). The other East side results have shown similar wall remains. The half bird’s eye view of the transparent 3D data volume and its time slices visualized the wall grids very well. Although it was thought that there could not be remains like a very narrow wall grid in this very small area, there were visible remains like this next to East side–3 on the surface at the end of the East side of the temple (Fig. 5c). The time slices with different depths and their volume imaging in Figs 13 and 14 indicated the wall remains belonging to the 3 m × 6 m surface where any other geophysical method could not give a more sensitive result than the GPR method. In addition the entire area was composed of rock groups, urban disturbance, iron fence etc. Both time slices and transparent 3D imaging became very successful for the determination and specification of the buried remains. In addition, the half bird eye’s view of the transparent 3D data volume visualized all states of the remains.
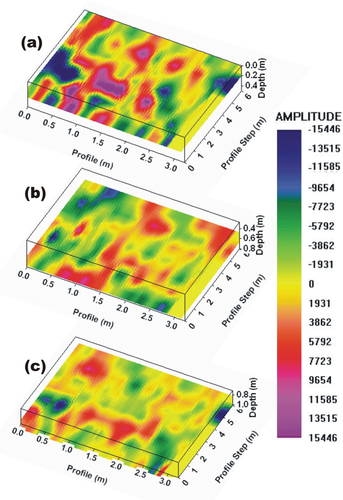
Time slices at constant depths a) 0.16 m, b) 0.62 m, c) 0.96 m, d) 1.24 m of East side–2.
The last aim of the study area was to determine whether there were iron clamps or not in the temple walls made of marble. The temple walls were almost 12 m high (www.gisdevelopment.net). A lot of cavities were seen on the wall (Figs 4 and 6), which had been excavated to be used in unknown wars. Therefore, we tried to acquire data on a profile on the East wall along 1.5 m height in the cella (Fig. 6). The clamps were seen very clearly on the processed radargram (Fig. 15) with narrow diffraction hyperbolas. In addition, the thickness of the wall was determined as approximately 0.9 m with 0.11 m/s according to the results of the velocity analysis (Fig. 16). The wall had two marble lines whose boundary was seen at the 0.45 m thickness on the radargram (Fig. 15). The clamps were on this boundary. If appropriate access facilities were made available, the data on the whole walls could have been acquired on parallel profiles spaced with approximately 15 cm. After data processing, all cavities and iron clamps could be imaged like buried archaeological remains on the depth slices (according to the thickness of the wall) and in the transparent half bird eye’s view of the 3D image of the sequenced radargrams of the wall profiles with carefully selected thickness ranges.
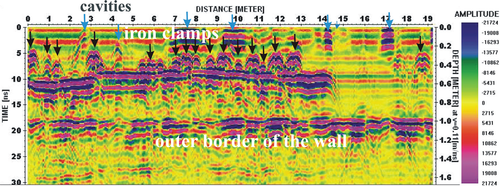
Processed radargram gathered from the profile on the East wall (inside of the cella).
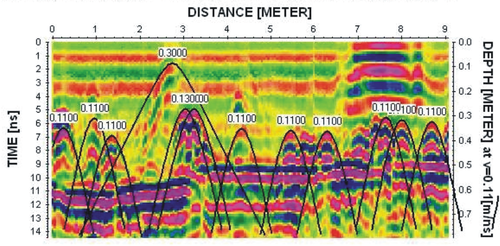
The velocity analysis on the radargram of the wall profile.
CONCLUSIONS
Knowledge of the spatial distribution of the wall structures is fundamental for archaeologists. Defining buried walls and mapping the location of high-quality undisturbed structures can indicate the best way in which to minimize excavation costs. The purpose of the GPR data presentation is to display the processed data, closely approximating an image of the underground, with the wall discontinuities to help the archaeologist. An interactive transparent 3D half bird’s eye view of the 2D data set can be achieved by carefully assigning both the amplitude-colour scale and its opacity range together with a carefully selected viewing angle and time range. The transparent 3D imaging proved successful in specifying changes in the wall structures underground, accurate x-y wall locations and accurate depths.
ACKNOWLEDGEMENTS
The author would like to thank The Ministry of Culture and Tourism of Republic of Turkey, the Foundation of Museum of Anatolian Civilizations in Ankara, Turkey and its dear staff (deceased) Hikmet Denizli, Emel Yurttagul, Oguz Bostanci and all their team members, as well as Earth Sciences Application and Research Center (YEBIM) of Ankara University for supporting this project. The author would also like to thank Dr Ali Akin Akyol (Ankara University, Restoration and Conservation Programme, Ankara, Turkey) and Prof. Yusuf K. Kadioglu (Ankara University, Geological Engineering Department, Ankara, Turkey) for their cooperation during the measurements and excavations. The author acknowledges the helpful suggestions and grammar corrections of the reviewers.


