Geophysical modelling of the Ebersbrunn diatreme, western Saxony, Germany
ABSTRACT
The Ebersbrunn diatreme near Ebersbrunn, western Saxony, Germany, causes an elliptical Bouguer anomaly of about –2.5 m Gal, which covers an area of approximately 2.2 km × 2 km and an elliptical magnetic anomaly with values between –250 nT and 1000 nT about half a kilometre smaller in diameter and situated within the southern part of the Bouguer anomaly. Considering magnetic susceptibility and density values determined from core samples of the diatreme, a symmetrical, cone-shaped body with an oval surface outcrop of 2 km × 1.5 km and a dip angle of the slopes of about 82° is modelled. It comprises a central structure with a diameter of 800–900 m and susceptibility values up to 9000*10−6 SI higher and densities up to 220 kg/m3 lower than the surrounding chimney. Additionally, susceptibility within the body increases with depth and decreases with the degree of weathering. The geometry can clearly be associated with the diatreme of a maar-diatreme-volcano. Regarding the petrographic information (the occurrence of pelletal lapilli as juvenile phase, the basaltoid character of the occurring ground mass of magmatic origin and 80% wall rock content) and the final geophysical model, the Ebersbrunn structure can definitely be regarded as the partially eroded remnant (diatreme and root zone) of a maar-diatreme-volcano. The association of earthquake swarms in intraplate regions of intersecting fractures and volcanism has led to renewed interest in the eroded maar-diatreme-volcano.
INTRODUCTION
During a regional survey of the Earth’s magnetic field in the 1960s made by the former VEB Geophysik Leipzig, Germany, an anomaly different from the typical anomalies of the region was detected close to Ebersbrunn, western Saxony, Germany (Jäger 1964). The area of investigation is an integral part of the Variscan Orogen of Central and Western Europe, located at the northern rim of the Vogtland synclinorium (series of Ordovician to Lower Carboniferous, mostly metasediments). The Kirchberg granite, a Variscan late-collisional granite massif of western Saxony (Förster 1999) outcrops about 1 km south of the magnetic anomaly (Tschudinowski et al. 1983).
From subsequent investigation it emerged that the magnetic anomaly is caused by a deeply eroded volcanic structure mainly consisting of breccias of basaltic tuff (Jäger 1964). Petrographic analyses showed pelletal lapilli to be one of the juvenile components, which led to the conclusion that the volcanic rock evolved from a primary Si-under saturated, alkali-ultramafic initial melt (Kroner et al. 2006, Fig. 4). This ‘structure’ is situated in a region of uranium deposits and so it was mapped in detail during prospection campaigns of the SDAG Wismut (uranium industry in former East-Germany) in the 1970s. A compilation of geological features of the Ebersbrunn eruptive breccias for the last 40 years was published by Berger (2008).
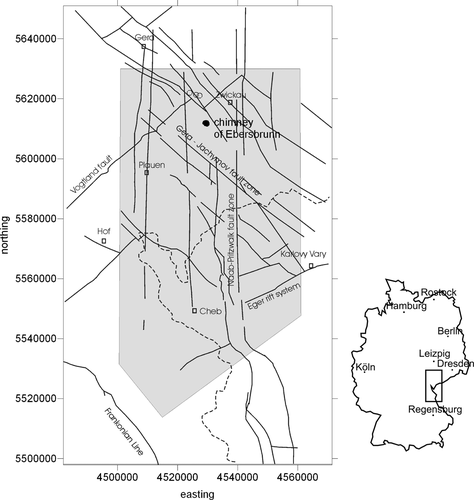
Overview of fault zones after Bankwitz et al. (2003) and Hemmann et al. (2003). The grey shaded area indicates the southern part of the seismically active Regensburg-Leipzig-Rostock lineament. The open circles depict the averaged centres of the swarm earthquakes of 1986, 1997/1998 and 2006 (after Neunhöfer et al. 2005 and Korn et al. 2008). The sketch on the right indicates the location of the area of interest relative to Germany.
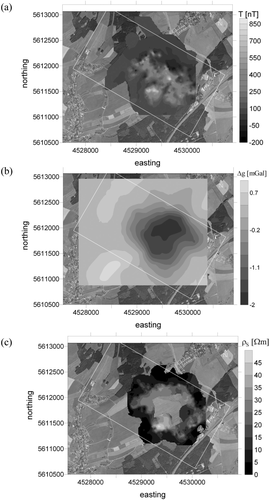
Contour maps of a) magnetic total field, b) Bouguer anomaly and c) electrical conductivity. The white line marks the modelling area.
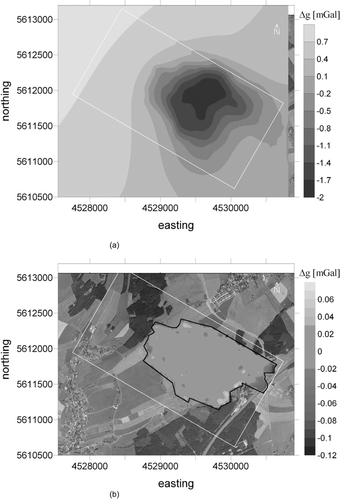
a) Modelled Bouguer anomaly, b) residuals within the surface outcrop (black line).
Recently, the structure came back into the focus of geophysical interest because it is situated close to locations of several swarm earthquakes that occurred in September 1986, December 1997/ January 1998 (Hemmann et al. 2003) and August 2006 (Korn et al. 2008). The 1997/98 swarm consisted of more than 200 single events and the 2006 swarm of about 40 events, both with magnitudes (ML) up to 2.0. Earthquake swarms usually occur at fault intersections (Neunhöfer and Hemmann 2005). Bankwitz et al. (2003) concluded from satellite images, geomorphologic observations and the distribution of epicentres from the swarms of 1985/1986, 1994, 1997 and 2000 in the Vogtland/NW-Bohemian area, that the N-S trending Počátky-Plesná fault zone is the seismically active fault zone within the Cheb basin. This fault zone forms the southern part of the Regensburg-Leipzig-Rostock zone (Bankwitz et al. 2003), at which the Werdau swarm earthquake area is situated (LFUG 1996, Korn et al. 2008). At seismically active sections of this fault zone, recent and fossil paths for fluid and magma ascension were found (Kämpf 2003; Bräuer et al. 2009; Mrlina et al. 2009). Close to Werdau, the Regensburg-Leipzig-Rostock zone is intersected by the NW-SE trending Gera-Jachymov fault zone (Fig. 1). Additionally, the occurrence of swarm earthquakes at plate margins and in continental rifts is associated with recent volcanism and/or triggered by migration of mantle fluids (Špičák 2000; Bräuer et al. 2003, 2008, 2009; Kurz et al. 2004; Ibs von Seht 2008).
The Ebersbrunn tuff chimney is a first indication of past volcanic activity in this area of the Regensburg-Leipzig-Rostock zone. Successive investigations concerning the volcanic remains give primary information on the genetic classification of the structure (Kroner et al. 2006).
Based on gravity, magnetic and electrical conductivity data collected during field trips of the Department for Applied Geophysics of the Friedrich Schiller University (FSU) in Jena in 2003, 2004, 2006 and 2007 and data from former investigations of the tuff chimney, a large amount of data were assembled. This data set was used for gravimetric and magnetic 3D modelling to investigate the structure of the tuff chimney and infer its genetic classification.
DATA BASES
The area of interest is situated south-west of Zwickau and covers about 4 km2. It is mainly used for farming. Topography is smooth with a slight gradient to the SSW (height difference of about 50 m). The rock enclosing the diatreme is an Ordovician metasediment (Phycodes Group). All data presented in the following use Gauss-Krueger coordinates in WGS84 datum.
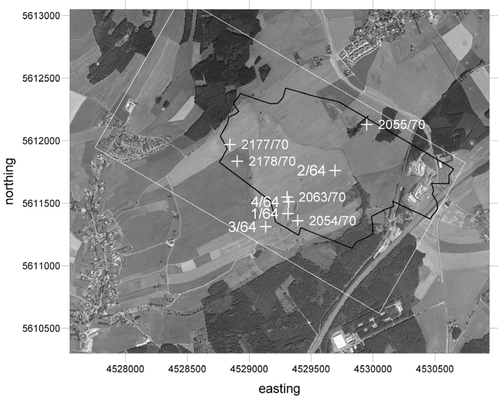
From the first investigations on the basaltic tuff breccias in the tuff chimney (‘Tuffschlot’) by Jäger (1964), a division of the anomaly was made into three NNW-SSE striking zones according to measurements of the z-component of the Earth’s magnetic field. The core samples (see Fig. 2 for location and Table 1 for depth of the exploratory drillings of the former VEB Geophysik: 1/64, 2/64 and 4/64 and the drillings of the former SDAG Wismut: 2054/70, 2055/70, 2063/70, 2177/70 and 2178/70) consist of tuffite (diatreme breccia), containing crustal xenoliths incorporated into a fine matrix of clinopyroxene, phlogopite, amphibole, magnetite, spinel, ilmenite and calcite. Pelletal lapilli up to 4 mm in diameter were found in the ground mass (see Kroner et al. 2006 for further details). Heavy minerals (clinopyroxene, amphibole, zircon, magnetite, ilmenite and garnet) likewise occur in the alluvial deposits SW of the Ebersbrunn diatreme breccias (Modalek et al. 2009). The well logs include the description of differently weathered rock. Highly weathered material is much more porous than the weathered and fresh material. There are differences in colour. Density and susceptibility data refer to three different degrees of weathering, susceptibility is also dependent on zone (zones I–III, Fig. 3a and below). Mean values of magnetic susceptibilities measured on the core samples are given in Table 2.
| Well | Final depth | Volcanic material |
|---|---|---|
| 2054/70 | 141.7 m | up to 50m |
| 2055/70 | 126.0 m | completely |
| 2063/70 | 148.9 m | completely |
| 2177/70 | 160.2 m | completely |
| 2178/70 | 163.8 m | completely |
| 1/64 | 67.5 m | completely |
| 2/64 | 33.3 m | completely |
| 4/64 | 50.5 m | completely |
 derived from drilling cores (Tschudinowski et al. 1983; Jäger 1964). Numbers in brackets give the depth of the corresponding layer, the last number refers to final depth
| Classification, bore hole nbr. | ||||
|---|---|---|---|---|
| Susceptibility | Minimum zone 4/64 | maximum zone I 1/64 | maximum zone II 2/64 | Density |
 |
150–400* 10−6 SI (14 m) | 1400* 10−6 SI (6 m) | 1000* 10−6 SI (10.7 m) | 2350 kg/m3 |
 |
150–400* 10−6 SI (39.3 m) | 3000* 10−6 SI (25.6 m) | 2500* 10−6 SI (21.5 m) | 2480 kg/m3 |
 |
1000* 10−6 SI (50.5 m) | 4000* 10−6 SI (67.5 m) | 2000* 10−6 SI (30 m) | 2700–2750 kg/m3 |
From the surveys of the former VEB Geophysik Leipzig and the former SDAG Wismut around Ebersbrunn, a detailed geological mapping of the area is available containing the results of multiple flat drillings up to a maximum of 10 m depth to map the outcrop of the diatreme. Additionally, data exist from several deep drillings, five within the diatreme (well locations are shown in Fig. 2). Overall depth of the wells and thickness of the volcanic material are shown in Table 1, results of the density measurements of the volcanic material and the surrounding metasediments are summarized in Table 2.
The most extensive data set is provided by the FSU Jena and results from various field trips and measurement campaigns of the authors. Gravity, magnetic and electrical conductivity data were collected.
Locations were determined using the Topcon GTS-6 total station (position and height) for gravity and the endpoints of magnetic profiles; otherwise a handheld Garmin GPS (position) was used. The maximum error for each station amounts to 0.08 m in height and 4 m in location.
The magnetic total field was measured with a GSM856 proton precession magnetometer from Geometrics. This instrument has an accuracy of 0.2 nT. Measuring points are located along profiles, profile distances range from 20–200 m, distances of points along the profiles range from 5–40 m. All in all, 5200 points were measured (Fig. 3a). In order to obtain the anomaly of the Earth’s magnetic total field from the data, a value from outside of the diatreme (48586.6 nT) was subtracted from all data values, hence, the distinction between maximum and minimum zones is relative. A contour plot was created by interpolation using Kriging (Fig. 3a, search radius 150 m). The plot shows a prominent maximum zone in the south-western part of the anomaly (zones I and II, values up to 1000 nT), followed to the north by a narrow minimum zone with values up to −350 nT (zone III). The maximum area is divided into two parts characterized by the distribution and shape of the anomalies within. In the very south, a positive anomaly that is circular in shape occurs with an amplitude of 800 nT (zone I). It is followed by an elongated area consisting of several small maxima with amplitudes up to 1000 nT to the north. An exact allocation of maximum and associated minimum is not possible, which could be caused by a very steep geometry of the underground bodies. Pole reduction of the data was therefore considered unnecessary. The contour plot in Fig. 3(a) also shows the high-frequency part of the anomaly, which is associated with shallow, small sources. Those are too small to be modelled. To remove these components before modelling, a low-pass filter with a cut-off wavelength of 70 m was applied.
Figure 3(c) shows the map of electrical conductivity, created using Kriging (search radius 150 m). It was derived from resistivity data collected using Wenner configuration and conductivity data collected with the Slingram method. The resistivity measurements were carried out with a SYSCAL-R1 in which penetration varies between 5–20 m. Varying point distances and electrode spacing similar to the depth of penetration were used; a total of 160 points were measured. Conductivity was measured using the EM31-SH from Geonics Ltd, distance of the coils was 2 m, frequency of the transmitter coil 9.8 kHz and the vertical coils mode was used. With these settings, penetration depth is about 3 m. Measurements were carried out along profiles or on a grid, point distances range from 10–15 m and profile distances from 10–60 m. Data were recorded at about 2900 points. To unify both data sets, data from an area covered by both methods were compared; resistivity values were converted into conductivities. Both methods gave similar results and therefore the difference in penetration depth is presumed to be negligible. The map of electrical conductivity shows a central area with high conductivity surrounded by a zone of low conductivity. The boundary between the zones is marked by a steep gradient that matches in general the outcrop of the diatreme given by geological mapping of Tschudinowski (1983). A steep contact of diatreme and schist, representing materials with different electrical conductivity due to different porosity of the two zones, leads to this strong gradient.
Measurement points for gravity are located along 9 profiles, distances between the points vary from 50–100 m and distances between the profiles are between 100–500 m (Fig. 3b). 340 points were observed with the LaCoste & Romberg G896 and D187 gravimeters. Without loop measurements, an accuracy of 0.01 mGal can be achieved with these gravimeters (Torge 1989). To obtain a Bouguer anomaly of comparable accuracy from observations, coordinates of measurement points have to be known better than 12 m in the horizontal position and 0.03 m in height. The maximum error in height (0.08 m) creates a maximum error in the Bouguer values of 0.025 mGal, which is well within the intended accuracy for modelling. For deriving the Bouguer anomaly, the following corrections were applied: instrument drift, tide correction, latitude correction, free air and Bouguer plate correction (reference density: 2670 kg/m3). No terrain correction was applied, as the influence of the topography was estimated to be less than  from its flat terrain. Furthermore, a regional field taken from Hofmann et al. (2003) was subtracted to obtain the local Bouguer anomaly. This reduction is necessary because of the strong regional gradient of the Kirchberg granite, which is located approximately 1 km south of the measurement area. The resulting contour map is shown in Fig. 3(b), which was derived using Kriging with a search radius of 800 m. The map shows an elliptically shaped minimum of about –2.5 mGal having an extent of 2.2 km × 2 km.
Both the Bouguer and magnetic grid were used directly for modelling. The conductivity data were used to determine the outcrop of the volcanic body, this was used as a boundary condition on the surface. The wells were used for the determination of the vertical extent of the volcanic body in general and the differently weathered layers (according to Tables 1 and 2).
3D-MODELLING
All available information on the area of modelling was integrated into two 3D models to model the Bouguer anomaly and magnetic total field. For forward modelling, the program package IGMAS (Interactive Gravity and Magnetic Application System) was used (Götze and Lahmeyer 1988; Schmidt and Götze 1999). Using this software, the subsurface is divided into vertical, parallel planes (modelling planes). Within these planes, vertices are defined and linked to closed polygon lines separating complexes of different density or susceptibility. Between the planes, boundaries of the modelled bodies are derived by forming triangles between the vertices of corresponding polygon lines. Thus, the surfaces of all modelled bodies are entirely approximated by triangles. This approximation was used for the calculation of the Bouguer anomaly and magnetic total field.
The first step of forward modelling is to create a starting model, based on all known boundary conditions. This starting model is then interactively modified until the calculated anomaly of the model and the observed anomaly agree. Boundary conditions used for modelling the Ebersbrunn diatreme are the following: mapped surface outcrop, density and susceptibility values of the volcanic rock and the surrounding schist and point information on the thickness of the volcanic rock (Tables 1 and 2). To include this information from drilling, the boreholes were projected onto the corresponding model planes. The thicknesses of the layers described for each borehole were kept fixed during modelling. Various other authors have shown that the use of data sets as described above can be successfully used for modelling purposes (e.g., the Baruch maar (Gabriel 2003)), as well as kimberlite pipes (Macnae 1995; Sarma 1999).
The 3D gravimetric model consists of 23 planes. The distance between the planes varies between 60–80 m, modelling depth is 700 m. Following Jäger et al. (1964), a significant density contrast is to be expected between weathered, fresh material and highly weathered material (cf., rock description in Table 2). Therefore, of the 13 different bodies the modelled diatreme consists of ten representing the unweathered and weathered tuffite (diatreme breccia), one the highly weathered tuffite (diatreme breccia) and one the Ordovician schist. Density parametrization was carried out according to Tschudinowski et al. (1983), with permissible changes up to 250 kg/m3, as the individual density information from drilling is local. One body represents the Kirchberg granite with an adjusted density of 2730 kg/m3 compared to 2620 kg/m3 from Hofmann et al. (2003). This body is necessary in the model, because the reduction of the regional field according to Hofmann et al. (2003) (cf., ‘Data bases’) only partly removes the gradient of the granite. The residual gradient is therefore reduced in the model itself. In the final model, residuals between the modelled and measured Bouguer anomaly are less than 0.025 mGal, which amounts to a very high degree of agreement. The modelled Bouguer anomaly and residuals are shown in Fig. 4. The volcanic material has density differences with respect to the surrounding schist between 39–220 kg/m3. Within the modelled chimney, there is a gradient in density from NW to SE of 30 kg/m3. The central region has the lowest density values compared to the surrounding volcanic rock, the maximum difference is 181 kg/m3. The lowest density within the model is assigned to the highly weathered basaltic tuff (top layer).
The model of the Earth’s total magnetic field consists of 29 planes with distances between 30–80 m, modelling depth is 100 m. Modelling of induced magnetization requires the parameters of the Earth’s magnetic field at observation time. These data were taken from the Geological Survey of Canada (2006) website (declination 1.25°, inclination 66°, absolute value 48700 nT). Each body representing the diatreme in the gravimetric model was separated into three bodies for magnetic modelling, in order to better represent changes in susceptibility due to different degrees of weathering (Jäger 1964). One of the bodies represents the Ordovician metasediments. Susceptibilities within the model are based on Jäger (1964) (Table 1). The volcanic material shows remanent magnetization (Jäger 1964) but there is no information on its orientation. Therefore, remanent magnetization could not be taken into account in the model and the complexity of the pipe also makes it difficult to infer the bulk direction of remanence from the relative positions of dipolar anomalies. To estimate the resulting error, the total magnetic field of a simplified model (three susceptibilities, steps at 30 m and 60 m) with various directions of remanent magnetization and known  -values was calculated and compared to the measured anomaly. The intention was to reproduce anomaly structures with long wavelengths. The best fitting model was the model considering only induced magnetization. Possible explanations are: 1) remanent magnetization of the tuff within the chimney is small compared to other tuff deposits (Parés et al. 1993; Paoletti et al. 2005), 2) in the fall deposits forming the diatreme, remanent magnetization will most likely be oriented randomly, so within the diatreme, there are no big areas with homogeneous orientation of remanent magnetization. Therefore, the error resulting from the consideration of the induced magnetic field only for modelling is very small (estimated deviation of calculated field is less than 5%). The anomaly caused by the bodies of the final model and the residuals are shown in Fig. 5, residuals are below 30 nT in most of the modelled area. However, there are small, local areas with residuals up to 120 nT, which are located between the modelling planes. A better adjustment between the modelled and measured field in these locations is only possible by increasing the number of model planes, which was not possible for the model at hand. Additionally, as the long wavelength part of the anomaly is in the focus of interest, modelling of the short wavelength part is considered unnecessary and the fit to the long wavelength parts of the field is adequate.
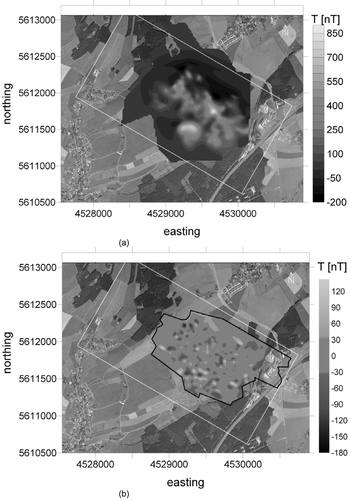
a) Modelled magnetic total field anomaly, b) residuals within the surface outcrop (black line).
The magnetic anomaly caused by the diatreme is due to magnetite (and some ilmenite) in the tuffite up to 3.5–6 weight % according to Jäger (1964) and Modalek (2009). As the distribution of juvenile material is chaotic within the structure and the amount of country rock is up to 80% (Jäger 1964), susceptibility of the tuffite varies strongly within the diatreme. It is however higher than the susceptibility of the surrounding schist. Differences between both materials range from 10*10−6SI to 9000*10−6SI. The strong variations within the diatreme are represented in the model by steeply inclined separate bodies with different susceptibilities. The magnetic model also shows a central region, characterized by higher susceptibilities (290–8000 T).
3D views of both models are shown in Fig. 7. Note that while the gravity model has a vertical extent of 700 m, the magnetic model only covers 100 m. Both models are identical in their surface and in the shape of their flanks. Comparison of the extension of the highly weathered layer and the central structure with high susceptibility and low density shows that differences between both models are small and they can be regarded as identical. The final model contains the following characteristic features: a central area with physical parameters differing from the rest of the diatreme; steep slopes; an oval surface outcrop of approximately 2 km × 1.5 km; a gradient of susceptibility with increasing depth and a weathering layer with low density and low susceptibility.
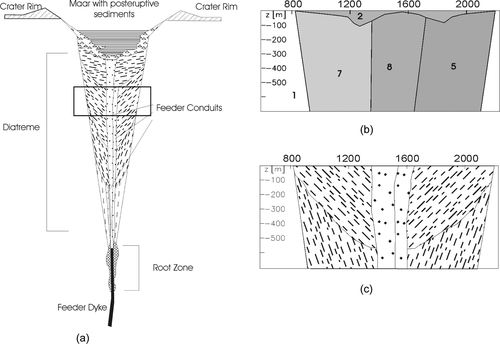
a) Sketch of a maar-diatreme-volcano, after Lorenz (1986), b) plane 11 of the gravity model, c) detail of (a), marked by black rectangle.
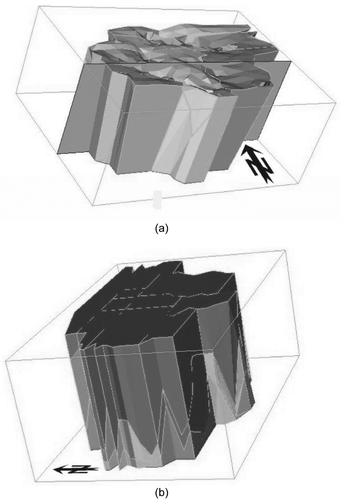
a) 3D view of the gravimetric model (vertical extent: 700 m), colours according to density (light grey 2550 kg/m3 to dark grey 2706 kg/m3), b) 3D view of the magnetic model (vertical extent: 100 m), colours according to susceptibility (dark grey 100*10−6 SI to light grey 9000*10−6 SI).
DISCUSSION AND CONCLUSIONS
According to the equivalence principle, potential fields allow for an infinite number of possible solutions. To provide a realistic model, boundary conditions must be taken into account. The derived model is constrained by various boundary conditions from physical parameters of the rock to layer depths from drilling. It can thus be considered realistic. The final model shows the investigated structure as a cone-shaped body with steep flanks and a diameter of ca. 1.75 km. There is a central region, characterized by high susceptibility and low density values, with a diameter of about 850 m. The uppermost layer of the volcanic material is highly weathered and extends down to – 100 m. Jäger (1964) already described the magnetic anomaly of Ebersbrunn as a tuff chimney (‘Tuffschlot’) (cf., ‘Data bases’). The model inferred from the present study confirms this hypothesis. The characterization of the volcanic material within the chimney (pelletal lapilli as juvenile phase, high wall rock content) as well as its geometrical layout confirm the assumption of an eroded maar-diatreme-volcano. Further detailed comparison with specific properties of diatremes strengthens this approach.
Following Lorenz (1986), the oval surface diameter of the modelled volcanic body is too large for a diatreme (tens of metres up to 1.5 km, Lorenz 2003). Lorenz (1986) and Lorenz et al. (2003) stated that the estimation of depth to which pipes are eroded today is difficult. Based on assumptions on the geometry of diatremes and maars, esp. possible maar diameters of up to 3 km, a diatreme can have a diameter of up to 2.5 km. Therefore, the modelled body is within the possible range for diatremes and has to be considered as the upper part of a diatreme within an eroded relic of a maar-diatreme-volcano. The comparison in Fig. 6 shows that the geometrical features obtained from the final model are similar to those of the upper half of a diatreme.
In this depth range, the centre of a diatreme is characterized by feeder conduits of late eruptions (Figs 6a and 6c), which can have diameters of up to 70 m. As maar-diatreme-volcanoes are dominated by multiple eruptions (Lorenz et al. 2003, conclusion by analogy to eruptions of scoria cones), a large number of feeder conduits can be built up alongside and within each other. Feeder conduits are characterized by low contents of country rock (Lorenz and Kurszlaukis 2007). If country rock with high density and low susceptibility is assumed, geophysical parameters of the feeder conduits area of the diatreme would be of low density and high magnetic susceptibility values. This description is consistent with the modelled inner part of the chimney. Surrounding the feeder conduits, the upper part of a diatreme is built by steeply dipping tephra layers (Figs 6a and 6c). Single layers are distinguishable by their dipping angle and, if the root zone of the maar-diatreme-volcano migrates through different county rock during the eruptions, also by the type of country rock contained. This causes a variation of density with depth, which can only be covered by models with great modelling depth. Variation in the density of the juvenile material cannot be expected, as maar-diatreme-volcanoes are monogenetic (Lorenz et al. 2003). The model derived fits these observations on maar-diatreme-volcanoes. Tephra layers of the outer region of the diatreme are represented in the model by partial bodies with steep slopes, with variable mean densities and susceptibilities (Fig. 6b). Such variations can be created during the eruption, for example by a preferred orientation of fractures in the country rock, which leads to a higher content of country rock at one side of the diatreme. They can also be caused by secondary fluid migration after relaxation of the groundwater level (Lorenz et al. 2003), which generates mineral alteration.
To understand the Ebersbrunn diatreme within the context of the Werdau swarm earthquake region (Hemmann et al. 2003; Neunhöfer and Hemmann 2005; Korn et al 2008), further investigations are necessary. Petrography, mineral chemistry and petrochemistry of the volcanic material must be studied to derive information on the origin of the rock. Ar/Ar analysis of phlogopite and amphibole and U-Pb or U-Th/He analysis of zircon may lead to age determination of the magmatic evolution of the magmatites and the diatreme. Extensive analysis of the diatreme material can be used to clarify if the short wavelength part of the magnetic anomaly is caused by hydrothermal alteration of minerals, by varying content of country rock, by weathering/mineral transport processes (placer deposits), or by combination of all these features and processes. Hydrothermal migration at the end of the active volcanic phase is typical for maars and can indicate recent mantle fluid migration. Thus, we think that the reason for the recent swarms of earthquake activity, which could have been caused by the intersection of fractures and the hydrological conditions in the region, may have continued from the time of the formation of the volcano.
Maar-diatreme-volcanoes usually occur within volcanic fields (Lorenz et al. 2003); they are an equivalent to scoria cones and occur if magma encounters groundwater during its rise. This leads to the hypothesis that in the area of Ebersbrunn further covered volcanic bodies may exist. They could equally show anomalies in the magnetic total field as well as in gravity. Magnetic anomalies could be too small to have been discovered yet, or may have been ‘one-point-anomalies’ that were not further investigated. Small gravity anomalies may be masked by the large regional gradient. They would likewise not appear in geological maps, as the diatreme material consists of 80% country rock and is therefore difficult to detect. A detailed mapping of the magnetic total field might reveal such structures. Their localization could provide further information on the migration of fluids in the Werdau/Ebersbrunn area.
ACKNOWLEDGEMENTS
We would like to thank Dr A. Hemmann, who proposed the Ebersbrunn tuff chimney as a site for geophysical field surveys and all participating students and tutors of the trips in the years 2003, 2004, 2006 and 2007 who acquired most of the data we used. We would also like to thank Dr W. Jäger, who discussed ‘his’ anomaly and results from his work in Ebersbrunn with us. We are much obliged to Mr A. Hiller from the Geological Archive of Saxony (Wismut GmbH, Chemnitz, Germany), who pointed us to unpublished material of the former SDAG Wismut and Mr H.J. Berger and Dr P. Wolf from the Saxon State Ministry of the Environment and Agriculture, Dresden, Germany. Finally, our thanks go to the owners of the fields and meadows the measurements were carried out on. We would also like to thank the reviewers, B.S.P. Sarma and Alan Reid for their comments, which helped to improve the manuscript. We thank the anonymous third reviewer for his valuable input, which led to a further improvement of the manuscript.


