Correction of the attenuation effect of vegetation on airborne gamma-ray spectrometry data using laser altimeter data
ABSTRACT
The interpretation of airborne gamma-ray data is considerably complicated by the attenuating effects of vegetation. In order to correct these effects we used simultaneously measured laser altimeter data to characterize the vegetation cover. To describe the attenuation effect and correct its consequences on gamma-ray data we used a simple model of exponential absorption of monoenergetic gamma-ray photons by an attenuating medium. The determination of the corresponding linear attenuation coefficients for potassium (K), uranium (U) and thorium (Th) is based on data from an airborne geophysical survey in Austria.
INTRODUCTION
Besides weathering conditions that modify the chemical composition of the original bedrock sources, overburden is predominantly locally derived and thus reflects the bedrock geochemistry below it. By measuring the abundances of potassium (K), uranium (U) and thorium (Th) of the upper 30–45 cm (Grasty 1976; Minty 1997) in rocks and weathered materials, airborne gamma-ray spectrometry provides useful information for geological, geochemical and environmental mapping (IAEA 2003). While K directly emits gamma-rays when 40K decays to argon, the abundance of 238U and 232Th is measured indirectly by detecting the gamma-rays emitted by their daughter nuclides (238U → 214Bi, respectively 232Th → 208Tl). Since U and Th are not measured directly equilibrium conditions within the decay series are required and therefore the levels are usually reported as ‘equivalent uranium’ (eU) and ‘equivalent thorium’ (eTh), respectively (Minty 1997).
In the interpretation of airborne gamma-ray spectrometry data one has to consider environmental and other effects, such as soil moisture, rainfall, vegetation, non-radioactive overburden and the movement of airborne sources of radiation in the lower atmosphere (Minty 1997). The focus of the presented study is the influence of vegetation on airborne gamma-ray spectrometry data.
Rubin et al. (1979) concluded that for the average green biomass found in forests of the USA, the gamma-ray angular flux density above 0.4 MeV was reduced by a factor of 1.23. According to Schwarz et al. (1997) the attenuation of count rates caused by forest varies between 5–25%. Aspin and Bierwirth (1997) specified the effect of vegetation in Australia on AGRS element abundances between 13–22% and Pereira and Nordemann (1983) estimated an attenuation of 40–60% for tropical rain forests of 35 m height. According to Schadauer et al. (2007) about 46.4% of Austria is covered by forest. As the attenuation effect of vegetation is clearly quite significant, this number emphasizes the importance of correcting the attenuation-effect of vegetation on Austrian airborne gamma-ray spectrometry data.
In order to characterize forests, Aspin and Bierwirth (1997) used additional information for the survey area such as maps of forest allocation, maps of forest age or digital elevation models. Schetselaar and Rencz (1997) as well as Bierwirth et al. (1998) used Landsat TM satellite data to reduce the effects of vegetation cover on airborne gamma-ray spectrometry data. However, using Landsat TM data for correction implies comparing pixel-based data sets (Landsat TM) with line-based data sets (airborne gamma-ray spectrometry) usually measured at different dates.
Instead, we used measurements from a laser-altimeter, which is routinely used to determine the sensor altitude, to characterize vegetation cover, thereby enabling standard calibration and correction procedures that can be more easily adjusted to account for vegetation.
SURVEY AREA
The method to correct the attenuation effect of vegetation on airborne gamma-ray spectrometry data was developed using abundances of K (%), eU (ppm) and eTh (ppm) calculated for a survey area in the northern part of Austria, close to the border with the Czech Republic (Fig. 1).

Landscape picture and location of the survey area.
The area is situated in the Moldanubikum of the Bohemian Massif whose lithology is mainly characterized by granites and granodiorites of various age and composition (Krenmayr et al. 2006). Seventy four square kilometres, or 38%, of the survey area is covered with forest. According to Bauerhansl et al. (2007) 89% of the forest in the survey area is coniferous forest. Since eighty per cent of the forest area in Austria is covered by coniferous species (Schadauer et al. 2007) this survey area is representative for many regions in Austria.
The airborne survey was conducted in July and August 2008 in a period of low precipitation (around 2 mm/day), daily air temperatures around 18° C and almost still air (around 1.8 m/s). The survey was flown mainly along east-west flight lines covering an area of about 195 km2 with a line-spacing of 100 m and an average terrain clearance of 100 m. The gamma radiation was recorded by a 256 channel GRS410 spectrometer (Pico Envirotec) with 8 downward looking NaI crystals (33.6 litres) and one upward looking NaI crystal (4.2 litres) installed inside a Bell 212 helicopter. About 1800 line-kilometres of data was acquired and processed by the Geophysical Department of the Geological Survey of Austria (GBA) following the recommendations given by Minty et al. (1997). The data processing included aircraft and cosmic background correction; radon background correction using an upward looking detector; Compton correction using stripping ratios (IAEA 1979); height correction using the sensor elevation measured by the laser altimeter; and conversion to elemental concentrations. Since processing takes place using standard gamma-ray windows (40K: 1.37–1.57 MeV, 214Bi: 1.66– 1.86 MeV,208Th: 2.41–2.81 MeV) the energy of gamma-rays from almost all significant gamma ray emitting nuclear fallout radionuclides (including 137Cs; IAEA 2003) is too low to influence our elemental concentrations for K, eU and eTh.
METHODS
Characterizing vegetation cover – height of vegetation
An accurate knowledge of the flight altitude is important for processing airborne gamma-ray spectrometry data. Since radar-altimeters do not penetrate vegetation, laser-altimeters have become an increasingly important component of airborne geophysical systems. Currently the GBA is using a Riegl LD90-3800VHS-FLP high resolution laser altimeter. This laser altimeter registers distances according to the first and the last reflected pulse and operates with a sampling rate of 200 measurements per second. For further interpretation, the distances according to the first pulse within a time window of 0.1 s are represented by their minimum value. The distances according to the last pulse within the same time interval are represented by their maximum value. In an ideal case, the first reflection represents the upper edge of the vegetation and the last reflection represents the ground surface. In reality, the laser beam does not always reach the ground and in these cases the last reflection does not represent the ground surface (curve (1) in Fig. 2). On the other hand, first reflections do not always represent the uppermost part of the vegetation (curve (3) in Fig. 2). Therefore, an upper envelope (curve (2) in Fig. 2) is determined based on the distances of the last reflections and a lower envelope (curve (4) in Fig. 2) is determined based on the distances of the first reflections. To achieve this, the algorithm used first searches for sections with small changes in distances. These sections are supposed to represent directly the ground surface, or respectively, the upper edge of the vegetation. Then the algorithm searches for sections with strong changes (e.g., outliers). These values are replaced by interpolated values between sections with low variations. Finally, a low-pass filter of 0.3 s length is applied. The distance between the envelope from the first reflections and the envelope from the last reflections is interpreted as the height of vegetation  . The estimated lateral resolution along the flight-line is about 0.3 s respectively 10 m (curve (5) in Fig. 2).
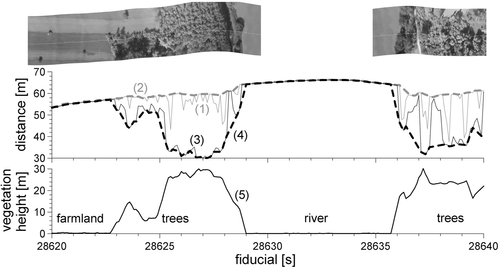
Signals and interpretation of the laser-altimeter over a small section of a profile. Distances according to the last pulse (1) and the first pulse (3) are shown. In addition the upper envelope of the last pulses (2), the lower envelope of the first pulses (4) and the resultant vegetation heights (5) are plotted.
Applying this approach to the laser-altimetry data of the survey area, we calculated a map of the vegetation height  (Fig. 3b). A comparison shows an obvious correlation between the calculated vegetation heights
  greater than 15 m (Fig. 3b) and the mapped forest (Fig. 3a; Bauerhansl et al. 2007).
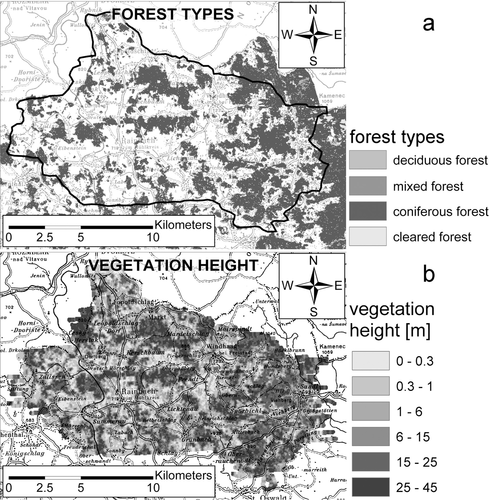
a) Types of forest in the survey area (after Bauerhansl et al. 2007). b) Vegetation heights  determined from laser altimetry. Note that areas with vegetation heights
  correlate with mapped forest.
Airborne gamma-ray spectrometry vegetation correction
 (1)
(1)whereas  is the element abundance on the ground without an attenuating medium and
  is the determined abundance in the presence of an attenuating medium of height
  with a linear attenuation coefficient
  . Since the correction of the attenuation effect of the air between the ground surface and the detector is part of the standard processing, the attenuation coefficient
  in this study refers exclusively to vegetation.
The basic idea of the proposed method is to determine the linear attenuation coefficients  for K, eU and eTh by correlating the abundances of these elements with the vegetation height derived from laser altimetry (Fig. 3b). This implicates the assumption that, for the data sets used to determine the attenuation coefficients for vegetation, the variations in the element abundances are mainly caused by the attenuation effect of vegetation and not by variations in the lithology. In other words there should be the same lithology or at least the same composition of the lithology in relation to vegetation throughout the considered area. Therefore, the available data set was divided into data sets each representing one of the geological units according to the 1:200.000 geological map of the region (Krenmayr et al. 2006; Fig. 4). Furthermore, by dividing the data set this way, it is possible to investigate whether or not the attenuation coefficient of vegetation
  is influenced by the lithology. Therefore, from all the geological units in the area, we selected six units (see Fig. 4) containing the most airborne gamma-ray spectrometry data records to determine the attenuation coefficients
  .
.
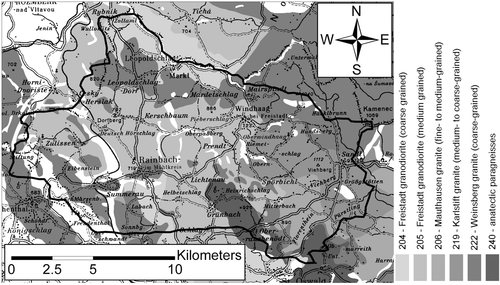
Simplified geological map (based on the geological map 1:200.000, Krenmayr et al. 2006) of the survey area showing units selected to determine the attenuation coefficients  .
.
To avoid damping effects on airborne gamma-ray spectrometry data caused by morning dew we used only data from survey flights that started after 10:00 in the morning. Furthermore, we excluded measurements over inhabited areas and at terrain clearances higher than 130 m. The rest of the data set (about two-thirds of all the airborne gamma-ray spectrometry data from the survey area) was used to calculate best-fit curves for K, eU and eTh according to equation (1).
An example of one of the geological units is given in Fig. 5. The histogram-plots of Fig. 5 clearly show that the maximum of the levels of K, eU and eTh in forested areas is significantly lower than in areas with very low vegetation. One can also notice that the values of eU are very low. Accumulations of zero-values indicate inaccuracies in the radon background correction and the Compton correction in the U-channel. Furthermore low abundance values are connected to low count rates and thus to relatively high standard deviations (Minty 1997). Nevertheless, the coefficients for eU are in the same range as those of K and eTh (compare mean and standard deviation values in Table 1). The calculated element abundances on the ground without an attenuating medium  and the linear attenuation coefficients
  for the chosen geological units are summarized in Table 1.
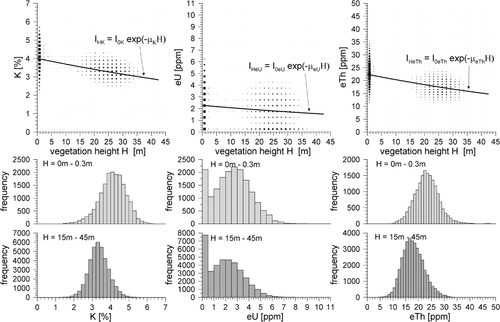
Determination of the attenuation coefficients  for the geological unit 222 (cf., Fig. 4). The topmost graphs show the correlation of vegetation height
  versus the determined abundances. The sizes of the displayed dots reflect the number of data-samples in their vicinity. In addition, best-fit curves are plotted. The histogram-plots show the frequency distributions of the abundance values of K, eU and eTh for very low vegetation (0–0.3m) and forests (15–45 m). Accumulations of zero-values in the plots for eU indicate inaccuracies in the radon background correction and the Compton correction in the U channel at low eU values.
 and linear attenuation coefficients
  for the selected geological units (cf., Fig. 4). The last row gives the mean and standard deviation values for K, eU and eTh
| Unit numbera |  (%) (%) |
 (m1) (m1) |
 (PPm) (PPm) |
 |
 (PPm) (PPm) |
 |
|---|---|---|---|---|---|---|
| 204 | 3.2 | 0.010551 | 1.8 | 0.009377 | 17.5 | 0.010164 |
| 205 | 3.7 | 0.010113 | 2.5 | 0.009536 | 20.1 | 0.008767 |
| 206 | 3.3 | 0.011414 | 2.0 | 0.010577 | 11.9 | (0.002864) |
| 219 | 3.7 | 0.010485 | 2.2 | 0.013749 | 15.8 | (0.017505) |
| 222 | 4.0 | 0.008086 | 2.3 | 0.009367 | 22.4 | 0.009854 |
| 240 | 2.9 | 0.007842 | 2.3 | 0.013599 | 16.1 | 0.006992 |
| mean | 0.009749 | 0.011034 | 0.008944 | |||
| ± std.dev. | ± 0.001449 | ± 0.002094 | ± 0.001433 |
- a According to the 1:200.000 geological map (Krenmayr et al. 2006).
A comparison of the attenuation coefficients  from the same element at different geological units shows only little influence of the underlying lithology on the attenuation coefficients
  . Therefore, for the correction of the damping effect of vegetation we calculated the mean attenuation coefficients
  , and
, and  from all selected geological units (see the last row in Table 1). In these calculations, we did not use the coefficients
  for eTh at the geological units 206 and 219. The anomalous coefficient values of these units are generated by significant violations of the assumption that, for the determination of the attenuation coefficients
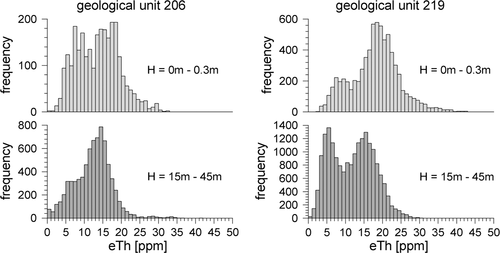
  , variations in element abundances are mainly caused by the attenuation effect of vegetation. At the frequency distribution of eTh values for geological unit 206 (Fig. 6), there are two maxima at vegetation heights between 0–0.3 m indicating the existence of two radiometrically different units. The maximum at the lower values is almost vanished at vegetation heights between 15– 45 m. As a consequence the attenuation coefficient
  is too low (cf. Table 1). On the other hand, the frequency distribution of eTh values (Fig. 6, right-hand side) for geological unit 219, shows two distinct maxima at vegetation heights between 15–45 m. At vegetation heights between 0–0.3 m, the maximum at the lower values is much smaller than the one at higher values. As a consequence the attenuation coefficient
  is too high (cf. Table 1). In both cases, the variations in element abundances were not mainly caused by vegetation. Indeed, they were also caused by the existence of radiometrically different subunits within the mapped geological unit whose appearances are connected to vegetation.
APPLICATION OF THE VEGETATION CORRECTION
 (2)
(2)(cf. equation (1) and Table 1) where  is the corrected abundance of element
  ,
,  the measured abundance of element
  and H the calculated vegetation height. A comparison (see Fig. 7) shows that forested areas are clearly correlated with minimums in the uncorrected abundances of K, eU and eTh (marked with capital letters A–F). This correlation is diminishing or even vanishing when compared with corrected abundances of forested areas.
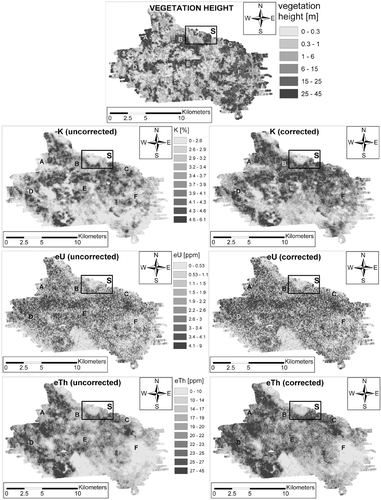
Abundances of uncorrected and corrected K, eU and eTh in the survey area. The topmost picture shows the vegetation heights  . Some of the forested areas are marked with capital letters (A–F). In addition, the location of a subarea ‘S’ is plotted.
Furthermore, we compared the airborne gamma-ray spectrometry results with a newer geological map (Schubert and Finger 2010) with a scale of 1:50.000. Unfortunately, this more detailed map does not cover the whole survey area and therefore could not be used to preselect the airborne gamma-ray spectrometry data for the determination of the attenuation coefficients  and
and  .
.
For a detailed discussion of the results we selected a subarea (Fig. 8 and area marked with ‘S’ in Fig. 7). The geology of this subarea is dominated by ‘Weinsberg granite’ (unit number 48) in the south and ‘Freistadt granodiorite’ (unit number 24) in the north. The given unit numbers are according to the geological map 1:50.000. For the unit numbers according to the geological map 1:200.000 see Fig. 1. Geochemical analyses of rock samples show that the abundances of K, U and Th are higher for ‘Weinsberg granite’ (6 samples, K = 4.7±0.5%, eU = 3.8±2 ppm, eTh = 36±8 ppm; Alletsgruber 2007) than for ‘Freistadt granodiorite’ (5 samples, K = 2.8±0.1%, eU = 1.9±0.7 ppm, eTh = 6.2±1.4 ppm; Gasser 2006). This sectioning also appears in the airborne gamma-ray spectrometry abundances of K, eU and eTh (Fig. 8). In particular, the abundances within the ‘Weinsberg granite’ (48) are much more uniform for the corrected than for the uncorrected values. Since the rock samples were taken from the same lithological units but not inside the survey area, a direct comparison between the airborne gamma-ray spectrometry abundances and the concentrations from geochemistry is not possible. Instead we calculated mean and standard deviation values for all corrected AGRS abundances from ‘Weinsberg granite’ (K = 4.1±0.6%, eU = 2.5±1.2 ppm, eTh = 23.7±4.3 ppm) and ‘Freistadt granodiorite’ (K = 2.7±0.6%, eU = 0.9±0.7 ppm, eTh = 12.8±3.5 ppm). This comparison shows the same orders of magnitude for the abundances of all three elements in these two geological units.
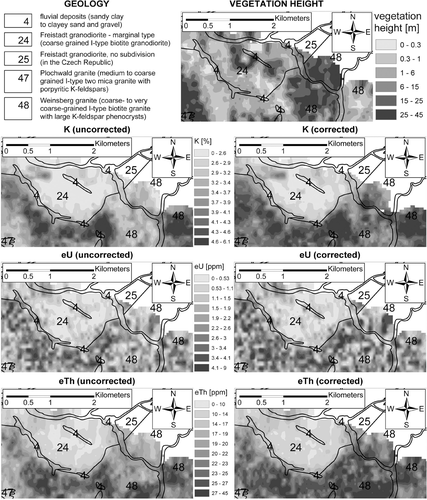
Abundances of uncorrected and corrected K, eU and eTh in the selected subarea. The topmost picture shows the vegetation heights  . In addition, all graphs show the geological situation according to the 1:50.000 geological map (unit numbers according to the geological map 1:50.000).
DISCUSSION
An analysis of the calculated vegetation heights  in the survey area indicates an average tree height of 25 m. For this height, the attenuation effect on element abundances is 22% for K, 24% for eU and 20% for eTh. These values are well comparable to the values given by Schwarz et al. (1997; 5–25%) and Aspin and Bierwirth (1997; 13–22%).
Based on the assumption that the calculated attenuation effect is caused only by the attenuation properties of wood, we can use the vegetation height  to give a rough estimate of the average biomass in the forests of the survey area. Results from Woods et al. (1965) indicated that wood, containing around 50 per cent by volume of water, has a mass attenuation coefficient very similar to that of water. According to Grasty (1979) the mass-attenuation coefficient of water is 0.00585 m2/kg for K, 0.00532 m2/kg for U and 0.00433 m2/kg for Th. Using the ratio of the determined attenuation coefficients
  (cf., Table 1) and the mass-attenuation coefficients given by Grasty (1979) we achieve a biomass for a vegetation height of
  of 42±6 kg/m2 for K, 52±10 kg/ m2 for eU and 52±8 kg/m2 for eTh. Please note that these numbers include about 50 per cent by volume of water. On the other hand, the ‘Federal Forest Office’ of Austria (F. Perzl, pers. comm.) estimated the average dry over-ground forest-biomass in the survey area at around 15 kg/m2. Considering a bulk density of spruce of about 350 kg/m3 and adding 500 kg/m3 of water (50% by volume) the density increases by a factor of 2.4. Therefore, the biomass also increases from 15 kg/m2 by a factor of 2.4 to 36 kg/m2 for wet biomass. Since this value does not include dead wood and ground vegetation, the numbers for the biomass estimated from the airborne geophysical survey are just slightly too high. However, to what extent the vegetation height
  from laser altimetry is able to deliver useful information on biomass requires further detailed investigations.
CONCLUSION
Based on airborne geophysical data from a survey area in the northern part of Austria we developed a correction method for the attenuation effect of vegetation. This method is based on an exponential absorption of mono-energetic gamma-ray photons by an attenuating medium (vegetation). The vegetation height is determined by laser altimetry simultaneously conducted with airborne gamma-ray spectrometry measurements on the same survey platform. The advantage of this method is that vegetation is characterized by a parameter measured at the same time and the same position as the airborne gamma-ray spectrometry measurements. Furthermore, we need only one device to measure ground clearance and vegetation height.
The application of this attenuation correction illustrates that forested areas no longer appear as minima in airborne gamma-ray spectrometry abundances and that corrected abundances correlate much better with the mapped local geology than uncorrected abundances. Since the forest of the survey area predominantly consists of conifers, the attenuation coefficients μ are only valid for this type of forest. For other types of forest further studies are required.
ACKNOWLEDGEMENTS
We thank K. Motschka for fruitful discussions on many aspects of gamma-ray measurements and inversion. We thank G. Schubert for providing geological information to generate Figs 4 and 8 and for sharing his broad knowledge about the geology of the survey area. Finally, we wish to acknowledge the ‘Department of Forest Inventory’ and the ‘Department of Natural Hazards and Alpine Timberline’ of the ‘Federal Forest Office’ (BFW) of Austria for providing information about forest types to generate Fig. 3 and for statistical information about forests in Austria.


