Software Failure Probability Quantification for System Risk Assessment
Abstract
Risk caused by safety-critical I&C systems considerably affects overall plant risk. Software failures in digitalized I&C systems must be considered as the cause of risk. As digitalization of safety-critical systems progresses, the need for software failure probability quantification increases. For the software of safety-critical systems, very high reliability is required. This article aims at providing an overview of promising software failure probability quantification models for this kind of safety-critical system: The software reliability growth model (SRGM), the input-domain-based test model (IDBT), and the validation/verification quality model (VVQM). In order to accommodate the characteristics of safety-critical systems, a more effective framework of practical risk assessment applications is necessary. In this article, we propose the combined use of SRGM&VVQM for a more systematic and traceable method of the failure probability quantification of safety-critical software.
1. Introduction
The probabilistic risk/safety assessment (PRA/PSA) has been widely used in the nuclear industry for licensing and identifying vulnerabilities to plant safety since 1975. PRA techniques are used to assess the relative effects of contributing events on system-level safety or reliability. They provide a unifying means of assessing physical faults, recovery processes, contributing effects, human actions, and other events that have a high degree of uncertainty [1]. The PRA quantitatively demonstrates an improvement and deterioration of a developed system. The PRA also provides useful design information since it could demonstrate that a balanced design has been achieved by showing that no particular class of accident of a system causes a disproportionate contribution to the overall risk.
Many of recent safety-critical systems are digitalized. One of the most important safety functions in nuclear power plants (NPPs) is the generation of automated control signals for manipulating complicated accident-mitigation equipment including the control rod driving mechanism for reactor trip. For this safety-critical signal, many NPPs have adopted modern digital instrumentation and control (I&C) technologies [2]. The report published in 1997 by US National Research Council [3] states that appropriate methods for assessing safety and reliability are key to establishing the acceptability of digital instrumentation and control systems in safety-critical plants such as NPPs. The HSE’s guide [4] also pointed out the importance of the PRA for software-based digital applications as a demonstration of safety.
The field experience of US nuclear plants during the period 1990 through 1993 shows that software error caused a significant number of digital system failures [5]. Software errors (30 failures) are the dominating causes of the digital system failure events in comparison with that only 9 events were caused by random component (hardware) failures. In addition to that, since these failures could cause common-mode or cause failure, which might remove the redundancy effect if the same software is installed in redundant systems and can lead to significant safety events, the software failure analysis is inevitable for realistic PSA results. That is, in order to perform the PRA of digitalized safety-critical systems, the software failure must be considered.
On the other hand, it is notable that there is much discussion among software engineering researchers about whether a software failure can be treated in a probabilistic manner [6]. Software faults are design faults by definition. It means that software is deterministic and its failure cannot be represented by “failure probability.” However, the faults in software cause system failure only when the input sequence activates those faults. If we assume the randomness of the input sequences in the real use of software, its failure could be treated based on a probabilistic method. However if the input profile of the software can be determined statistically, we can estimate the software reliability in a probabilistic manner based on the input profile [7].
There are some methods which treats the software failure probability in a statistical manner. The software reliability growth model is the most mature technique for software dependability assessment, which estimates the increment of the reliability as a result of a fault removal. Another popular method is the input-domain-based (demand-based) estimation of software failure probabilities using the results of testing a single piece of software code. On the other hand, the number of remaining potential faults in a piece of software is reduced by using software validation and verification (V&V) activities. This effect must be considered on the probability estimation of the software failure events by the quantification of the rigidity of software V&V.
In order to accommodate the characteristics of safety-critical systems, the risk assessment framework of software failure must be more systematic and traceable. The use of V&V rigidity for estimating the parameters in statistical software reliability model will increase the traceability.
In this article, we briefly explain these promising methods for software failure probability quantification (Section 2), and propose an approach for their combined use for more effective application to the PRA of safety-critical systems which include ultrahigh reliable software (Section 3).
2. Software Failure Probability (SFP) Quantification Methods
2.1. Software Reliability Growth Model (SRGM) for SFP Quantification
The SRGMs are one of the most mature techniques for software dependability assessment. SRGM is a mathematical model which estimates the increment of the reliability as a result of a fault removal by regarding the number of software faults detected in a time interval and the software failure-occurrence time interval as the random variables. SRGM captures failure behavior of software during testing and extrapolate to determine its behavior during operation. SRGM uses failure data information and trends observed in failure data to estimate the parameters and derive reliability predictions. The SRGM uses failure data information and trends observed in failure data to estimate the parameters and derive reliability predictions. Using failure data like time between defects or defects observed in some interval, defect rate (or logarithm of defect rate) versus cumulative defects is plotted. Based on the plot, the model parameters are estimated. Using the parameters derived, the failure rate and mean time to failure are computed for the models. Generally, the SRGM produces software reliability, residual fault content, mean time between software failures, software release time, and so on.
There have been various kinds of classifications for SRGM [8, 9]. They include Musa Basic Model, Goel Okumoto Non-Homogeneous Poisson Process (NHPP) Model, Musa Okumoto NHPP Model, Musa Poisson Execution Time Model, Jelinski Moranda Model, Littlewood Verall Model, Weibull Model, Raleigh Model, Delayed S-shaped Growth Model, Exponential Model, Logarithmic Poisson Model, Imperfect Debugging Model, Inflection S-shaped Growth Model, and Logistic Model. Each model can have its own best fitting failure data. This means that the model selection is very crucial to producing meaningful reliability predictions. Among the above models, the SRGMs of which major parameters are a and b can be considered as leading candidates for the application to an NPP PSA. This is because they are relatively simple and traceable from the evidences of the predictions. a means the expected number of faults in the software when the testing starts. b stands for the fault detection rate per remaining fault in the software.
The SRGM must meet many assumptions in view of software testing and repair [9]. Some SRGMs assume testing follows an operational profile, but practically it is difficult to define operation profile and perform operational tests. They also assume that software does not change, except that defects are fixed when discovered, and repair is immediate and perfect. However, in practice, defects may not be repaired immediately and the repair of defects may introduce new defects. In summary, the assumptions for the SRGM are an open problem because they are often violated in one way or another.
Limitations of the SRGM that are applied to a safety-critical software system need to be considered to evaluate the applicability of the SRGM to an NPP PSA [10]. One of the most serious limitations is the expected total numbers of inherent software faults calculated by the software reliability growth models that are highly sensitive to time-to-failure data. After long time-to-failures, drastic decreases in the estimated total number of inherent software faults are frequently observed for the SRGM. This sensitivity to time-to-failure data indicates that the resultant high software reliability could be a coincidence in the calculation process. One of other limitations is that although many failure data are needed, we cannot be sure that the sufficient amount of failure data is revealed during the development and testing of a safety-critical software system.
Nevertheless, many studies reported that the SRGM performs well in practice. Particularly, SRGM showed quite a good performance in predicting the additional test effort needed to achieve a desirable quality level during system tests and predicting the number of remaining failures that could be reported after release at the end of system test. Furthermore, two industrial applications of reliability measurement, which are described in [11], should be noted. In both cases, the SRGM predicted failure rates well despite distributional assumption violations. This demonstrated that reliability measurement based on the SRGM may be used in industry including a NPP PSA.
2.2. Input-Domain-Based Test (IDBT) for SFP Quantification
When developing a safety system, software testing takes a significant effort. The testing is performed in a very specific manner for each system. In contrast to the SRGM which considers the debugging phase data, the input-domain-based test (IDBT) focuses on the final product testing results. Sohn and Seong [12] insist that there are no unique criteria to prove whether enough testing has been performed even though various testing methods exist. However, if we assume the randomness of test cases and the even distribution of the usage profile, the calculation method for the required number of tests can be derived by using conventional statistics [13].
The number of observed failures of a highly reliable software during a final test is expected to be zero because the elucidated errors will be debugged in the corresponding code and the test will be performed again. If the successive demands are assumed as statistically independent Bernoulli trials, based on binomial distribution, the confidence level C is expressed using the random variable T as the number of tests before the first failure and U as the required number of tests as
If we use Bayes’ theorem, the posterior probability density function of the SFP is
More detailed explanations for the above calculations are available in reference [13]. Software testing is classified as either structural testing or functional testing [12]. Structural testing is based on the structure of the software and depends on the data flow or control flow of the software. Functional testing is based on the functional requirements of the software and is used for integrated software testing. The IDBT uses the test results of functional testing. INL report [14] insists that high-integrity software validation testing (such as model-based statistical testing) has demonstrated as a success in the computing industry and should be investigated through an application to an NPP demonstration.
On the other hand, the selection of proper test input sets is another problem. Every testing technique has a limit to its ability to reveal faults in a given system. Chen et al. [15] proposed to adjust software reliability using the results of the time and code coverage of the software debugging phase test. In the case of the IDBT, the focus must be at the development and utilization of input profile.
A PRA model represents the hazard probability of a given system or plant. That is, it consists of initiating events and mitigation failure events. We focus on the mitigation failure caused by software failures. Software failures may cause new initiating events in addition to the conventional ones, but we limit the scope of this study to the mitigation failures.
The test cases should represent the inputs which are encountered in an actual use. The test inputs for the safety-critical application such as a reactor protection system (RPS) of an NPP are the inputs which cause the activation of a protective action such as a reactor trip (mitigation action). Input profile must be determined for effective software failure probability quantification. A software treats inputs from instrumentation sensors as discrete digital values which were converted by using an analog-to-digital converter. Then the input profile to the RPS must be estimated based on this characteristic of software and the plant dynamics. One more important characteristic is that we do not have to repeat the test for the same input value since the software response is deterministic for each specific digital input. In consideration of these characteristics of software, Kang et al. [13] proposed an input-profile-based SFP quantification method.
2.3. V & V Quality Model (VVQM) for SFP Quantification
Direct reliability measurement approaches, such as testing, have severe limitations in demonstrating the proper level of reliability for safety-critical software [16, 17]. These limitations can be overcome by using some other means of assessment. One of the main candidates is claims based on quality of the development process of a software.
Especially in the nuclear industry, regulatory body in the most countries dos not accept the concept of direct quantitative reliability goals as a sole means of meeting its regulations for reliability of digital computers in NPPs. For example, US NRC’s reliability acceptance of computer systems is based on deterministic criteria for both hardware and software [18].
The point of the deterministic criteria is to assess the whole development process and its related activities during the software development life cycle (SDLC) for the acceptance of a safety-critical software, and software V&V plays an important role in this process. The purpose of V&V is to develop highly reliable software and to satisfy regulatory body’s licensing criteria.
V&V consists of mature methodologies and has detailed and concrete techniques that can evaluate the quality of the development process and documents produced during the whole SDLC. Furthermore it can get information or input data reliably without relying on the specific software development method or process. This makes V&V method very practical in the real application. There are lots of development methods and new ones are appearing rapidly, so sometimes we may not obtain proper input data for a certain reliability assessment method if the method requires some specific input dataset. Figure 1 depicts an example of the main V&V activities during the SDLC for safety-critical software [19]. In this example, the main activities in the requirement/design phase are review of licensing suitability, Fagan inspection [20], the formal verification, the software configuration management, the software safety analysis, and various test tasks.
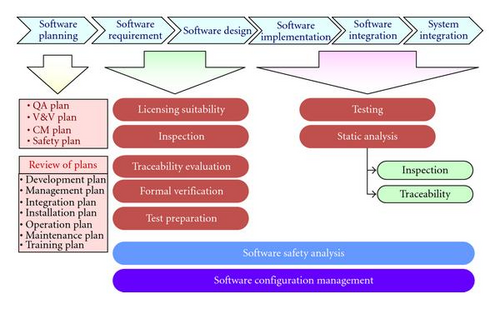
As shown in the Figure 1 the development process of a software can be considered in order to assess the expected software failure rate. The number of remaining potential faults in the software is reduced by using software V&V methodologies. This effect needs to be reflected on the probability estimation of the software failure events. Thus, the quantification of rigidity of software V&V could be performed through the PRA process.
The Bayesian belief network (BBN) has been widely used for estimating the effectiveness of these quality-improving efforts in a more systematic manner [21, 22]. Applying the BBN methodology to the PRA of digital equipment is helpful to integrate many aspects of software engineering and quality assurance. In evaluating software reliability, it can explicitly consider the important factors which are relevant to the reliability, such as the quality of the developer, the development process, the complexity of the problem, the testing effort, and the operation environment, [23]. It is widely recognized that the quantitative reliability of safety-critical software is hard to be assessed by any specific method [17]. For this reason a human-expert combines lots of various evidences and induces a conclusion about the reliability of safety-critical software. This kind of expert′s judgment is expressed representatively in the license process of a digital system for a NPP [24]. However the combining of a great many information and inference process is not easy for a human [25]. BBN has the ability to solve this difficulty in a consistent and systematic way, so BBN-based reliability evaluation method seems promising.
There still exist some difficulties in the practical application of the BBN. For example, it is difficult to obtain the knowledge from the experts in a form that can be converted into a probability distribution [26] and there is not enough software failure data, especially in the nuclear field, which can be used as the reference for the validation of a constructed BBN model.
The indirect reliability measurement method including V&V also has some limitations. There is no enough failure data of safety-critical software gathered in the real operation of NPPs, so it is hard to quantitatively correlate the safety-critical software which was developed by a certain development method with the failure data of the software. Also even if such failure data is available, the reliability derived from the failure data cannot be guaranteed when the software is used in the different operation circumstances. The reason is that we think software reliability is determined by the combination of the faults in the software and the input which triggers the faults.
3. A Combined Use of SFP Quantification Methods for Ultrahigh Reliable Systems
Correct parameter estimations are essential for the successful application of the SRGM. However, without sufficient test data, it is often difficult to estimate the parameters. Therefore, if the parameters of SRGM are estimated in spite of insufficient test data, the application of the SRGM to ultrahigh reliable systems would be more tractable. Section 2.3 explains that the VVQM based on the BBN can be used for estimating the effectiveness of these quality-improving efforts like software V&V in a systematic manner [21, 22]. The VVQM is expected to be useful to estimate reliability factors reflecting the quality of software development process. In addition, reliability goal setting and correlation analysis for major parameters of the SRGM would help it to be more practically used for NPP PSA [27]. To be more concrete, once the VVQM estimates a, the acceptable range of b is determined through the reliability goal setting and the correlation analysis. Then the VVQM estimates b. If the estimated b is within the acceptable range, reliability data could be obtained through the SRGM with the estimated a and b. Based on these thoughts, this work proposes a method for the combined use of the SRGM and the VVQM which is described in the following subsections.
3.1. Model Selection
Generally, it is necessary to select appropriate SRGMs, considering many criteria, to estimate software reliability. Criteria used for software reliability model selection have been proposed [8], including life cycle phase, output desired by the user, input required by model, trend exhibited by the data, validity of assumptions according to data, nature of the project, structure of the project, test process, and development process. There exist various kinds of SRGMs, as mentioned in Section 2, and additional model selection criteria are required specifically for the SRGM.
If a software project produces a certain failure data set that is appropriate to the use of a specific SRGM, it is easy to apply the SRGM to the project. If a set of failure data can be obtained from other similar projects, the SRGM which is fit to the data set will be selected. However, if gathering failure data from the projects is difficult, the degree of fitment on available failure data and the prediction capability of models can be selection criteria for SRGM. Williams evaluated six popular software reliability growth models in view of the fitment degree and the prediction capability [28]. The models include Delayed S-shaped Growth Model, Exponential Model, Logarithmic Poisson Model, Imperfect Debugging Model, Inflection S-shaped Growth Model, and Logistic Model. The former three models are two parameter models and the last three models are three parameter models. The prediction capability of each model was analyzed using four famous data sets. This work estimated the parameters and evaluated the goodness of fit of each model using 80% of the failure data. It also compared prediction capability of the models by validating against the rest 20% of the data. Williams pointed out that the Delayed S-shaped Growth Model can be a good candidate though the Logistic model shows the best overall failure data prediction capability. This is because the prediction variation between the two models is very small (less than 5%) and the implementation of two parameter models is easier than that of three parameters. In this study, we applied the Delayed S-shaped Growth Model based on the result of this precedent study.
3.2. BBN for Parameter Estimation
As mentioned earlier, the BBN is one of the most promising methods of the VVQM that can be used for estimating a parameter (i.e., estimated number of defects) of a software reliability model. The BBN model for a particular SDLC can be constructed by (1) creating general phase-BBN models, (2) customizing general phase-BBNs to a particular software development project, and (3) combining and linking these customized phase-BBNs into an entire SDLC BBN model. The SDLC of safety critical software for NPPs basically consists of a requirement phase, a design phase, an implementation (coding) phase, and an integration phase. The development phases have common activities, which are defined as the following object-oriented classes.
- (i)
Conversion process level in a current phase: this class models the number of defects which are introduced in the current development process. Defects that occurred in documentation are not included in this class.
- (ii)
Documentation level in a current phase: this class models the number of defects introduced in the documentation works in the current phase.
- (iii)
Inspection quality in a current phase: this class models the number of defects removed by the inspection activities. Traceability analysis activity might be included in this class.
At each development phase in an SDLC, the final product from the previous phase is converted into a specific form which the current phase requires. For example, at design phase, the requirement specifications are converted into design specifications. From this point of view, the number of defects included in the final product of a certain phase is relevant to the number of (1) defects included in the final product from the previous phase, (2) the defects introduced in the current conversion process and documentation, and (3) the defects which were removed by the inspection activities. The representative causal model for a software defect prediction was presented in a recent BBN study [10]. This causal model can be adapted to the specific circumstances where software V&V plays an important role in a development and license process. The BBN for this causal model for software defect prediction has the following object-oriented classes and can be expressed by a BBN graph as shown in Figure 2.
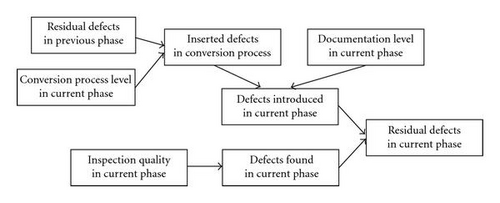
- (i)
Residual defects in a previous phase: this class models the number of remaining defects in the final product developed in the previous development phase.
- (ii)
Residual defects in a current phase: this class models the number of remaining defects in the final product of the current development phase.
- (iii)
Defect prediction model in a phase: this class models the causal relationship which explains the defect numbers in the current development phase.
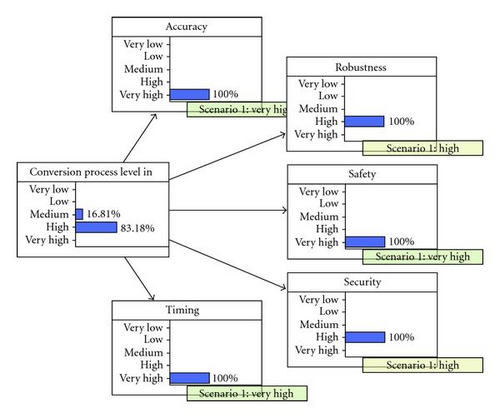
As explained in Section 2.1, the parameter a implies the expected number of faults in the software when the testing starts. The result of the BBN model shown in Figure 2 is “residual defects in current phase” and is corresponding to a. Figure 2 is the top level BBN graph for a software defect prediction. The construction of the detailed BBN graph for the variables appeared in Figure 2 depends on the development environment of the target software. For example, in nuclear industry, V&V plays important role in the development and the licensing process of a safety-level software. In this case the detailed level BBN graph for “Conversion process level in the current phase” can be constructed as shown in Figure 3, which is based on the V&V criteria stated in the regulatory documents. Figure 3 also shows the calculation results of the BBN model. The input to the model was derived from the V&V reports of the real development case.
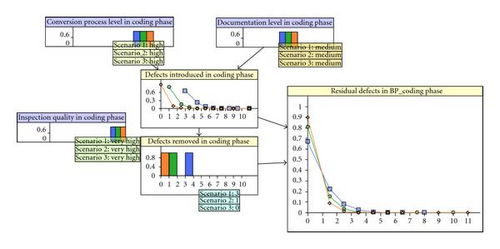
Other top-level variables in the Figure 2 can be constructed with similar process. Figure 4 shows an example BBN of the coding phase of a safety-critical software for a reactor protection systems. The input to this BBN model was also derived from the V&V of a real industry project. By linking the phase-BBNs as described previously, we can get the fault numbers of the target software in the final phase (validation phase or system integration phase) of the development lifecycle.
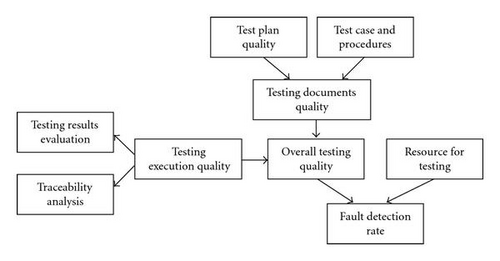
Fenton et al. [23] pointed out that the test process quality affects the fault detection rate in software testing phase. Thus the BBN model for debugging phase can be utilized for the estimation of the fault detection rate of the SRGM. There might be lots of indicators and bases about testing process quality. In this study we used the indicators and basis which can be derived from V&V report by reason of the explanation in the VVQM. In V&V context, the overall testing quality can be evaluated by considering the quality of test documents and testing execution process. The fault detection rate can be calculated with two variables “Overall testing quality” and “Resource for testing.” Top level BBN model of debugging phase for the estimation of the parameter b of SRGM is shown in Figure 5. By using two BBN models, we can estimate b as well as a of the SRGM.
3.3. Reliability Goal Setting and Determination of Application Range
Reliability goal, so to speak, required reliability can be obtained by operational experiences or reliability allocation. Seong et al. assumed the unavailability due to software failure should not exceed 10−4, which is the same requirement as that used for proving the unavailability requirement of the system that the software runs on [10]. The unavailability requirement reflects the operation history of the system in previously constructed NPP. According to their work, the testing period was assumed to be one month, which is the same assumption that is used in the unavailability analysis for the digital plant protection system of different NPP projects in Korea. Software failure rate was calculated using the unavailability requirement (10−4) and mission time. This case study served as an example that a reliability goal can be set based on operational experiences. In case that the same or similar software systems are operated in sufficiently many fields, failure data can be obtained enough to estimate ultrahigh software reliability. The estimated software reliability is a reliability goal in this case.
Reliability allocation deals with the setting of reliability goals for individual components such that a specified system reliability goal is met and the component goals are “well balanced” among themselves [29]. Generally, the component goals are balanced based on development time, difficulty, or risk. For an NPP instrumentation and control system, however, reliability should be as high as possible and not be optimized or compromised by development effort. Thus reliability allocation for an NPP PSA shall be conservatively performed. For example, if the target failure rate of a system is in the order of 10−4, the target failure rate of software should be in the same order.
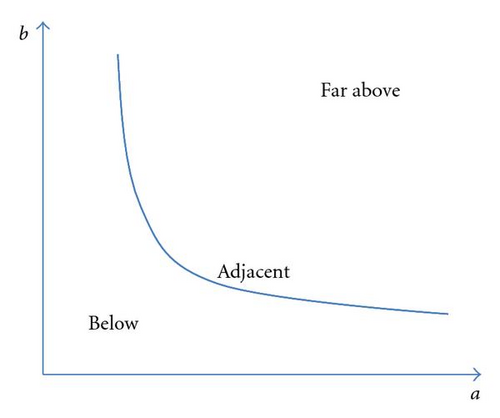
According to [27], the relationship analysis for major parameters considering reliability goal is very helpful for the applicability determination of the selected SRGM. The major parameters of SRGM are a and b. When a software reliability goal is set, the relationship between a and b meeting the reliability goal is uniquely derived. The derivation can be performed by a mathematical simulation like MATLAB simulation. If the relationship between a and b is the curve shown in Figure 6, the curve divides the whole region into “Below” region, “Adjacent” region, and “Far Above” region. If the BBN based estimations drop a and b on “Below” region or “Adjacent” region, the selected model can be applied to NPP PSA. On the other hand, if the parameters estimated based on the BBN models fall into “Far Above” region, the selected software reliability growth model cannot be applied to NPP PSA. The border between the regions is determined by engineering judgments.
After it is determined that the selected model can be applied to NPP PSA, reliability prediction based on the selected model is performed [27]. NPP PSA usually requires failure rate data. Thus the selected model shall capture failure behavior of software during testing and extrapolate to determine its behavior during operation in terms of failure rate. The derived software failure rate is directly applied to NPP PSA as a corresponding basic event frequency.
4. Conclusions
As the digitalization of safety systems progresses, the risk model development and quantification have become an important task in safety assessment of NPPs. In order to utilize the existing PRA models, the method for static modeling of digital equipment is required. Of course the SFP must be included in this model. In this article, we provided an overview of the promising methodologies for SFP quantification and proposed an approach of the combined use of the SRGM and the VVQM for more effective application to the PRA of safety-critical systems which include ultrahigh reliable software. We expect that this method will be especially useful when sufficient test data for estimating the parameters of the SRGM is not available.
Further investigation on the combined use of the VVQM and the IDBT for the SFP quantification is recommendable since it is expected to provide quantitative reliability information through the SDLC and final product.
Acknowledgments
This work was supported by Nuclear Research & Development Program of the Korea Science and Engineering Foundation (KOSEF) Grant funded by the Korean government (MEST), (Grant code: M20702030002-08M0203-00210).


